What is an Immunology Lab & Diagnostics Performance Dashboard?
An Immunology Lab & Diagnostics Performance Dashboard is a centralized platform designed to monitor and analyze the operations of immunology laboratories and infectious disease centers. It provides visibility into lab workflows, testing quality, and equipment performance. Healthcare organizations use this dashboard to track key operational metrics, such as assay sensitivity, analytical accuracy, and specimen rejection rates, allowing lab managers and diagnostics heads to identify bottlenecks, optimize processes, and maintain high standards of testing reliability.
By integrating diagnostics analytics for immunology centers, the dashboard supports evidence-based decision-making. It combines multiple data sources, including laboratory information systems (LIS) and testing equipment outputs, to offer a comprehensive view of lab efficiency and patient testing outcomes. This type of infectious disease testing data dashboard ensures transparency in lab operations and improves service quality for patients and healthcare providers. Furthermore, it consolidates immunology diagnostics performance metrics, enabling detailed performance tracking across test types and staff productivity.
How to Create a Immunology Lab & Diagnostics Dashboard
You don’t need to build your report from scratch—just start with a ready-to-use Immunology lab and diagnostics dashboard template from Mokkup. Add in your data and export it however you like. Here’s how to do it:
1. Create or Log in to Your Mokkup Account
Start by signing up on Mokkup.ai using your email. If you already have an account, just log in, and you’ll be good to go.
2. Choose and Customize Your Dashboard Template
Find the Immunology Lab & Diagnostics Dashboard template in the Templates section. Use the drag-and-drop editor to adjust KPIs, edit filters, or add elements based on your data.
3. Export to Your BI Tool
Once your dashboard wireframe is ready, use the BI Tool Export feature to send it directly to Power BI or Tableau for further analysis and enhancements. You can also download the dashboard as a PDF, PNG, or JPEG, embed it on a platform, or invite your team to collaborate.
Note: This is a Pro template. You’ll need a Pro subscription on Mokkup to use and customize this dashboard wireframe. Upgrade anytime to unlock full access.
Immunology Lab & Diagnostics Dashboard Example
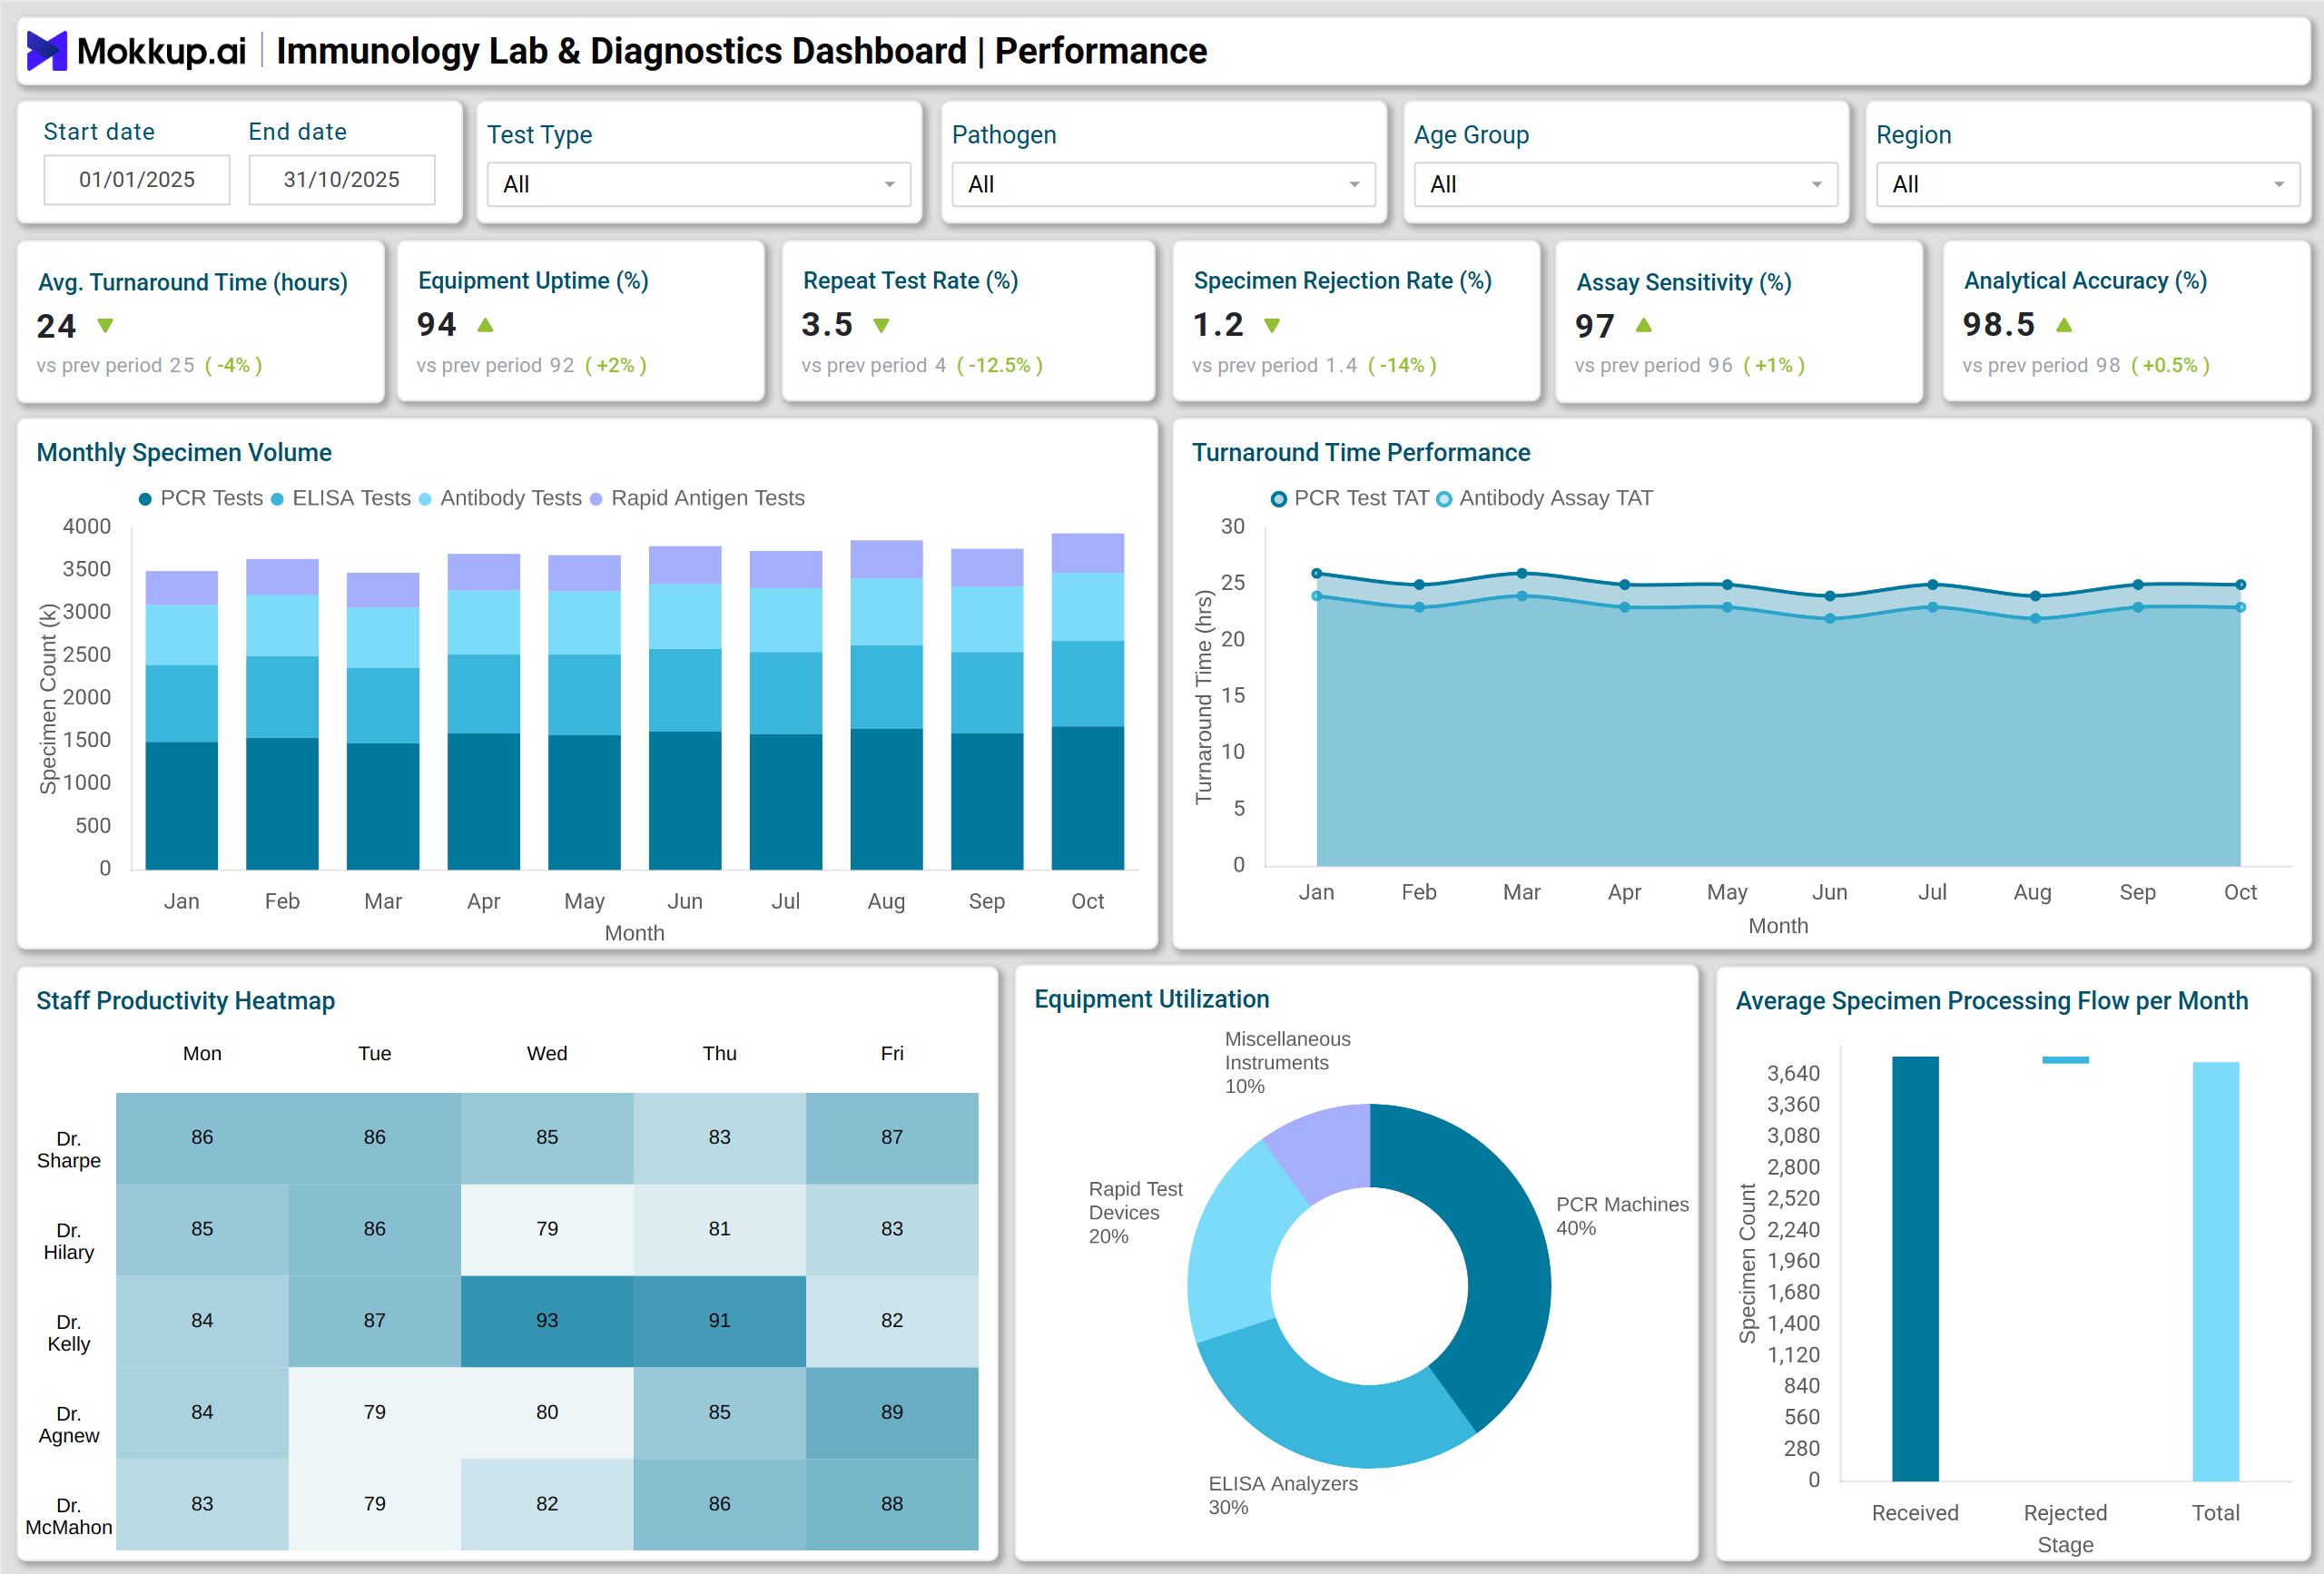
A typical immunology lab performance dashboard displays metrics through interactive visuals and charts. Lab managers can track daily specimen volumes by test type using stacked column charts, monitor turnaround time trends with line charts, and evaluate equipment utilization through pie charts. Heatmaps can visualize staff productivity, while waterfall charts compare specimen rejection versus acceptance.
Other examples include column charts that break down positivity rates by test type, line charts for antibody titer trends, and donut charts representing disease distribution by type. Area charts show antimicrobial resistance trends by pathogen, and funnel charts track testing coverage by population segments. These tools allow labs to visualize lab operations monitoring dashboard healthcare metrics effectively. By integrating a laboratory quality control analytics system, labs can ensure consistent testing standards, maintain high-quality control, and make data-driven decisions.
How to Analyze Data in Immunology Lab & Diagnostics Dashboards
To derive actionable insights and maintain high testing standards, focus on these key analysis areas within your Immunology Lab & Diagnostics Dashboard:
- Monitor Average Turnaround Time (Hours): Identify delays in specimen processing to improve workflow efficiency and ensure timely reporting.
- Track Equipment Uptime (%): Ensure that critical instruments remain operational to prevent testing backlogs and maintain lab throughput.
- Analyze Repeat Test Rate (%) and Specimen Rejection Rate (%): Detect quality control issues early by tracking repeated tests and rejected samples.
- Evaluate Assay Sensitivity (%) and Analytical Accuracy (%): Measure diagnostic reliability and verify that test results meet required performance standards.
- Examine Positivity Rate Trends: Study trends across different test types to detect emerging infectious disease patterns and seasonal variations.
- Review Antibody Titer (Average) and Cycle Threshold (Ct) Average: Assess immune response levels and viral load to guide clinical decision-making.
- Observe Disease Incidence (per 100,000) and Antimicrobial Resistance Trend (%): Monitor community health trends and detect growing resistance risks.
- Ensure Test Positivity Consistency (%): Maintain standardization across testing procedures to ensure reliable diagnostic results.
- Benchmark Diagnostics Performance: Track immunology testing metrics to compare efficiency and accuracy across labs or departments.
Benefits of Immunology Lab & Diagnostics Dashboards
Implementing an Immunology Lab & Diagnostics Dashboard provides comprehensive oversight and helps laboratories maintain accuracy, speed, and compliance:
- Latest Operational Visibility: Gain immediate insight into lab processes to support faster and more informed decision-making.
- Enhanced Testing Quality: Identify assay inconsistencies early and address deviations to maintain testing accuracy.
- Optimized Equipment Utilization: Reduce downtime through proactive monitoring of instrument health and scheduling maintenance efficiently.
- Public Health Monitoring: Track disease incidence and antimicrobial resistance trends to support epidemiological reporting and disease management strategies.
- Improved Staff Accountability: Use performance metrics to assess individual and team productivity.
- Better Patient Outcomes: Ensure timely, accurate diagnostics that contribute to effective clinical treatment.
- Unified Data Management: Integrate multiple data sources to build a single, comprehensive view of laboratory operations.
- Regulatory Compliance Assurance: Maintain standardized testing and meet quality control regulations through automated analytics tracking.
KPIs to Track in Immunology Lab & Diagnostics Dashboards
To maintain high diagnostic accuracy and operational efficiency, laboratories must monitor these critical KPIs that reflect testing speed, quality, and overall lab performance:
- Average Turnaround Time (Hours) – Measures processing speed for lab tests.
- Equipment Uptime (%) – Tracks operational efficiency of lab instruments.
- Repeat Test Rate (%) – Indicates quality issues or testing inconsistencies.
- Specimen Rejection Rate (%) – Highlights errors in sample collection or handling.
- Assay Sensitivity (%) – Ensures tests detect true positives effectively.
- Analytical Accuracy (%) – Measures correctness of diagnostic results.
- Positivity Rate (%) – Monitors infection prevalence across samples.
- Antibody Titer (Average) – Tracks immune response levels in patients.
- Cycle Threshold (Ct) Average – Evaluates viral load in infectious disease testing.
- Disease Incidence (per 100,000) – Provides insights into regional outbreaks.
- Antimicrobial Resistance Trend (%) – Monitors resistance development across pathogens.
- Test Positivity Consistency (%) – Ensures standardized testing outcomes.
- Immunology Diagnostics Performance Metrics – Benchmarks overall lab efficiency, testing accuracy, and workflow effectiveness.
Frequently Asked Questions
Q1: Who should use an Immunology Lab & Diagnostics Performance Dashboard?
Lab managers, diagnostics heads, infectious disease specialists, and healthcare administrators can use it to monitor lab operations and testing performance.
Q2: How does the dashboard improve testing quality?
By monitoring metrics like repeat test rates, assay sensitivity, specimen rejection rates, and immunology diagnostics performance metrics, the dashboard identifies errors and optimizes procedures.
Q3: Is this dashboard suitable for multi-center labs?
Absolutely. It can aggregate data from multiple sites to provide a unified view of lab performance and testing quality across locations.