What is an Oncology Center Patient Care Dashboard?
An Oncology Center Patient Care Dashboard is a centralized tool designed for oncology leadership to monitor clinical and operational performance in real time, including Cancer Center Directors, Chief Medical Officers, and Oncology Department Heads. It provides visibility into patient registrations, treatment success rates, patient satisfaction, length of stay, and staff productivity. Unlike static reports, this dashboard acts as a real-time oncology performance dashboard, helping institutions track care quality, operational efficiency, and patient outcomes in one place.
How to Create an Oncology Center Patient Care Dashboard
You don’t need to build your report from scratch—just start with a ready-to-use Oncology patient care dashboard template from Mokkup. Add in your data and export it however you like. Here’s how to do it:
1. Create or Log in to Your Mokkup Account
Start by signing up on Mokkup.ai using your email. If you already have an account, just log in, and you’ll be good to go.
2. Choose and Customize Your Dashboard Template
Find the Oncology Center Patient Care Dashboard template in the Templates section. Use the drag-and-drop editor to adjust KPIs, edit filters, or add elements based on your data.
3. Export to Your BI Tool
Once your dashboard wireframe is ready, use the BI Tool Export feature to send it directly to Power BI or Tableau for further analysis and enhancements. You can also download the dashboard as a PDF, PNG, or JPEG, embed it on a platform, or invite your team to collaborate.
Note: This is a Pro template. You’ll need a Pro subscription on Mokkup to use and customize this dashboard wireframe. Upgrade anytime to unlock full access.
Oncology Center Patient Care Dashboard Example
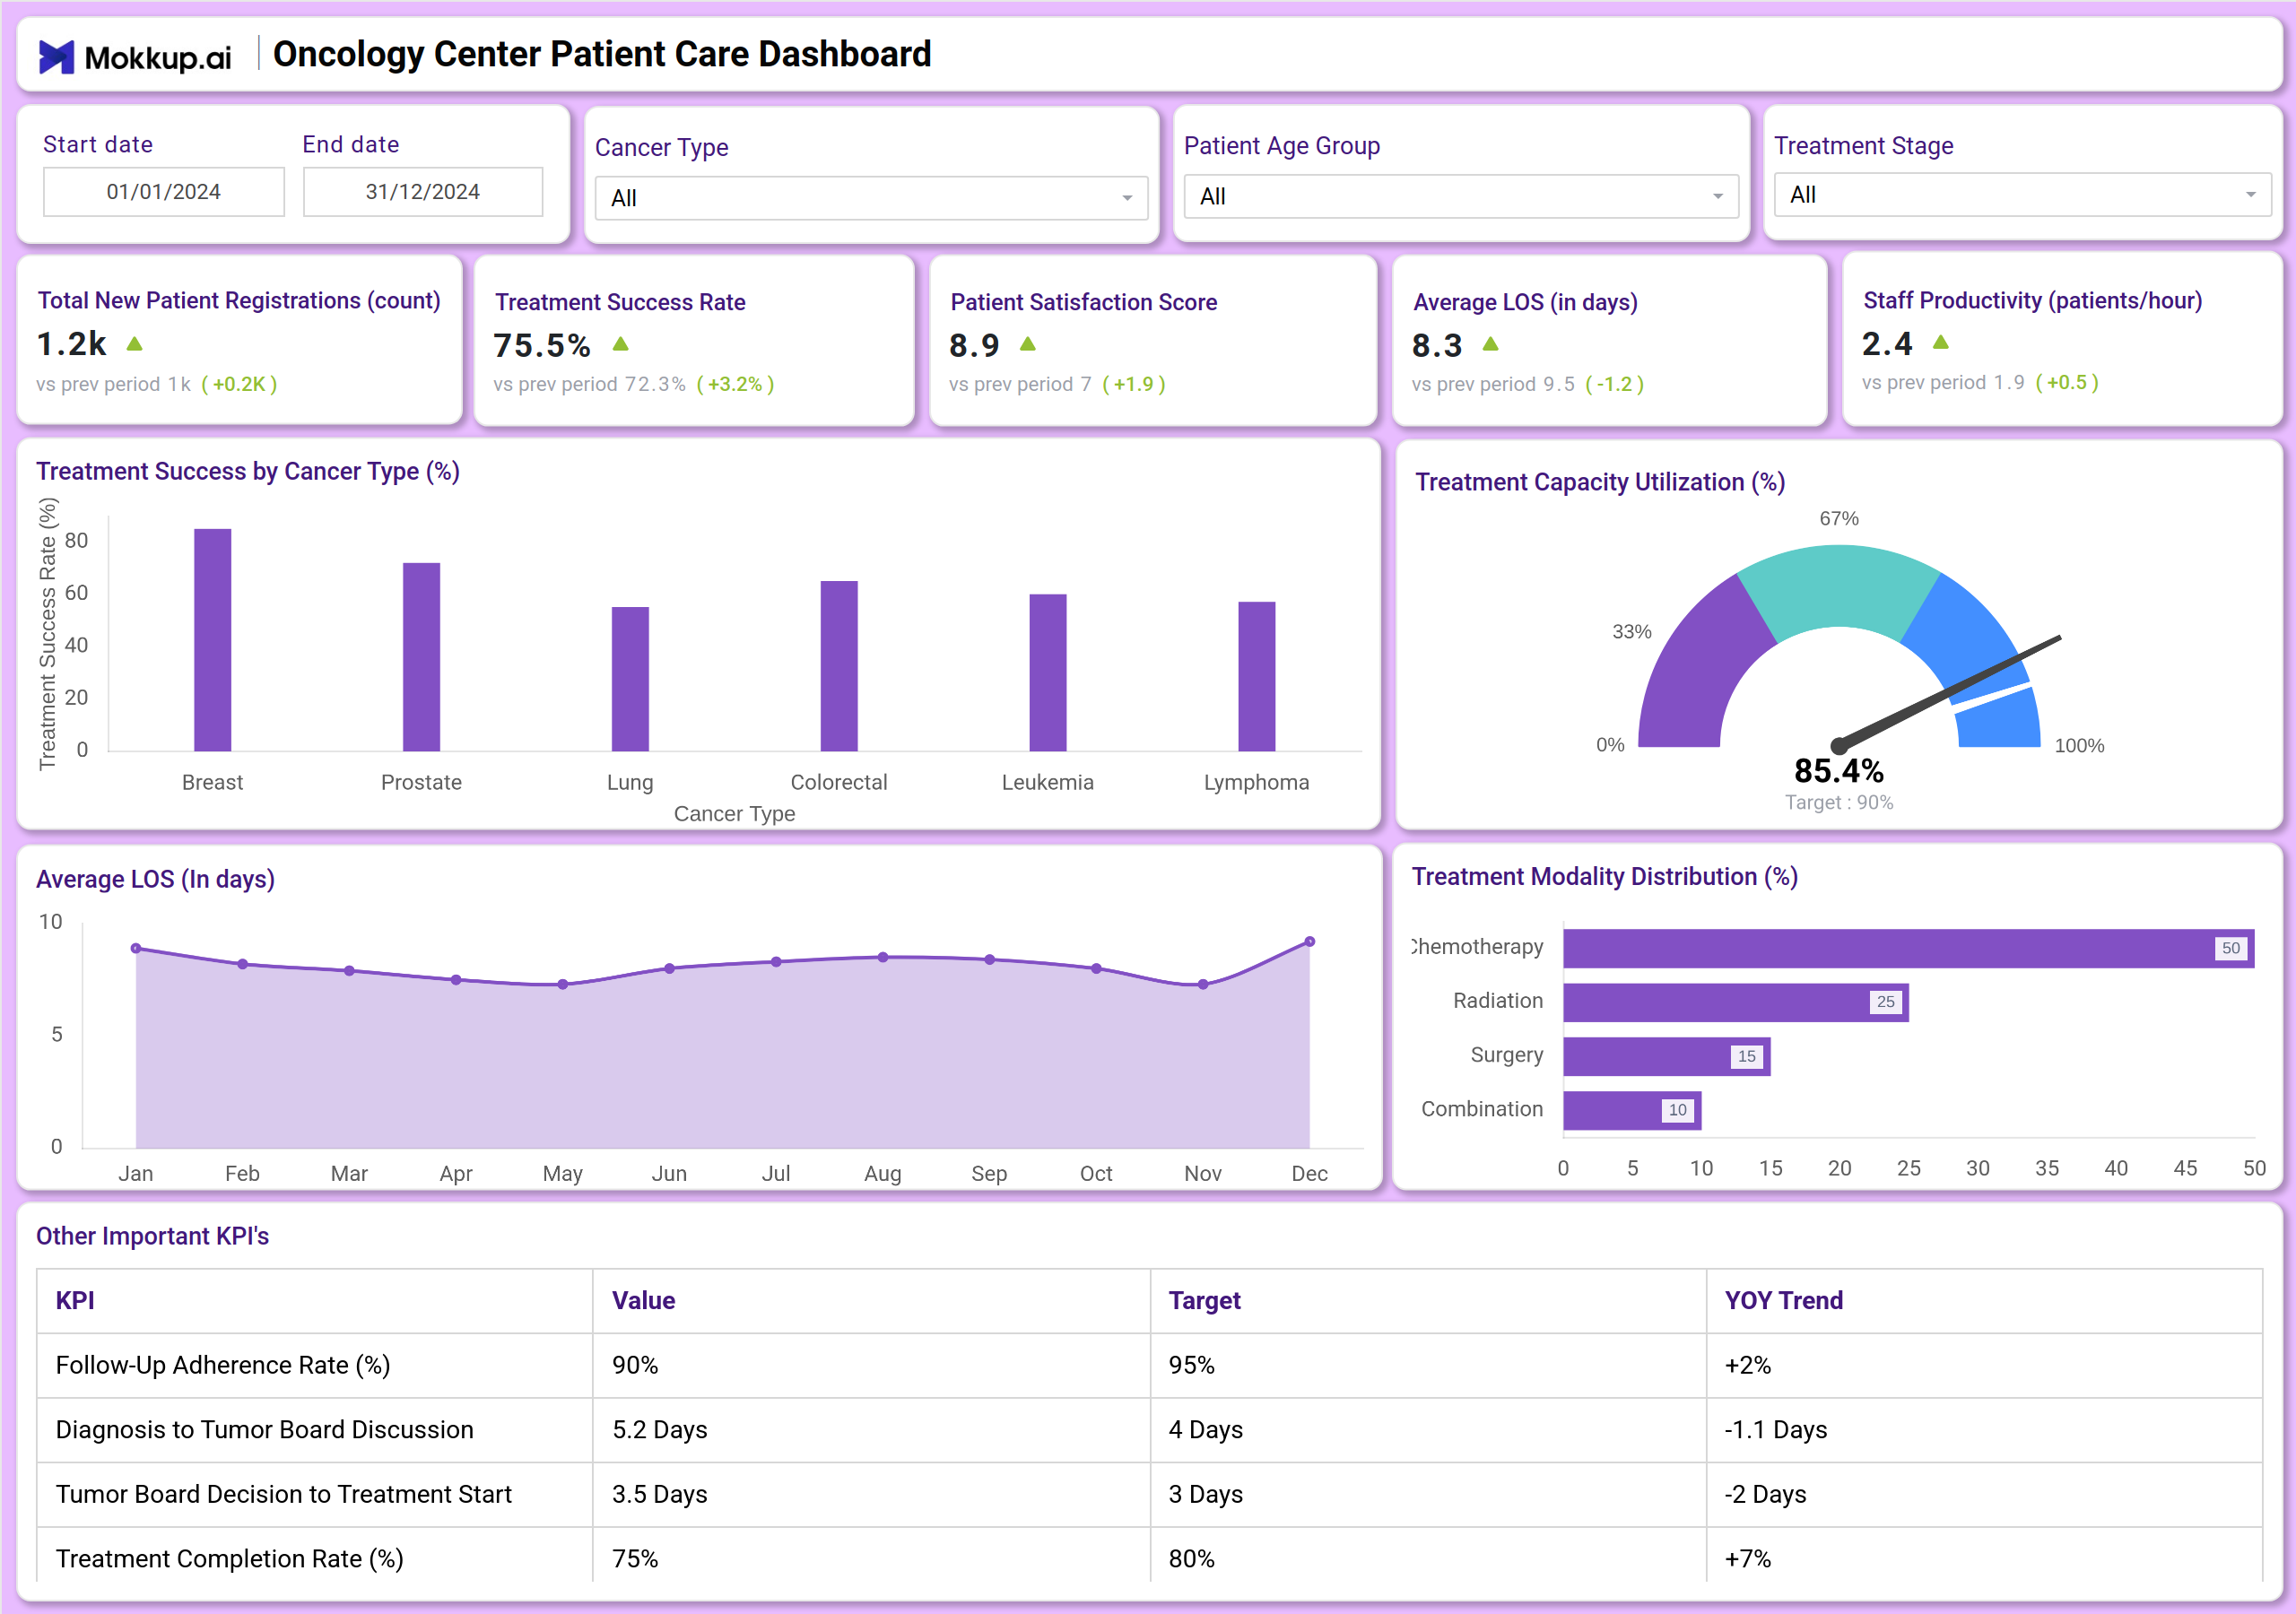
You can create an Oncology Center Patient Care Dashboard with a mix of KPI tiles and visualizations. At the top, KPI cards track key metrics such as Total New Patient Registrations, Treatment Success Rate, Patient Satisfaction Score, Average Length of Stay (LOS), and Staff Productivity. Below that, charts can show the Treatment Success Rate broken down by cancer type (e.g., Breast, Prostate, Lung), Treatment Capacity Utilization, and the monthly trend of Average LOS. A detailed table monitors other crucial KPIs like Follow-Up Adherence Rate and treatment timeline metrics. Together, this dashboard works as a dashboard for tracking oncology care metrics, ensuring leadership gets a holistic view of both patient care quality and operational flow.
How to Analyze Data in Oncology Center Patient Care Dashboards
Here’s how oncology centers can make the most of the data available on the Oncology patient care dashboard:
- Monitor Care Effectiveness: Track the Treatment Success Rate across different cancer types to identify strengths and areas for improvement.
- Evaluate Patient Experience: Correlate Patient Satisfaction Scores with operational metrics like Average LOS and Staff Productivity.
- Assess Operational Efficiency: Analyze Staff Productivity and Treatment Capacity Utilization to optimize resource allocation and reduce bottlenecks.
- Track Timeliness of Care: Monitor key timeline KPIs like "Diagnosis to Tumor Board Discussion" and "Tumor Board Decision to Treatment Start" to ensure timely patient care.
- Measure Adherence and Completion: Review the Follow-Up Adherence Rate and Treatment Completion Rate against targets to gauge long-term care plan success.
Benefits of Oncology Center Patient Care Dashboards
Here are some key benefits an Oncology center patient care dashboard offers:
- Improved Care Visibility: Real-time KPIs across treatment success, patient satisfaction, and operational efficiency.
- Enhanced Patient Outcomes: Tracks success rates and completion rates to directly monitor and improve the quality of care.
- Operational Efficiency: Monitors staff productivity, length of stay, and capacity utilization for better resource management.
- Data-Driven Treatment Plans: Analysis of success rates by cancer type supports evidence-based clinical decisions.
- Streamlined Care Pathways: Timely tracking of diagnosis-to-treatment milestones ensures efficient patient journeys.
- Compliance & Reporting: Functions as an oncology reporting and compliance dashboard for audits, accreditation, and governance reporting.
Together, these elements provide leadership with a unified view of clinical and operational performance, making aligning care delivery with patient outcomes easier. That’s why many healthcare leaders call it the best patient care dashboard for oncology centers when scaling efficiency and quality of care.
KPIs to Track in Oncology Center Patient Care Dashboards
- Total New Patient Registrations: Volume of new patients entering the care system.
- Treatment Success Rate (%): The primary indicator of clinical effectiveness.
- Patient Satisfaction Score: Measures the quality of the patient experience.
- Average LOS (in days): Tracks efficiency of inpatient care management.
- Staff Productivity (patients/hour): Measures operational efficiency of clinical staff.
- Treatment Capacity Utilization (%): Shows how effectively center resources are being used.
- Follow-Up Adherence Rate (%): Indicates long-term patient engagement and care plan compliance.
- Treatment Completion Rate (%): Tracks the percentage of patients who complete their prescribed treatment plans.
Frequently Asked Questions
1. Who should use an Oncology Center Patient Care Dashboard?
Cancer Center Directors, Oncology Department Heads, Chief Medical Officers, and clinical administrators responsible for patient care quality and operational.
2. Can this dashboard help improve patient outcomes?
Yes. By monitoring Treatment Success Rates, Patient Satisfaction, and key care timeline metrics, leadership can identify areas for improvement in treatment protocols and patient support.
3. How does it support operational efficiency?
It combines KPIs like Staff Productivity, Average LOS, and Capacity Utilization to highlight inefficiencies and optimize resource allocation.
4. Is this dashboard useful for compliance?
Yes, because an oncology workflow and outcome analytics dashboard supports governance, reporting, and compliance audits by providing a centralized record of key performance indicators.