What is an Oil Power Plant Fuel Inventory, Delivery & Storage Optimization Dashboard?
An Oil Power Plant Fuel Inventory, Delivery & Storage Optimization Dashboard template is a centralized monitoring system that provides visibility into fuel stock levels, daily burn rates, delivery timelines, and storage utilization across an oil-fired power plant. It consolidates data from multiple storage facilities, supplier delivery logs, tank sensors, and procurement records to ensure efficient and uninterrupted fuel availability.
The dashboard wireframe supports operational planning by tracking consumption trends, fuel grade distribution, and supply chain performance. Utilities use it to minimize fuel losses, prevent stockouts, control storage costs, and optimize procurement decisions. With clear metrics, automated updates, and historical comparisons, it acts as a digital control center for fuel supply operations across oil-based power generation facilities.
How to Create an Oil Power Plant Fuel Inventory, Delivery & Storage Optimization Dashboard
You don’t need to build your report from scratch; just start with a ready-to-use Oil Power Plant Fuel Inventory, Delivery & Storage Optimization dashboard template from Mokkup. Add in your data and export it however you like. Here’s how to do it:
1. Create or Log in to Your Mokkup Account
Start by signing up on Mokkup.ai using your email. If you already have an account, just log in, and you’ll be good to go.
2. Choose and Customize Your Dashboard Template
Find the Oil Power Plant Fuel Inventory, Delivery & Storage Optimization Dashboard template in the Templates section. Use the drag and drop editor to adjust KPIs, edit filters, or add elements based on your data.
3. Export to Your BI Tool
Once your dashboard wireframe is ready, use the BI Tool Export feature to send it directly to Power BI or Tableau for further analysis and enhancements. You can also download the dashboard as a PDF, PNG, or JPEG, embed it on a platform, or invite your team to collaborate.
Note: This is a Pro template. You’ll need a Pro subscription on Mokkup to use and customize this dashboard wireframe. Upgrade anytime to unlock full access.
Oil Power Plant Fuel Inventory, Delivery & Storage Optimization Dashboard Example
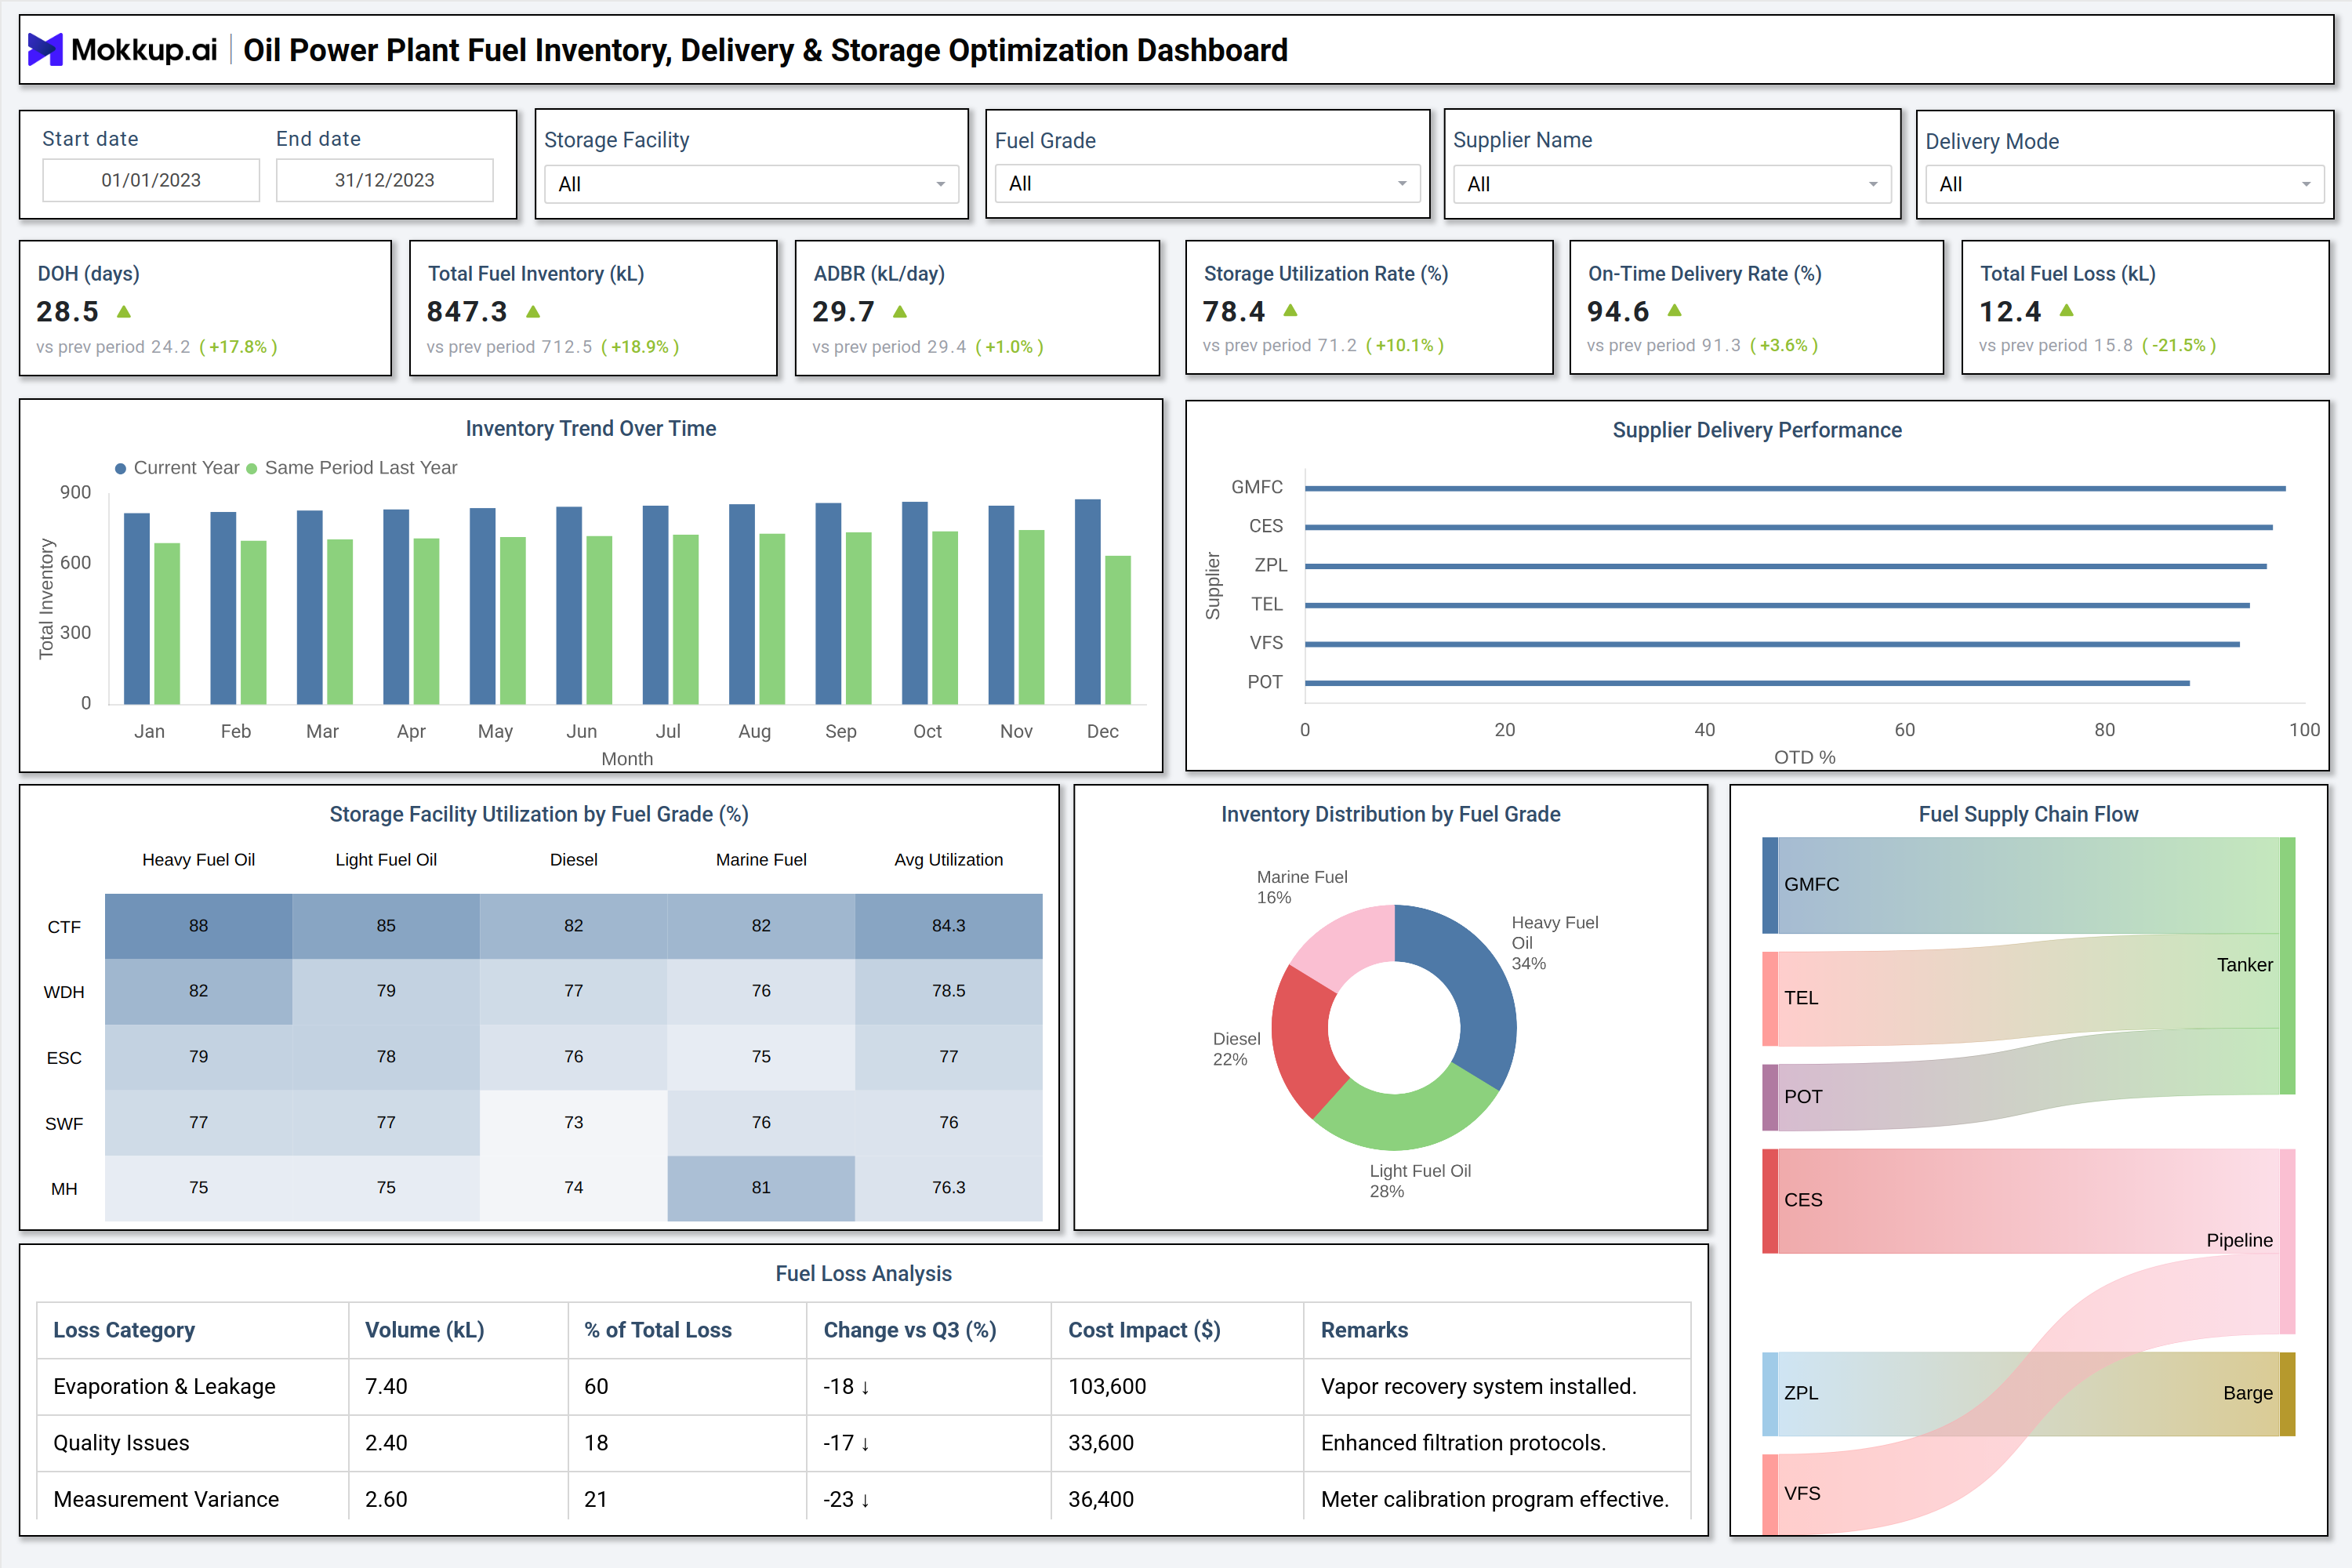
The displayed example dashboard provides a comprehensive view of fuel inventory operations throughout the calendar year. It includes key metrics such as Days of Oil Held (DOH), total inventory, average daily burn rate (ADBR), storage utilization, on-time delivery rate, and total fuel loss. The visualization highlights inventory trends on a month-by-month basis, comparing current-year data to last year's performance. A supplier delivery performance chart helps evaluate reliability across partners. The storage utilization matrix illustrates the utilization of various fuel grades, including Heavy Fuel Oil, Light Fuel Oil, Diesel, and Marine Fuel, across each facility. A fuel distribution pie chart breaks down the proportion of each fuel type in stock.
The fuel loss analysis table provides insights into evaporation, quality issues, and measurement variances, along with cost impact and operational remarks. Finally, the fuel supply chain flow diagram tracks the movement of fuel from suppliers to the power plant via tanker, pipeline, or barge. This format ensures complete transparency across procurement, delivery, storage, and consumption processes.
How to Analyze Data in an Oil Power Plant Fuel Inventory, Delivery & Storage Optimization Dashboard
Here is how you can analyze data from this dashboard:
- Days of Oil Coverage: Track days of oil held to understand supply stability and verify whether inventory adequately covers operational demand.
- Total Fuel Inventory Trends: Monitor total fuel inventory (kL) and compare it with historical trends to identify seasonal patterns or operational variations.
- Daily Fuel Burn Rate: Review the average daily burn rate to ensure fuel consumption aligns with generation schedules and load planning.
- Storage Utilization Efficiency: Assess storage utilization rates to avoid overfilled tanks, safety risks, or underutilized storage capacity.
- Supplier Delivery Performance: Compare on-time delivery rates across suppliers to identify logistics gaps and areas of reliability concern.
- Fuel Grade Utilization: Examine fuel grade utilization to optimize blending strategies, grade switching, or procurement decisions.
- Fuel Loss Analysis: Analyze fuel loss categories, such as evaporation, quality degradation, or measurement errors, to pinpoint the root causes.
- Loss Cost Impact: Evaluate the cost impact of fuel losses to prioritize corrective and preventive actions.
- Supply Chain Flow Validation: Utilize supply chain flow visuals to verify that delivery modes, such as pipeline, barge, or tanker, align with procurement plans.
- Inventory Distribution Alignment: Study inventory distribution to ensure fuel grades align with operational needs for both baseload and peak generation.
Benefits of an Oil Power Plant Fuel Inventory, Delivery & Storage Optimization Dashboard
The following are the benefits of using this dashboard:
- End-to-End Fuel Visibility: Improves transparency across the entire fuel inventory, delivery, and storage lifecycle.
- Reduced Supply Risk: Minimizes operational risks related to fuel stockouts, delivery delays, or mismatched fuel grades.
- Smarter Procurement Planning: Supports informed procurement decisions using historical consumption and inventory trends.
- Supplier Performance Management: Enhances supplier accountability through delivery performance tracking.
- Lower Fuel Losses: Reduces storage and handling losses with early detection of anomalies and inefficiencies.
- Optimized Tank Utilization: Balances tank capacity usage across different fuel grades for safer and more efficient operations.
- Regulatory Readiness: Ensures compliance through accurate and transparent fuel inventory and loss reporting.
- Cost Optimization: Lowers operating costs by identifying inefficiencies in logistics, storage, and fuel handling processes.
KPIs to Track in an Oil Power Plant Fuel Inventory, Delivery & Storage Optimization Dashboard
The following key KPIs can be tracked by using this dashboard:
- Days of Oil Held (DOH): Measures the number of days current inventory can support operations.
- Total Fuel Inventory (kL): Indicates available stock across all fuel grades.
- Average Daily Burn Rate (ADBR): Tracks consumption relative to power generation.
- Storage Utilization Rate (%): Indicates the efficiency with which tank capacity is utilized.
- On Time Delivery Rate (%): Measures supplier reliability in meeting delivery schedules.
- Total Fuel Loss (kL): Quantifies fuel lost due to evaporation, handling, or measurement variance.
Frequently Asked Questions
Q1. Why do oil-fired power plants need a fuel inventory optimization dashboard?
To maintain uninterrupted generation, control fuel costs, track storage efficiency, and reduce operational risks.
Q2. Can the dashboard monitor different fuel grades separately?
Yes, it supports Heavy Fuel Oil, Light Fuel Oil, Diesel, and Marine Fuel with grade-level visibility.
Q3. Does it track supplier performance?
Yes, it monitors on-time delivery rates and highlights supplier-level reliability trends.