What is a Oil Power Plant Boiler Efficiency & Combustion Optimization Dashboard?
A boiler efficiency monitoring dashboard is a centralized digital system used to monitor boiler performance, fuel consumption, combustion quality, and emissions across utility and industrial plants. It consolidates operational data such as boiler efficiency, heat rate, fuel usage, air-fuel ratio, and emission levels into a single, structured view. By providing real-time visibility into combustion behavior and thermal performance, the dashboard supports operations teams, energy managers, and plant engineers in identifying inefficiencies and optimizing firing conditions. As a boiler efficiency and combustion dashboard, it helps utilities improve fuel utilization, reduce heat losses, and maintain stable boiler operation under varying load conditions. When integrated with burner-level analytics and emissions monitoring, the system functions as a combustion optimization dashboard for utilities and a complete industrial boiler performance monitoring system, enabling data-driven operational control and continuous efficiency improvement.
How to Create an Oil Power Plant Boiler Efficiency & Combustion Optimization Dashboard
You don’t need to build your report from scratch, just start with a ready-to-use dashboard template from Mokkup. Add in your data and export it however you like. Here’s how to do it:
1. Create or Log in to Your Mokkup Account
Start by signing up on Mokkup.ai using your email. If you already have an account, just log in, and you’ll be good to go.
2. Choose and Customize Your Dashboard Template
Find the Oil Power Plant Boiler Efficiency & Combustion Optimization Dashboard template in the Templates section. Use the drag-and-drop editor to adjust KPIs, edit filters, or add elements based on your data.
3. Export to Your BI Tool
Once your dashboard wireframe is ready, use the BI Tool Export feature to send it directly to Power BI or Tableau for further analysis and enhancements. You can also download the dashboard as a PDF, PNG, or JPEG, embed it on a platform, or invite your team to collaborate.
Note: This is a Pro template. You’ll need a Pro subscription on Mokkup to use and customize this dashboard wireframe. Upgrade anytime to unlock full access.
Oil Power Plant Boiler Efficiency & Combustion Optimization Dashboard Example
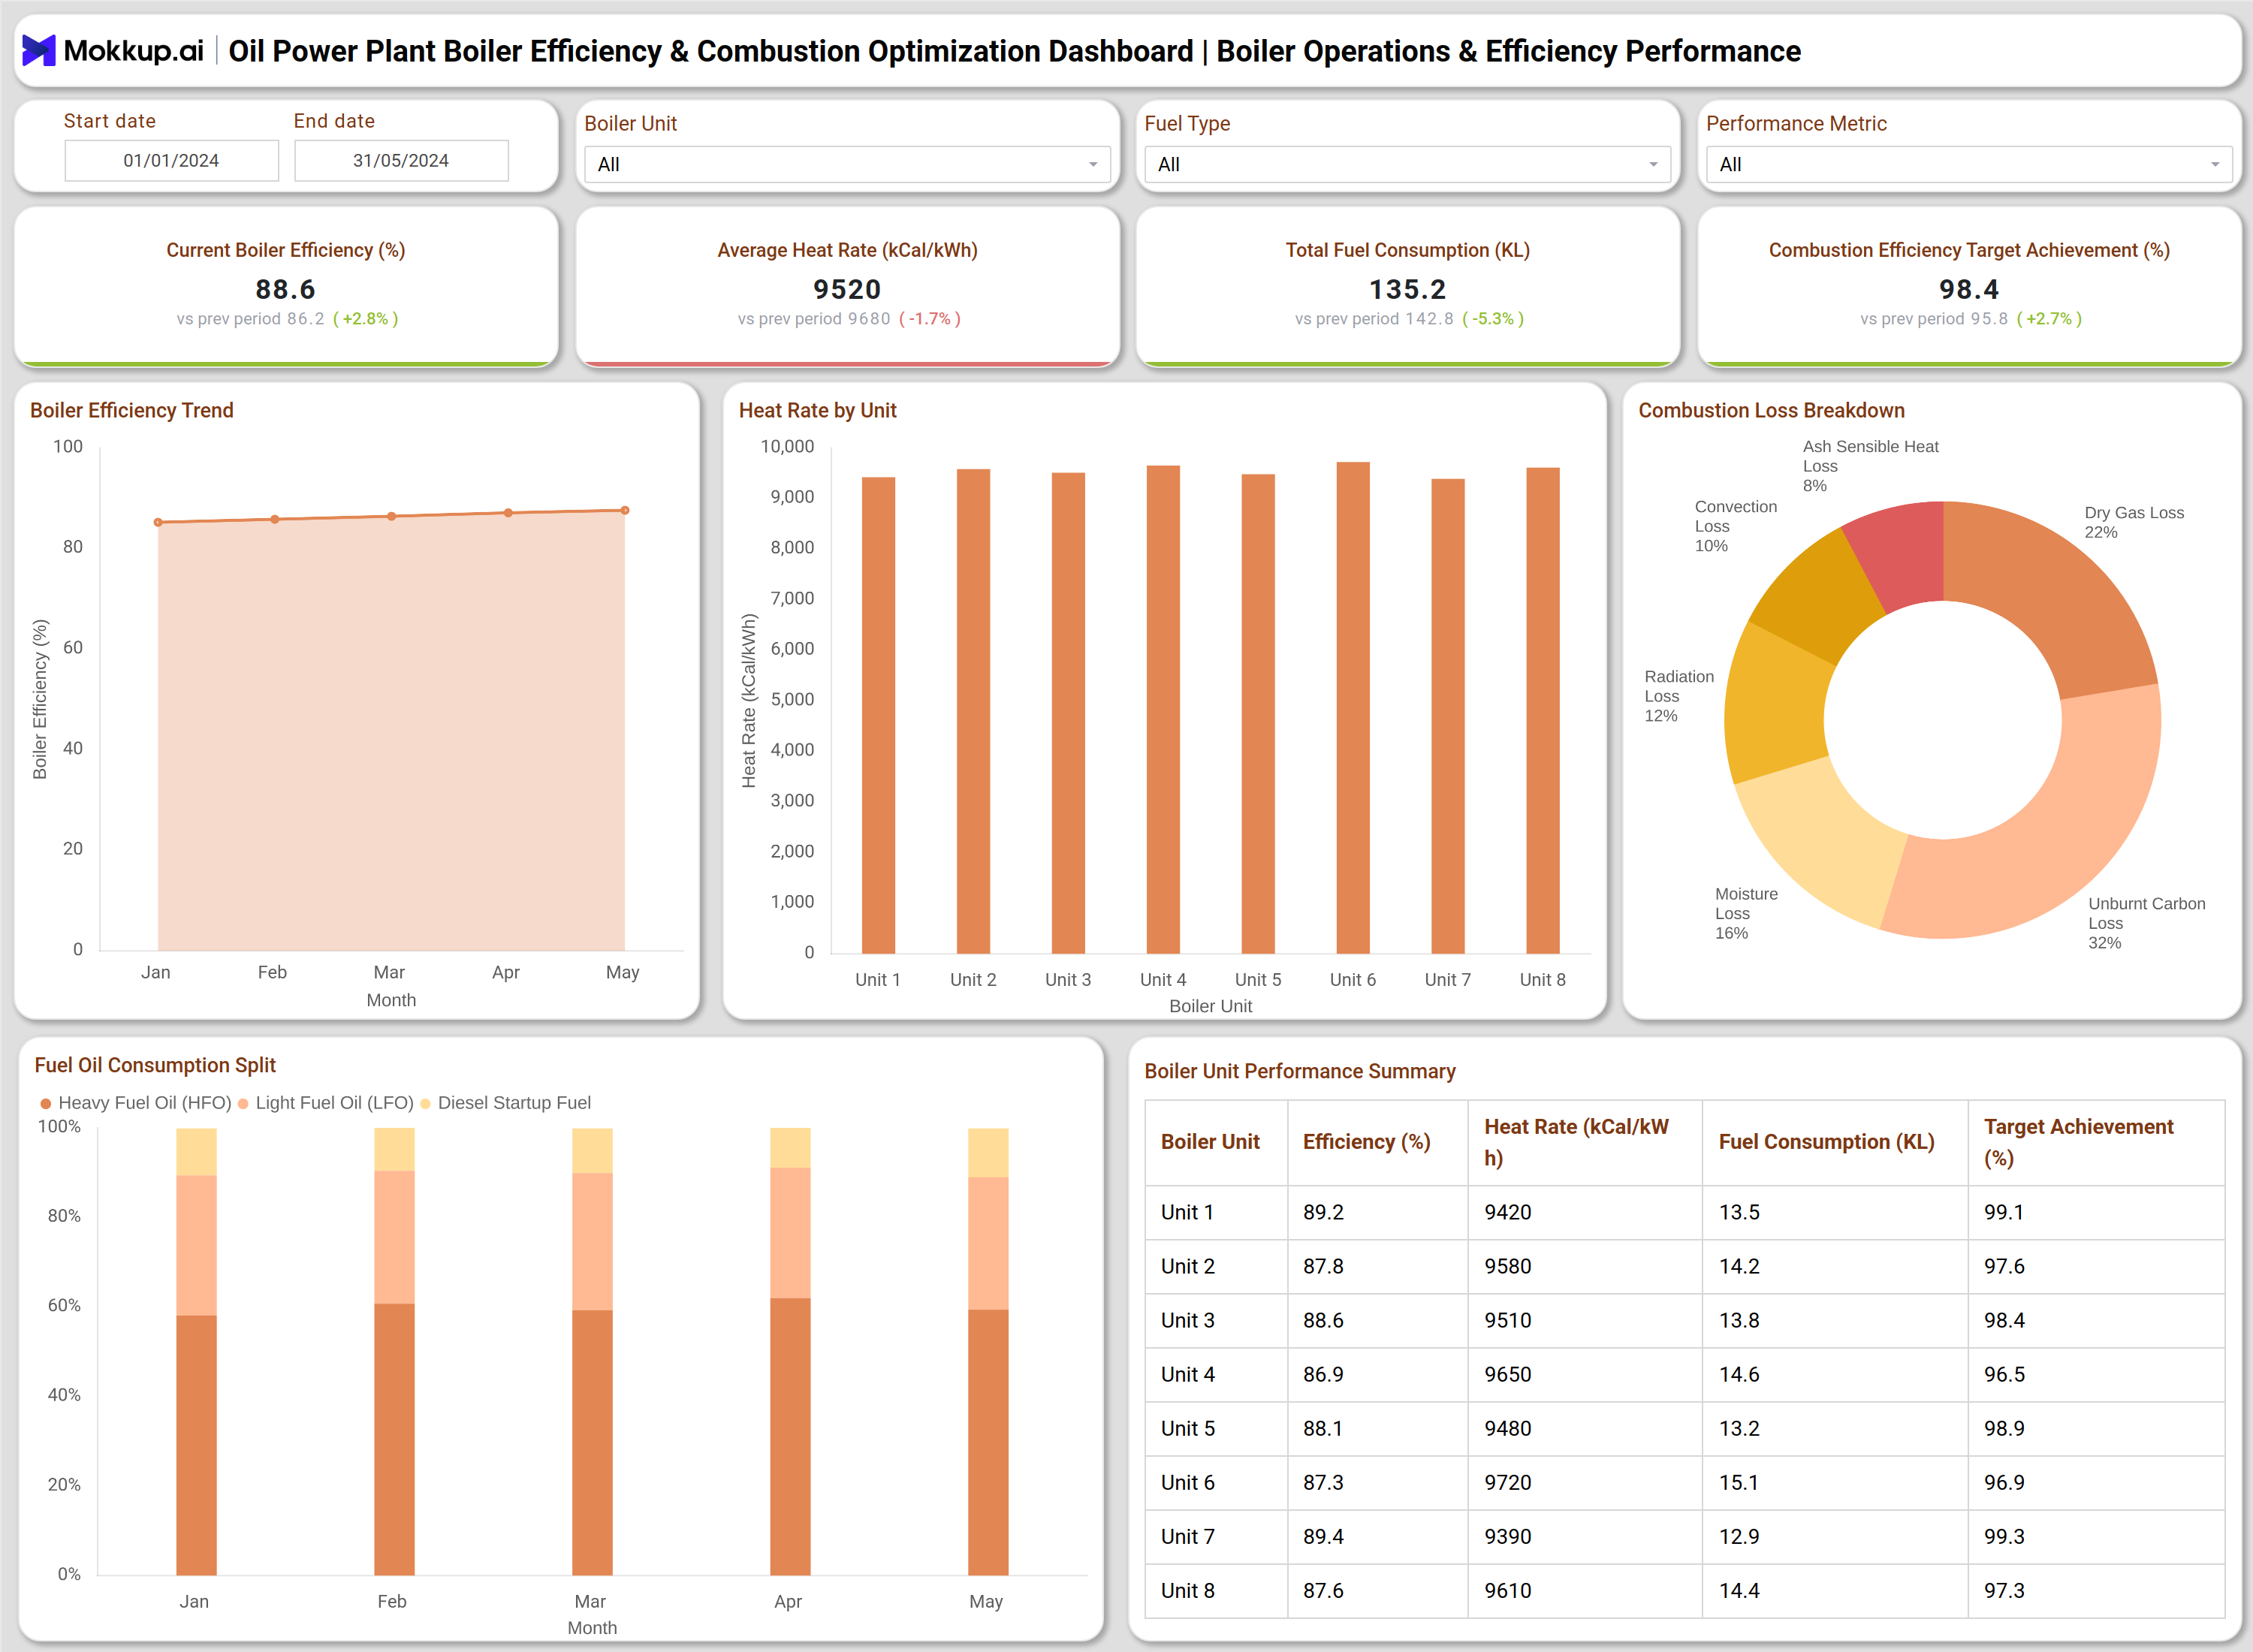
You can create an Oil Power Plant Boiler Efficiency & Combustion Optimization Dashboard using two primary analytical sections: Boiler Operations & Efficiency Performance and Boiler Combustion & Emissions Control. The Boiler Operations & Efficiency Performance section provides a high-level view of boiler thermal efficiency and fuel usage. It displays key metrics such as current boiler efficiency, average heat rate, total fuel consumption, and combustion efficiency target achievement. Boiler efficiency trend charts show performance changes over time, while heat rate by unit charts highlight efficiency differences across boiler units. Combustion loss breakdown visuals identify major loss contributors such as unburnt carbon loss, dry flue gas loss, moisture loss, radiation loss, convection loss, and ash sensible heat loss. Fuel consumption split charts show the proportional use of different fuel types, helping operators assess fuel mix efficiency. A boiler unit performance summary table consolidates efficiency, heat rate, fuel consumption, and target achievement for each boiler.
The Boiler Combustion & Emissions Control section focuses on combustion quality and environmental performance. It tracks air-fuel ratio, flue gas oxygen, carbon monoxide, nitrogen oxides, sulfur dioxide, and burner tip efficiency. Trend charts correlate oxygen levels and carbon monoxide formation to assess combustion completeness. Air-fuel ratio by load condition analysis helps operators maintain optimal firing conditions across varying loads. Emissions contribution visuals identify dominant pollutants, while temperature imbalance and soot blowing effectiveness analysis support heat transfer optimization. Burner-level performance tables provide detailed insights into oil pressure, atomization quality, flame stability, and burner operating status.
How to Analyze Data in Oil Power Plant Boiler Efficiency & Combustion Optimization Dashboard
Here is how you can analyze data from this dashboard:
- Review current boiler efficiency and compare it with historical trends to assess performance stability.
- Analyze average heat rate to identify fuel-to-energy conversion inefficiencies.
- Compare heat rate across boiler units to detect underperforming equipment.
- Examine combustion loss distribution to understand dominant sources of thermal loss.
- Track fuel consumption trends to identify optimization opportunities.
- Monitor air-fuel ratio and flue gas oxygen to ensure complete combustion.
- Analyze carbon monoxide levels to detect incomplete combustion conditions.
- Review emission levels to maintain compliance with regulatory limits.
- Evaluate burner-level metrics to identify atomization or flame stability issues.
Benefits of Oil Power Plant Boiler Efficiency & Combustion Optimization Dashboard
The following are the benefits of using this dashboard:
- Improves boiler thermal efficiency through continuous performance monitoring.
- Reduces fuel consumption and operating costs.
- Maintains stable combustion across varying load conditions.
- Supports emission control and regulatory compliance.
- Identifies boiler and burner-level inefficiencies early.
- Improves heat rate performance across boiler units.
- Enables data-driven operational decision-making.
- Provides a unified view of efficiency, combustion, and emissions performance.
KPIs to Track in an Oil Power Plant Boiler Efficiency & Combustion Optimization Dashboard
The following key KPIs can be tracked by using this dashboard:
- Boiler Efficiency (%): Measures how effectively the boiler converts fuel energy into usable heat.
- Average Heat Rate (kCal/kWh): Indicates the amount of fuel energy required to produce one unit of electricity.
- Total Fuel Consumption (KL): Tracks the total volume of fuel consumed by the boiler during the selected period.
- Combustion Efficiency Target Achievement (%): Shows how closely actual combustion efficiency meets the defined performance target.
- Combustion Loss Distribution (%): Breaks down energy losses from combustion across different loss categories.
- Air-Fuel Ratio: Measures the proportion of air supplied relative to fuel for efficient combustion.
- Flue Gas Oxygen (%): Indicates excess oxygen in flue gases, reflecting combustion completeness.
- Carbon Monoxide (ppm): Measures incomplete combustion by tracking carbon monoxide concentration in flue gas.
- Nitrogen Oxides (mg/Nm³): Tracks NOx emissions generated during combustion to ensure regulatory compliance.
- Sulfur Dioxide (mg/Nm³): Monitors SO₂ emissions resulting from sulfur content in fuel.
- Burner Tip Efficiency (%): Evaluates how effectively the burner transfers fuel energy into stable flame combustion.
- Flame Stability (%): Indicates consistency and reliability of the flame during boiler operation.
Frequently Asked Questions
1. Why is a boiler efficiency monitoring dashboard important?
It provides real-time insights into boiler performance and combustion quality, helping utilities improve efficiency and reduce fuel costs.
2. Who uses a combustion optimization dashboard for utilities?
Plant operators, control room engineers, energy managers, and maintenance teams.
3. How does the dashboard help reduce fuel consumption?
By identifying heat losses, inefficient air-fuel ratios, and high heat rate boiler units.
4. Can this dashboard support emissions compliance?
Yes. It tracks key emission parameters and helps maintain combustion within regulatory limits.
5. Is this dashboard suitable for multi-boiler plants?
Yes. It allows unit-level performance comparison across multiple boilers.