
What is a Natural Gas Plant Fuel Management Dashboard?
A Natural Gas Plant Fuel Management Dashboard template is a centralized analytics platform used by electric power utilities to track, monitor, and optimize fuel performance in gas-fired power generation. It provides visibility into fuel procurement, consumption, inventory, and supplier performance metrics across multiple facilities.
The dashboard wireframe enables plant operators and energy managers to evaluate fuel efficiency and identify cost-saving opportunities through clear visual insights. It helps track daily fuel burn rates, supplier delivery consistency, and overall supply chain performance. For energy utilities, the dashboard supports better fuel planning, cost control, and operational decision-making, key factors that directly impact generation economics and plant reliability.
By consolidating all key fuel performance indicators, this fuel performance monitoring for gas power plants tool enhances operational transparency and supports data-driven management of natural gas supply logistics and consumption efficiency.
How to Create a Natural Gas Plant Fuel Management Dashboard
You don’t need to build your report from scratch—just start with a ready-to-use Natural Gas Plant Fuel Management dashboard template from Mokkup. Add in your data and export it however you like. Here’s how to do it:
1. Create or Log in to Your Mokkup Account
Start by signing up on Mokkup.ai using your email. If you already have an account, just log in, and you’ll be good to go.
2. Choose and Customize Your Dashboard Template
Find the Natural Gas Plant Fuel Management Dashboard template in the Templates section. Use the drag-and-drop editor to adjust KPIs, edit filters, or add elements based on your data.
3. Export to Your BI Tool
Once your dashboard wireframe is ready, use the BI Tool Export feature to send it directly to Power BI or Tableau for further analysis and enhancements. You can also download the dashboard as a PDF, PNG, or JPEG, embed it on a platform, or invite your team to collaborate.
Note: This is a Pro template. You’ll need a Pro subscription on Mokkup to use and customize this dashboard wireframe. Upgrade anytime to unlock full access.
Natural Gas Plant Fuel Management Dashboard Example
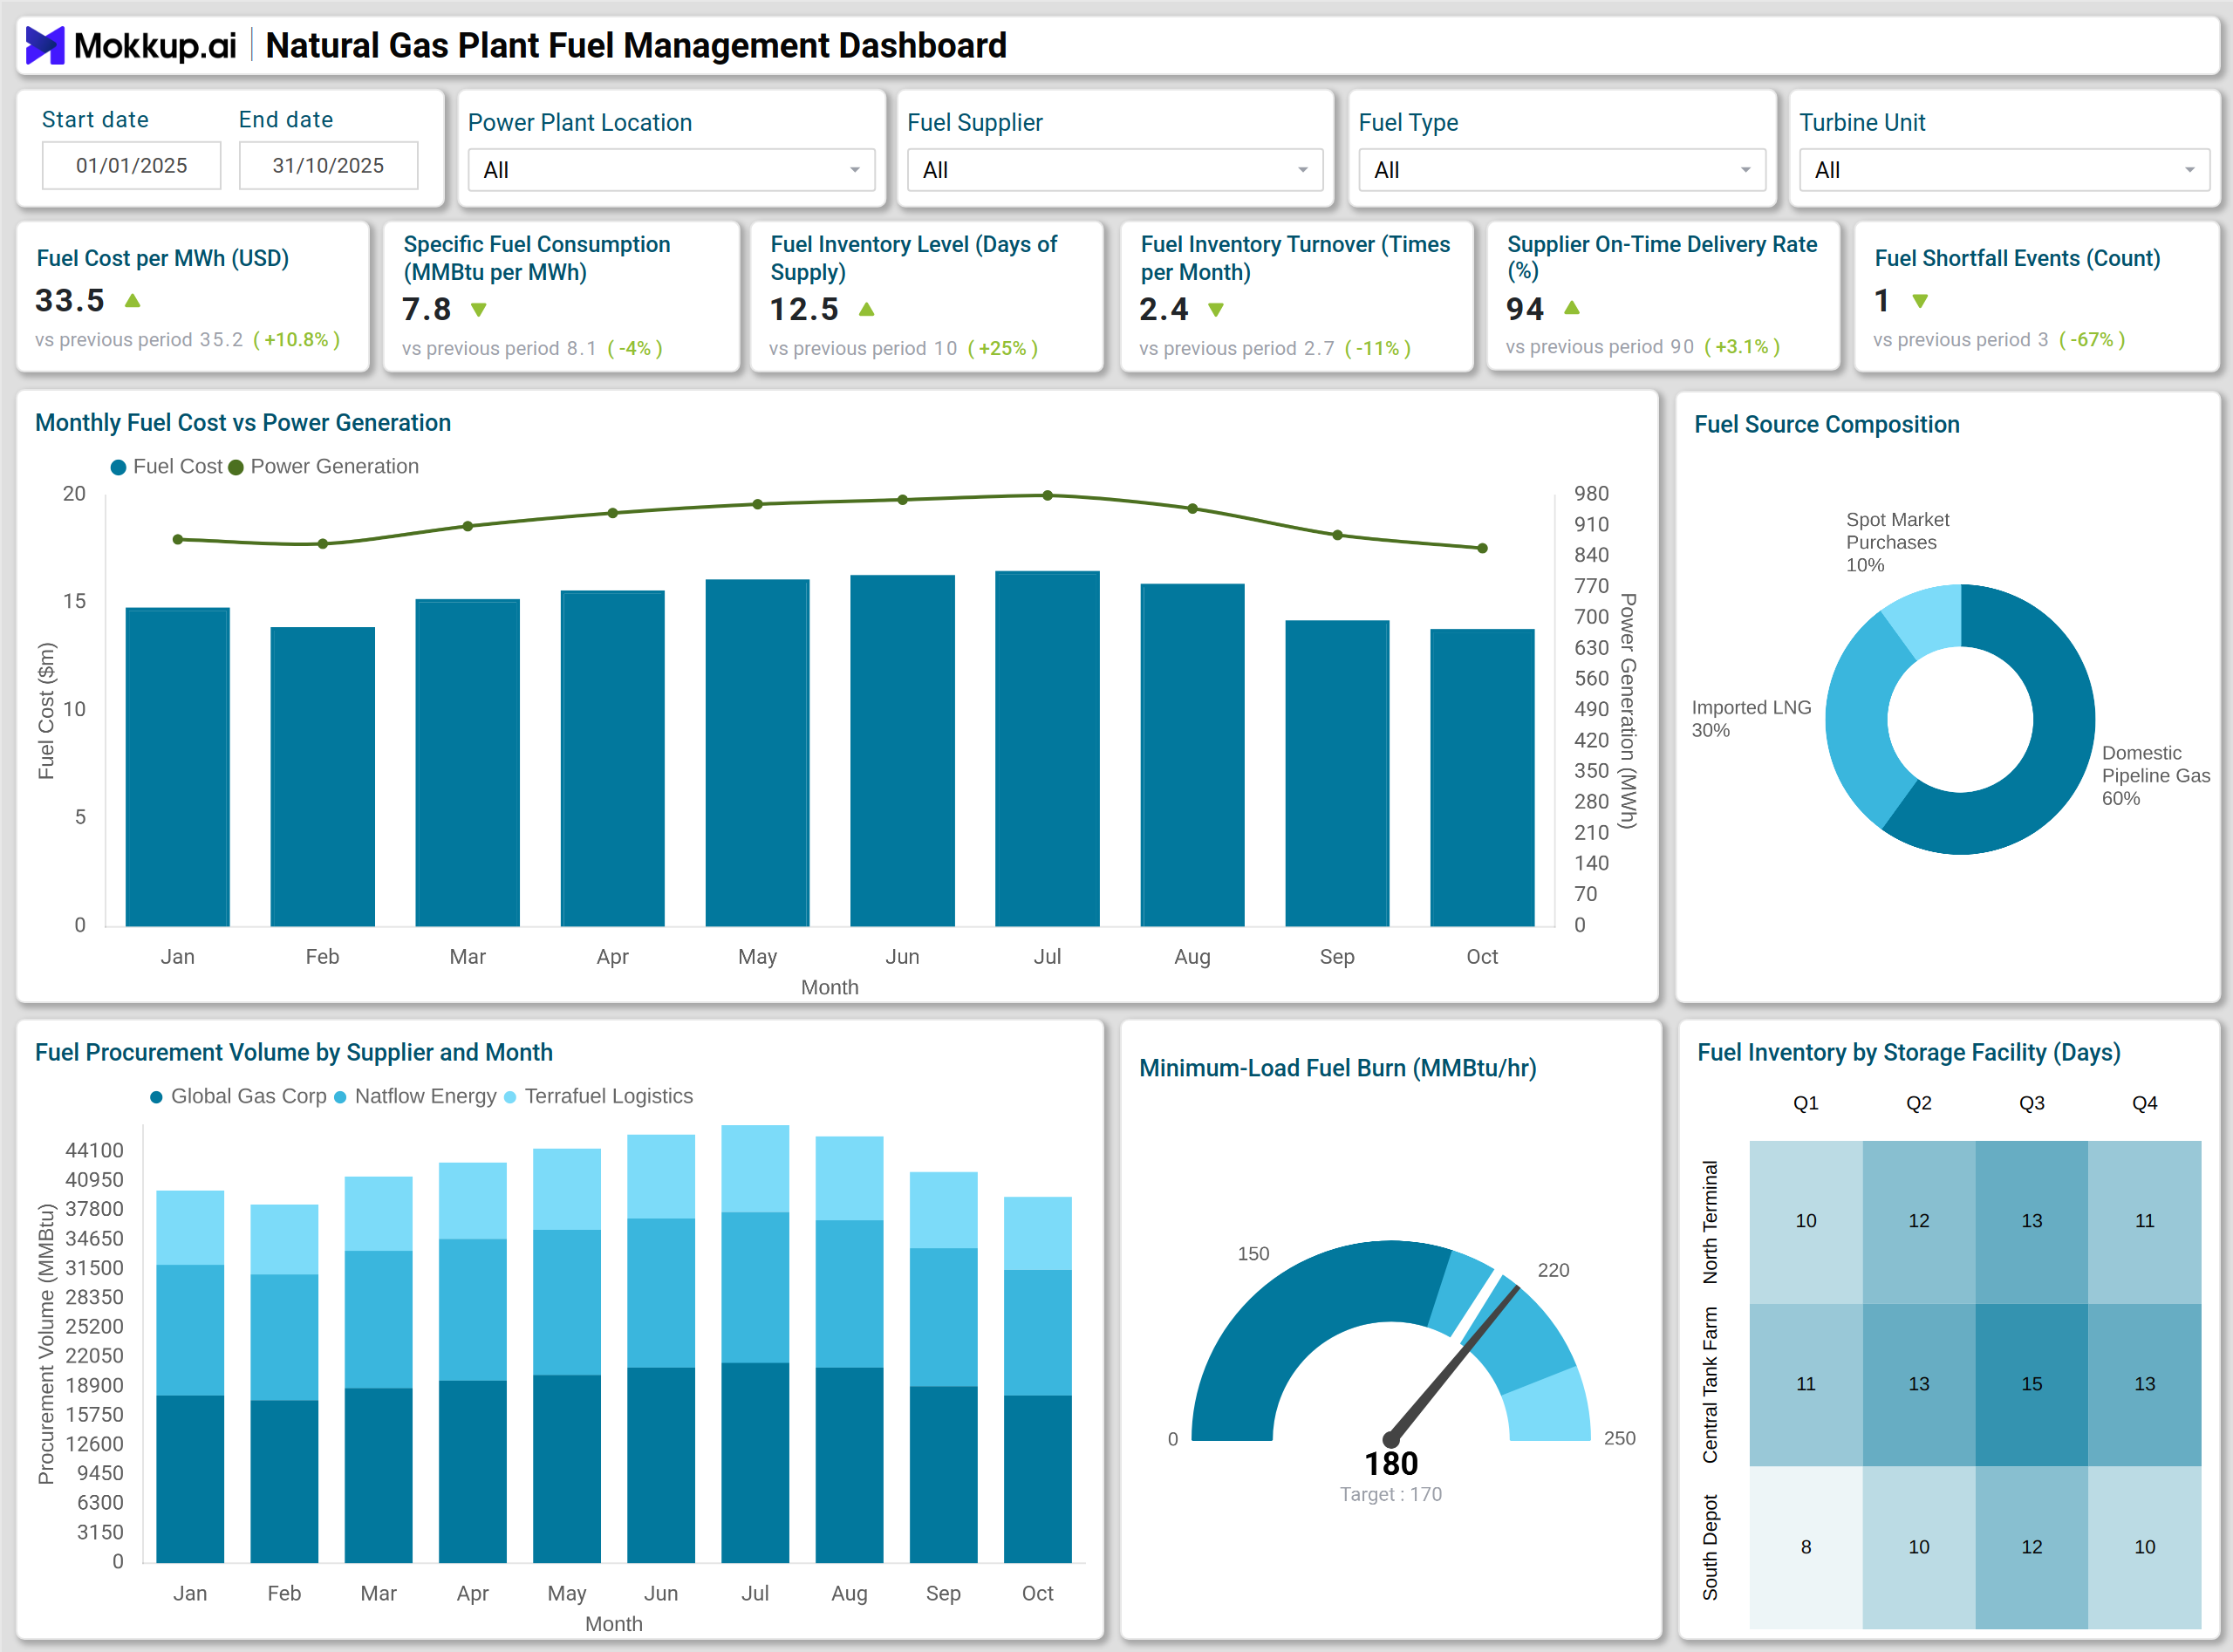
A practical energy utilities fuel efficiency dashboard example would include both financial and operational metrics to evaluate fuel-related performance across gas-fired units. For instance, a Combo Chart can display monthly fuel cost versus power generation, revealing how changes in generation levels impact total fuel expenses. A Stacked Column Chart may illustrate Fuel Procurement Volume by Supplier, helping assess supplier reliability and diversification.
The Heatmap of Fuel Inventory Level by Storage Facility (Quarterly Overview) provides a quick view of supply adequacy across terminals, ensuring each site maintains sufficient fuel for operational continuity. A Donut Chart showcasing Fuel Source Composition helps management monitor sourcing strategies, whether pipeline gas, LNG, or storage drawdowns. Lastly, a Gauge Chart displaying Minimum-Load Fuel Burn assists in tracking energy efficiency at lower generation thresholds.
Together, these visuals enhance the natural gas power plant's operational analytics process, making it more precise and enabling better cost control and improved supply planning.
How to Analyze Data in Natural Gas Plant Fuel Management Dashboards
Begin by examining how fuel cost, consumption, and inventory patterns influence operational efficiency and overall generation performance:
- Compare Fuel Cost vs Generation Output: Evaluate cost efficiency trends by tracking monthly fuel expenses alongside total power generation. This helps in understanding how effectively fuel is being utilized per MWh.
- Monitor Fuel Inventory Trends: Analyze stock levels across storage facilities to ensure a stable supply and prevent shortfall events.
- Assess Supplier Performance: Use delivery rate and procurement volume metrics to track on-time delivery and reliability.
- Identify Consumption Inefficiencies: Detect abnormal fuel usage patterns or elevated specific fuel consumption to optimize turbine operations.
- Correlate Operational Metrics: Relate fuel cost, burn rate, and output to overall plant performance using integrated visual analytics.
- Review Seasonal Variations: Study quarterly or monthly shifts in consumption and cost to refine procurement strategies.
By focusing on these factors, operators can optimize fuel costs in gas-fired generation and maintain consistent plant performance.
Benefits of Natural Gas Plant Fuel Management Dashboards
These dashboards streamline fuel oversight, helping plants improve cost efficiency, operational stability, and supplier performance:
- Improved Fuel Cost Control: Tracks spending patterns, enabling precise budgeting and procurement planning.
- Higher Fuel Efficiency: Identifies trends in turbine performance and supports operational improvements.
- Better Supplier Management: Monitors supplier reliability and delivery timeliness to minimize supply risks.
- Enhanced Inventory Planning: Provides early visibility into stock levels and consumption rates for smoother logistics.
- Operational Transparency: Offers unified visibility into cost, consumption, and supply metrics across facilities.
- Data-Driven Decision Making: Empowers managers with actionable insights for cost reduction and process optimization.
KPIs to Track in Natural Gas Plant Fuel Management Dashboards
Monitor these essential KPIs to maintain control over cost, inventory, and overall fuel performance:
- Fuel Cost per MWh: Evaluates cost efficiency and helps benchmark against generation output.
- Specific Fuel Consumption: Measures the amount of fuel needed per unit of energy generated.
- Fuel Inventory Level (Days of Supply): Indicates the number of operational days supported by existing stock.
- Fuel Inventory Turnover: Reflects how efficiently inventory is consumed and replenished.
- Supplier On-Time Delivery Rate: Measures supplier reliability and performance consistency.
- Fuel Shortfall Events: Tracks instances of insufficient supply to prevent operational disruptions.
Monitoring these KPIs through a gas turbine fuel usage tracking system ensures plants operate with optimal fuel efficiency and minimal risk.
Frequently Asked Questions
Q1. What is the purpose of a Natural Gas Plant Fuel Management Dashboard?
It helps track, monitor, and analyze all aspects of fuel management, including cost, consumption, inventory, and supplier performance for gas-fired power generation.
Q2. How does it help in fuel cost optimization?
By correlating fuel cost data with generation output, managers can identify inefficiencies, plan procurement more effectively, and reduce overall expenses.
Q3. Can it be used across multiple power plants?
Yes, utilities can deploy the dashboard across different natural gas facilities to maintain centralized oversight and performance comparison.
Q4. What type of users benefit from this dashboard?
Plant operators, fuel procurement managers, and energy analysts use it to enhance operational and financial performance.
Q5. What insights can visuals like heatmaps and gauge charts provide?
They highlight trends in fuel availability, supplier reliability, and efficiency levels, making it easier to take corrective action before issues arise.