What is a Bioenergy Power Plant Boiler Efficiency Dashboard?
A Bioenergy Power Plant Boiler Efficiency Dashboard is a centralized analytics tool designed to monitor, analyze, and optimize boiler performance in biomass-based power generation facilities. This dashboard consolidates real-time and historical data related to combustion efficiency, fuel quality, heat losses, and equipment availability into a single operational view. By combining boiler performance metrics with fuel utilization data, the bioenergy boiler efficiency dashboard enables plant operators to understand how fuel characteristics, operating conditions, and equipment health directly impact thermal energy efficiency and output. It plays a critical role in improving bioenergy power plant boiler efficiency while supporting data-driven decisions for continuous performance improvement.
How to Create a Bioenergy Power Plant Boiler Efficiency Dashboard
You don’t need to build your report from scratch, just start with a ready-to-use dashboard template from Mokkup. Add in your data and export it however you like. Here’s how to do it:
1. Create or Log in to Your Mokkup Account
Start by signing up on Mokkup.ai using your email. If you already have an account, just log in, and you’ll be good to go.
2. Choose and Customize Your Dashboard Template
Find the Bioenergy Power Plant Boiler Efficiency Dashboard template in the Templates section. Use the drag-and-drop editor to adjust KPIs, edit filters, or add elements based on your data.
3. Export to Your BI Tool
Once your dashboard wireframe is ready, use the BI Tool Export feature to send it directly to Power BI or Tableau for further analysis and enhancements. You can also download the dashboard as a PDF, PNG, or JPEG, embed it on a platform, or invite your team to collaborate.
Note: This is a Pro template. You’ll need a Pro subscription on Mokkup to use and customize this dashboard wireframe. Upgrade anytime to unlock full access.
Bioenergy Power Plant Boiler Efficiency Dashboard Example
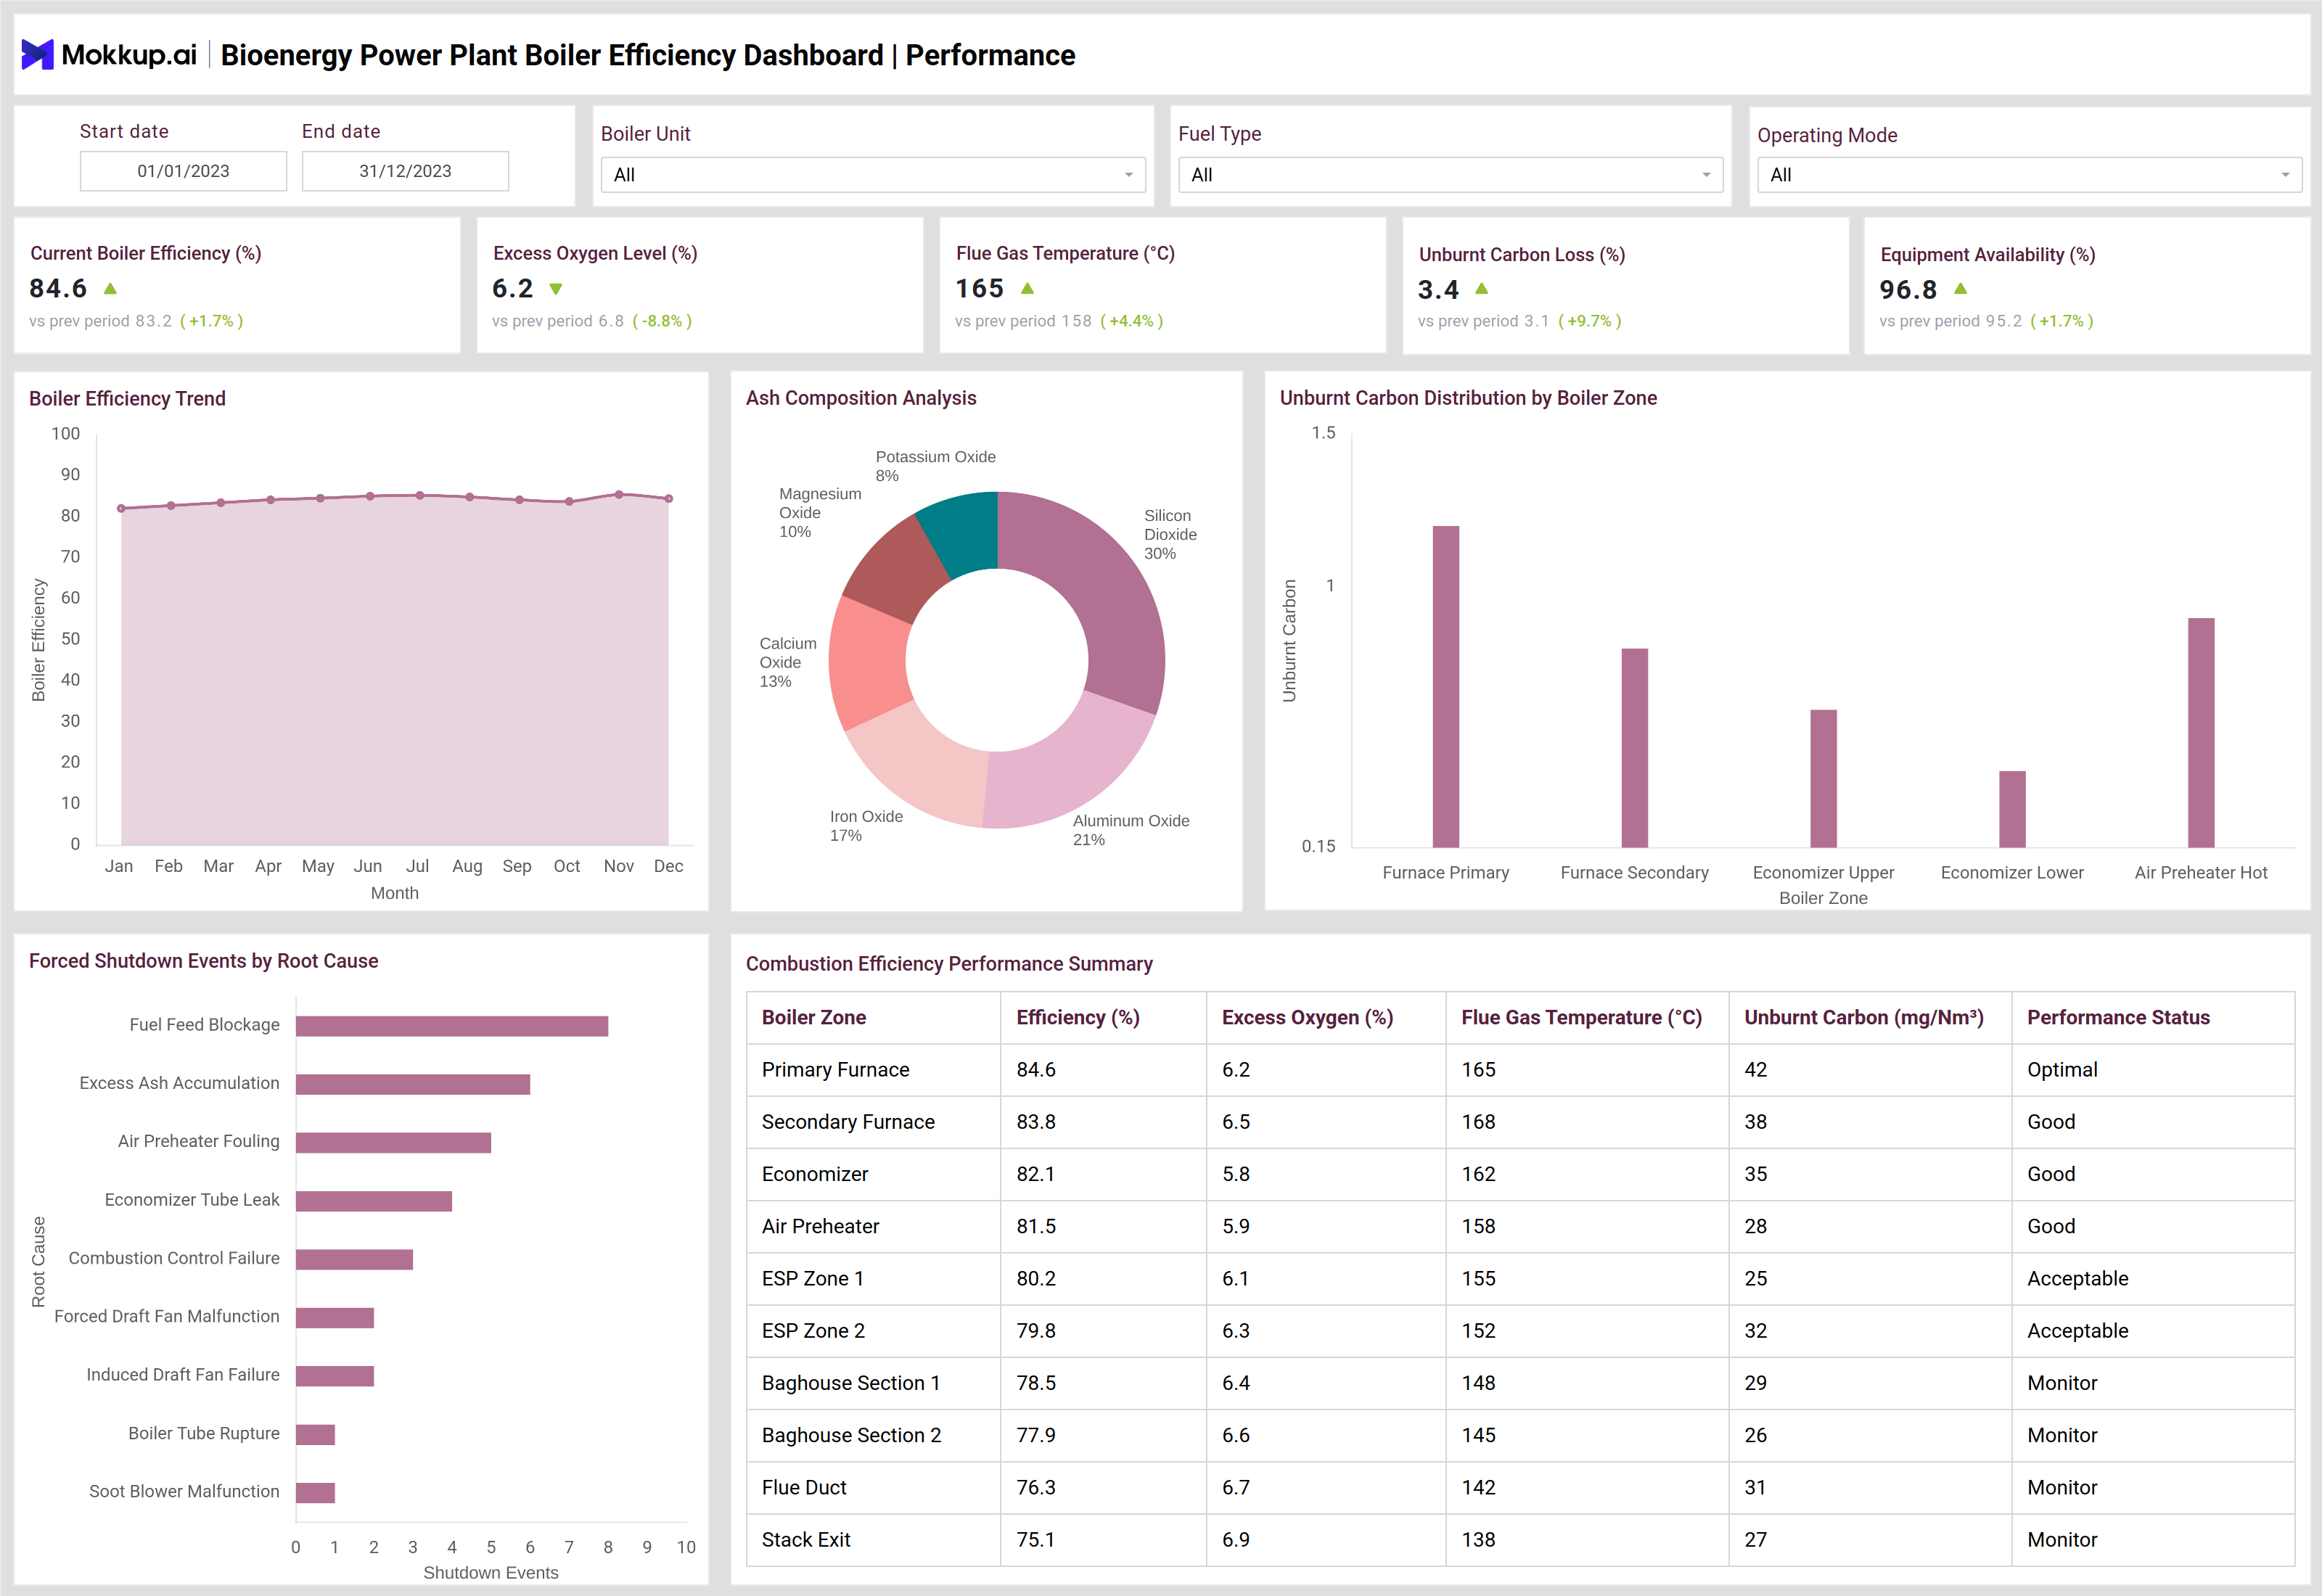
A typical bioenergy boiler efficiency dashboard integrates multiple performance and fuel utilization modules to provide end-to-end visibility into boiler operations. At the top level, operators can view KPIs such as current boiler efficiency, excess oxygen levels, flue gas temperature, unburnt carbon loss, and equipment availability. These indicators offer an immediate snapshot of boiler health and combustion quality. The dashboard visualizes boiler efficiency trends over time, helping teams identify performance deviations or seasonal variations. Ash composition analysis highlights the chemical makeup of combustion residue, enabling early detection of slagging or fouling risks.
Unburnt carbon distribution by boiler zone provides insight into incomplete combustion areas, supporting targeted operational adjustments. Fuel utilization panels extend analysis by tracking biomass consumption, calorific value, moisture content, specific fuel consumption, and fuel blending efficiency. Comparative views such as fuel moisture versus boiler efficiency clearly show how fuel quality impacts energy conversion. Together, these modules form a comprehensive biomass boiler efficiency monitoring and optimization framework.
How to Analyze Bioenergy Power Plant Boiler Efficiency Dashboard
Here is how you can analyze data from this dashboard:
- Review current boiler efficiency alongside excess oxygen and flue gas temperature to assess combustion balance
- Track boiler efficiency trends to detect gradual performance degradation or instability
- Analyze ash composition data to identify fuel quality or combustion residue issues
- Examine unburnt carbon distribution across boiler zones to locate incomplete combustion areas
- Compare fuel moisture content against boiler efficiency to quantify moisture-related energy losses
- Monitor specific fuel consumption trends to evaluate fuel-to-power conversion effectiveness
- Assess forced shutdown events by root cause to prioritize maintenance and operational improvements
Benefits of Bioenergy Power Plant Boiler Efficiency Dashboard
The following are the benefits of using this dashboard:
- Improves bioenergy power plant boiler efficiency through continuous performance visibility
- Enables proactive identification of combustion inefficiencies and heat losses
- Supports biomass boiler efficiency tracking across different fuel types and blends
- Reduces fuel wastage by optimizing fuel moisture and calorific value utilization
- Enhances operational reliability by linking performance data with shutdown root causes
- Lowers operating costs through improved fuel utilization and reduced energy losses
- Strengthens decision-making using bioenergy boiler performance analytics
KPIs to Track in Bioenergy Power Plant Boiler Efficiency Dashboard
The following key KPIs can be tracked by using this dashboard:
- Boiler Efficiency (%) – Measures the effectiveness of converting fuel energy into usable heat
- Excess Oxygen Level (%) – Indicates air-fuel balance and combustion completeness
- Flue Gas Temperature (°C) – Reflects heat recovery effectiveness and stack losses
- Unburnt Carbon Loss (%) – Quantifies incomplete combustion and fuel wastage
- Equipment Availability (%) – Tracks boiler uptime and operational reliability
- Specific Fuel Consumption (kg/kWh) – Measures fuel efficiency per unit of power generated
- Fuel Moisture Content (%) – Assesses fuel quality impact on combustion efficiency
- Fuel Blending Efficiency (%) – Evaluates optimal use of mixed biomass fuels
Frequently Asked Questions
1. What is the primary purpose of a bioenergy boiler efficiency dashboard?
The primary purpose is to monitor and optimize boiler performance by combining combustion efficiency, fuel quality, and operational data into a single analytical view.
2. How does biomass boiler efficiency monitoring improve plant performance?
It helps identify combustion losses, fuel quality issues, and inefficiencies early, enabling corrective actions that improve energy output and reduce fuel costs.
3. Can this dashboard support multiple biomass fuel types?
Yes, it supports analysis across agricultural residue, wood chips, pellets, energy crops, and blended fuels to improve bioenergy plant boiler optimization.
4. Why is fuel moisture tracking critical for boiler efficiency?
High moisture content reduces combustion temperature and efficiency, leading to higher fuel consumption and lower energy output.
5. Who should use a bioenergy boiler efficiency dashboard?
Plant operators, performance engineers, energy managers, and maintenance teams benefit most from using this dashboard for daily operations and optimization planning.