
What is an Oil Fired Power Plant Turbine Management Dashboard?
An Oil Fired Power Plant Turbine Management Dashboard is a strategic visual tool designed to monitor the health, performance, and maintenance of turbines in an oil-fired power generation facility. It consolidates key operational data such as turbine health index, forced outage rates, vibration severity, and maintenance costs into a single, intuitive interface. By integrating oil fired power plant performance tracking, turbine health monitoring for power generation, and predictive maintenance for thermal Turbines, the dashboard enables plant managers and maintenance teams to proactively manage equipment reliability, optimize maintenance schedules, and minimize unplanned downtime.
How to Create an Oil Fired Power Plant Turbine Management Dashboard
You don’t need to build your report from scratch—just start with a ready-to-use dashboard template from Mokkup. Add in your data and export it however you like. Here’s how to do it:
1. Create or Log in to Your Mokkup Account
Start by signing up on Mokkup.ai using your email. If you already have an account, just log in, and you’ll be good to go.
2. Choose and Customize Your Dashboard Template
Find the Oil Fired Power Plant Turbine Management Dashboard template in the Templates section. Use the drag-and-drop editor to adjust KPIs, edit filters, or add elements based on your data.
3. Export to Your BI Tool
Once your dashboard wireframe is ready, use the BI Tool Export feature to send it directly to Power BI or Tableau for further analysis and enhancements. You can also download the dashboard as a PDF, PNG, or JPEG, embed it on a platform, or invite your team to collaborate.
Note: This is a Pro template. You’ll need a Pro subscription on Mokkup to use and customize this dashboard wireframe. Upgrade anytime to unlock full access.
Oil Fired Power Plant Turbine Management Dashboard Example
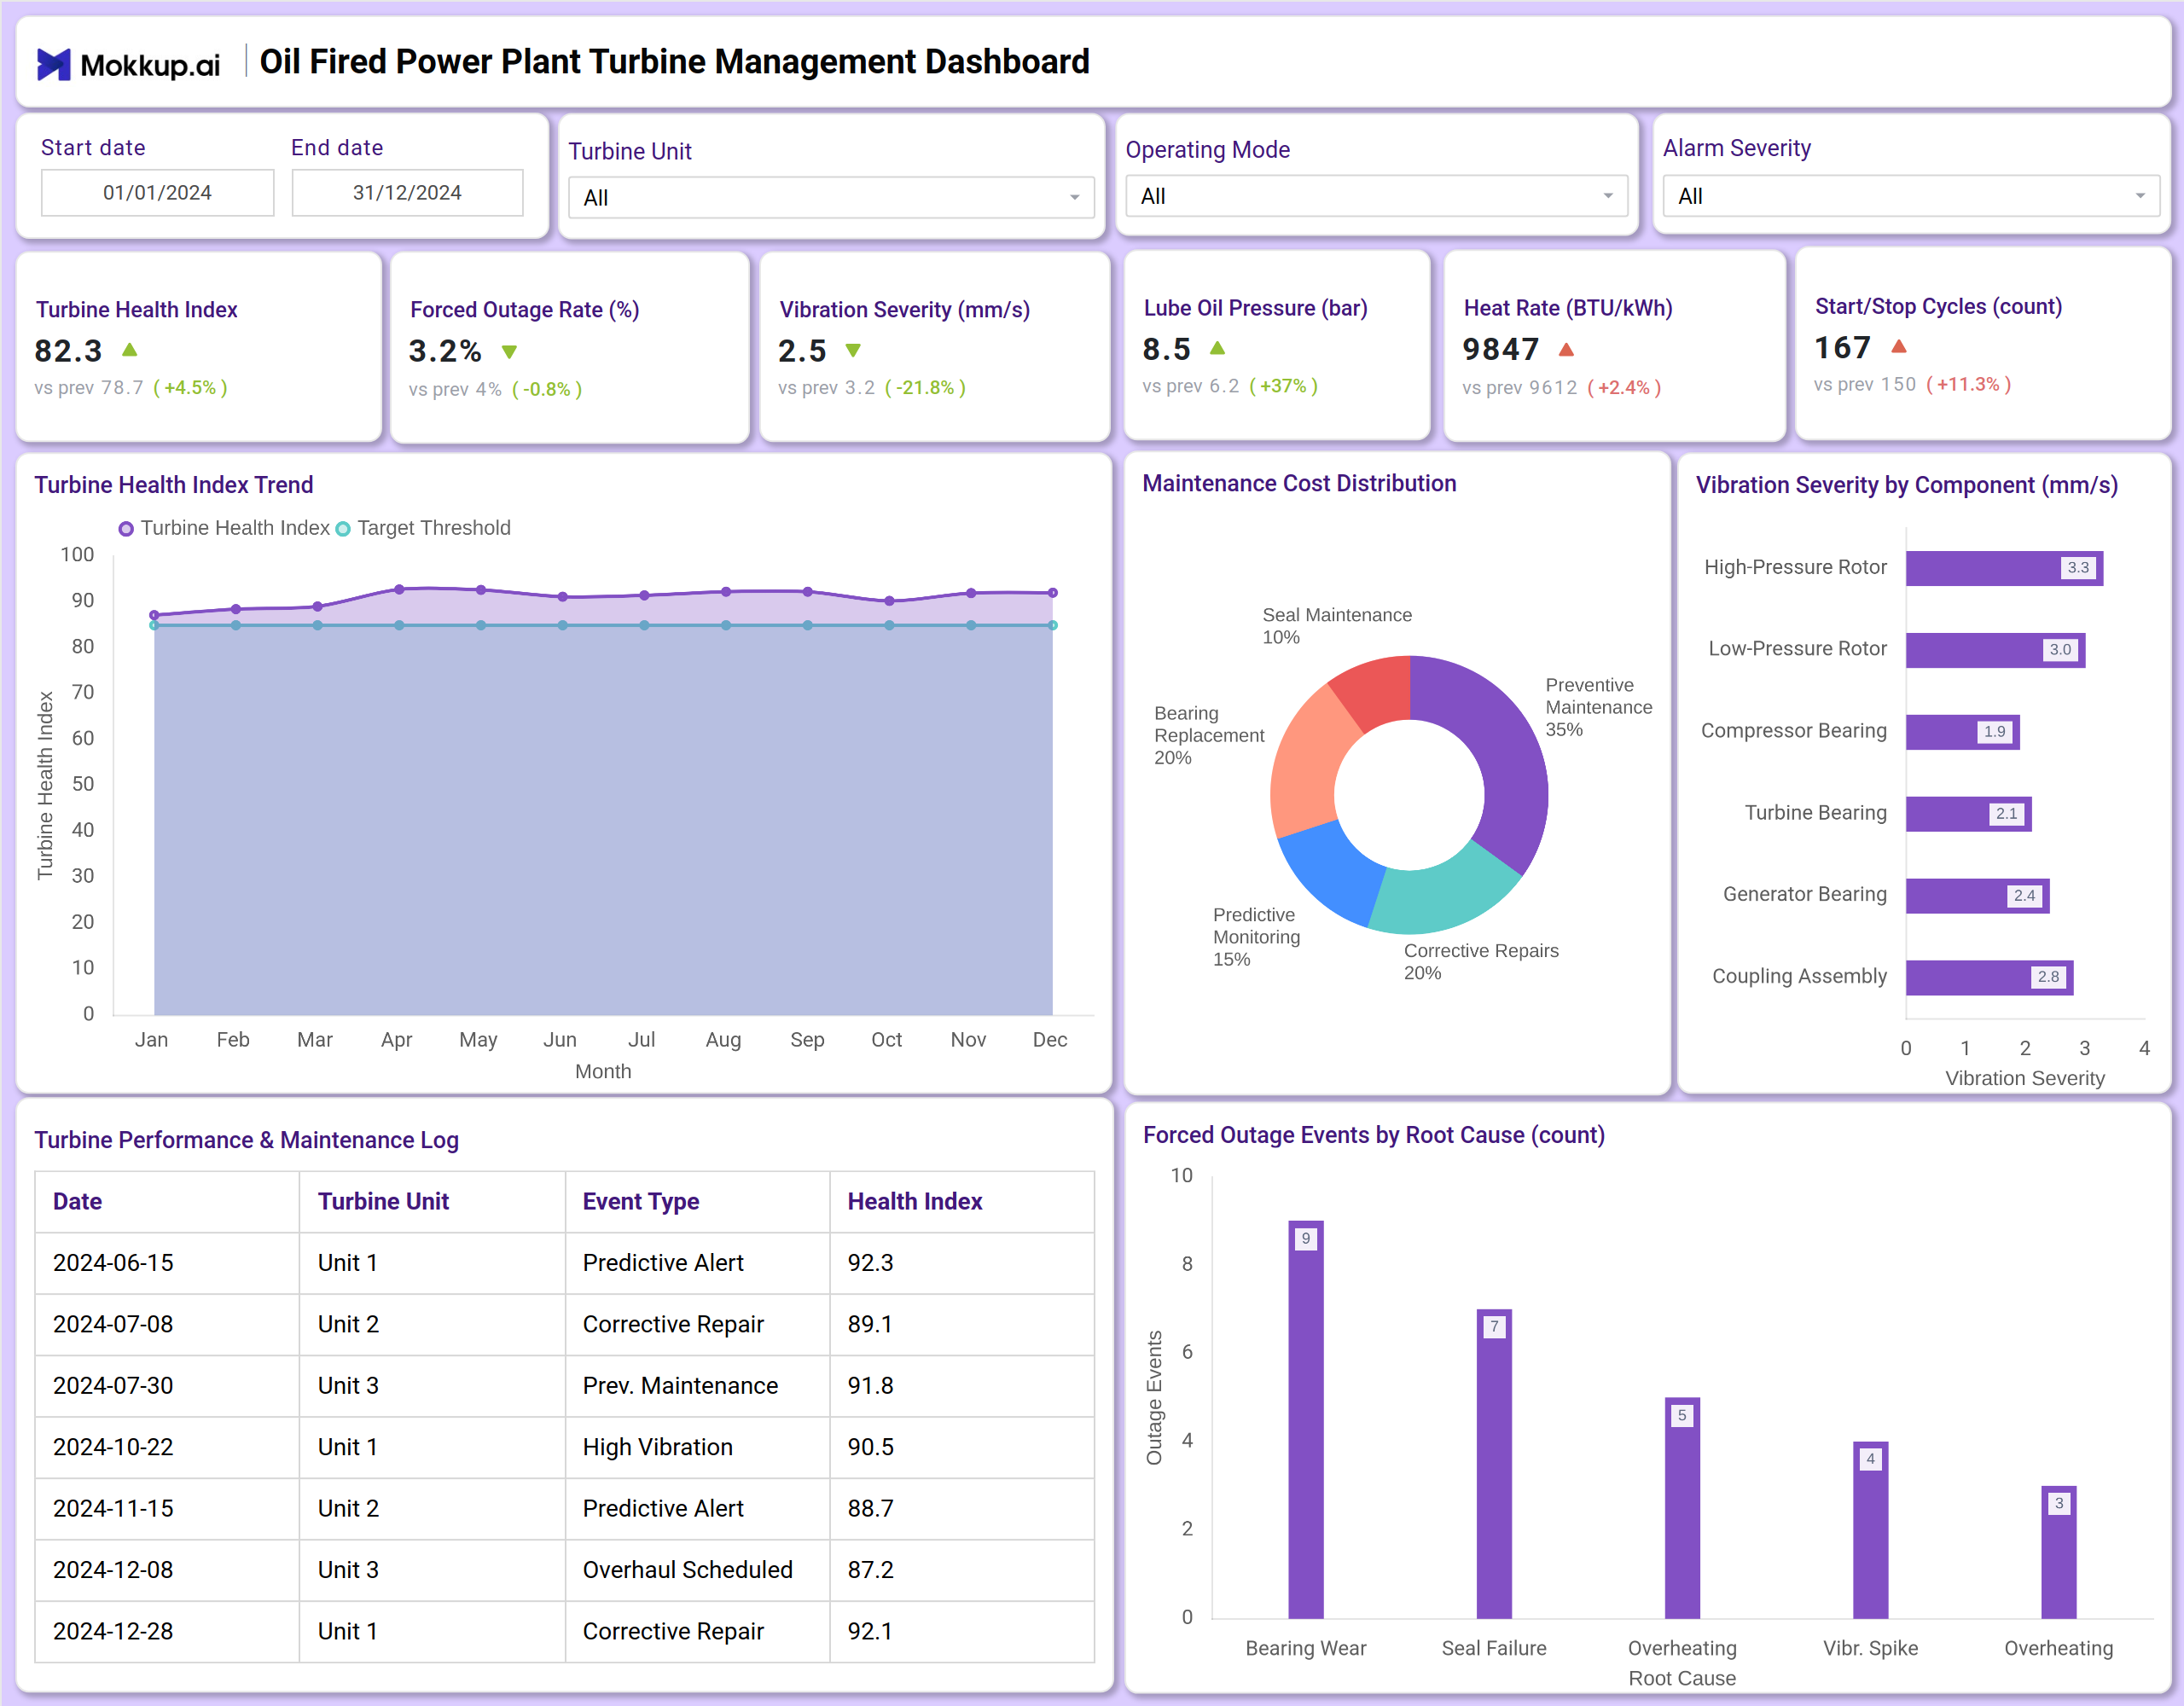
You can create an Oil Fired Power Plant Turbine Management Dashboard that brings together turbine performance and maintenance modules into a unified view. A typical dashboard includes the Turbine Health & Performance section, where users can track the overall Turbine Health Index, Forced Outage Rate, Vibration Severity, and other critical parameters. Visual charts help analyze the historical trend of the health index, the distribution of maintenance costs across various activities, including bearing replacement and predictive monitoring, as well as vibration severity by specific components, such as the high-pressure rotor and generator bearings.
The Maintenance & Outage Analysis dashboard builds on this by displaying a detailed log of performance and maintenance events, including event types like predictive alerts and corrective repairs, alongside the health index at the time. A dedicated chart illustrates forced outage events by their root cause, such as bearing degradation or seal failure. Together, these modules deliver crucial thermal plant Turbine reliability insights that help operators ensure turbine efficiency, schedule maintenance proactively, and uphold strong power generation equipment management standards.
How to Analyze Data in Oil Fired Power Plant Turbine Management Dashboard
Here is how you can analyze data from this dashboard:
- Monitor the Turbine Health Index to gauge the overall condition and reliability of the turbine units.
- Track the Forced Outage Rate (%) to measure the frequency of unplanned shutdowns and assess plant reliability.
- Analyze Vibration Severity (mm/s) to identify potential mechanical issues in the turbine assembly before they lead to failure.
- Review Lube Oil Pressure (bar) to ensure the lubrication system is operating within safe and efficient parameters.
- Assess the Heat Rate (BTU/kWh) to evaluate the thermal efficiency of the power generation process.
- Monitor Start/Stop Cycles (count) to understand the operational profile, as frequent cycling can impact component lifespan.
- Scrutinize the Maintenance Cost Distribution to see how resources are allocated across different maintenance types and identify cost-saving opportunities.
- Evaluate Vibration Severity by Component to pinpoint specific parts of the turbine, like bearings or rotors, that may require attention.
- Review the Turbine Performance & Maintenance Log to track the history of events, interventions, and their impact on turbine health.
- Analyze Forced Outage Events by Root Cause to identify recurring issues and implement targeted preventive measures.
Benefits of Oil Fired Power Plant Turbine Management Dashboard
The following are the benefits of using this dashboard:
- Provides a centralized overview of turbine health, performance, and maintenance activities.
- Supports proactive maintenance planning for power plants by highlighting trends in vibration and health index.
- Improves decision-making for maintenance scheduling and resource allocation.
- Enhances turbine performance optimization by tracking key efficiency metrics like heat rate.
- Reduces operational risks through early identification of component degradation.
- Lowers the likelihood of catastrophic failures and forced outages.
- Streamlines reporting on Turbine reliability and maintenance effectiveness for stakeholders.
- Offers valuable historical analysis of power plant operations for continuous improvement.
KPIs to Track in Oil Fired Power Plant Turbine Management Dashboard
The following key KPIs can be tracked by using this dashboard:
- Turbine Health Index (%): A composite score indicating the overall operational condition and remaining useful life of the turbine.
- Forced Outage Rate (%): The percentage of time the turbine was unavailable due to unplanned breakdowns.
- Vibration Severity (mm/s): The magnitude of vibration in the turbine system, indicating mechanical balance and component wear.
- Lube Oil Pressure (bar): The pressure of the lubricating oil, critical for preventing friction and damage in moving parts.
- Heat Rate (BTU/kWh): A measure of the plant's thermal efficiency, representing the amount of heat energy required to produce a unit of electricity.
- Start/Stop Cycles (count): The number of times the turbine has been started and shut down, which contributes to mechanical stress.
- Maintenance Cost Distribution (%): The allocation of total maintenance spending across different categories, such as seal maintenance or bearing replacement.
- Vibration by Component (mm/s): The vibration levels are measured at specific turbine sub-assemblies to localize potential issues.
Frequently Asked Questions
1. What is the purpose of an oil fired power plant Turbine dashboard?
It helps monitor the health and performance of turbines, track maintenance activities, and analyze the root causes of outages to improve reliability.
2. Can the dashboard help reduce maintenance costs?
Yes. By providing insights into the distribution of maintenance costs and highlighting components with high vibration, it helps optimize maintenance strategies and prioritize spending.
3. How does the dashboard improve turbine reliability?
It enables turbine health monitoring for power generation by tracking key indices and vibration trends, allowing for proactive interventions before failures occur.
4. Does it track the reasons for turbine shutdowns?
Yes. It analyzes explicitly forced outage events by root cause, such as bearing degradation or seal failure.
5. Who uses this dashboard?
Plant managers, maintenance supervisors, reliability engineers, and operations teams are responsible for power generation equipment management.