What is an Eye Hospital Equipment and Instruments Management Dashboard?
An Eye Hospital Equipment and Instruments Management Dashboard is a healthcare analytics tool that monitors medical device usage, downtime, maintenance, and revenue contribution. It centralizes key KPIs such as test volumes, utilization rates, preventive maintenance, and per-procedure revenue.
The eye equipment and instruments management dashboard template enables hospitals and diagnostic centers to track performance across branches and equipment categories. Acting as a real-time medical equipment monitoring dashboard, it improves efficiency, minimizes downtime, and ensures maximum return on investment for eye hospitals.
How To Create an Eye Hospital Equipment and Instruments Management Dashboard
You don’t need to build your report from scratch—just start with a ready-to-use Eye Hospital Equipment and Instruments Management dashboard template from Mokkup. Add in your data and export it however you like. Here’s how to do it:
1. Create or Log in to Your Mokkup Account
Start by signing up on Mokkup.ai using your email. If you already have an account, just log in, and you’ll be good to go.
2. Choose and Customize Your Dashboard Template
Find the Eye Hospital Equipment and Instruments Management Dashboard template in the Templates section. Use the drag-and-drop editor to adjust KPIs, edit filters, or add elements based on your data.
3. Export to Your BI Tool
Once your dashboard wireframe is ready, use the BI Tool Export feature to send it directly to Power BI or Tableau for further analysis and enhancements. You can also download the dashboard as a PDF, PNG, or JPEG, embed it on a platform, or invite your team to collaborate.
Note: This is a Pro template. You’ll need a Pro subscription on Mokkup to use and customize this dashboard wireframe. Upgrade anytime to unlock full access.
Eye Hospital Equipment and Instruments Management Dashboard Example
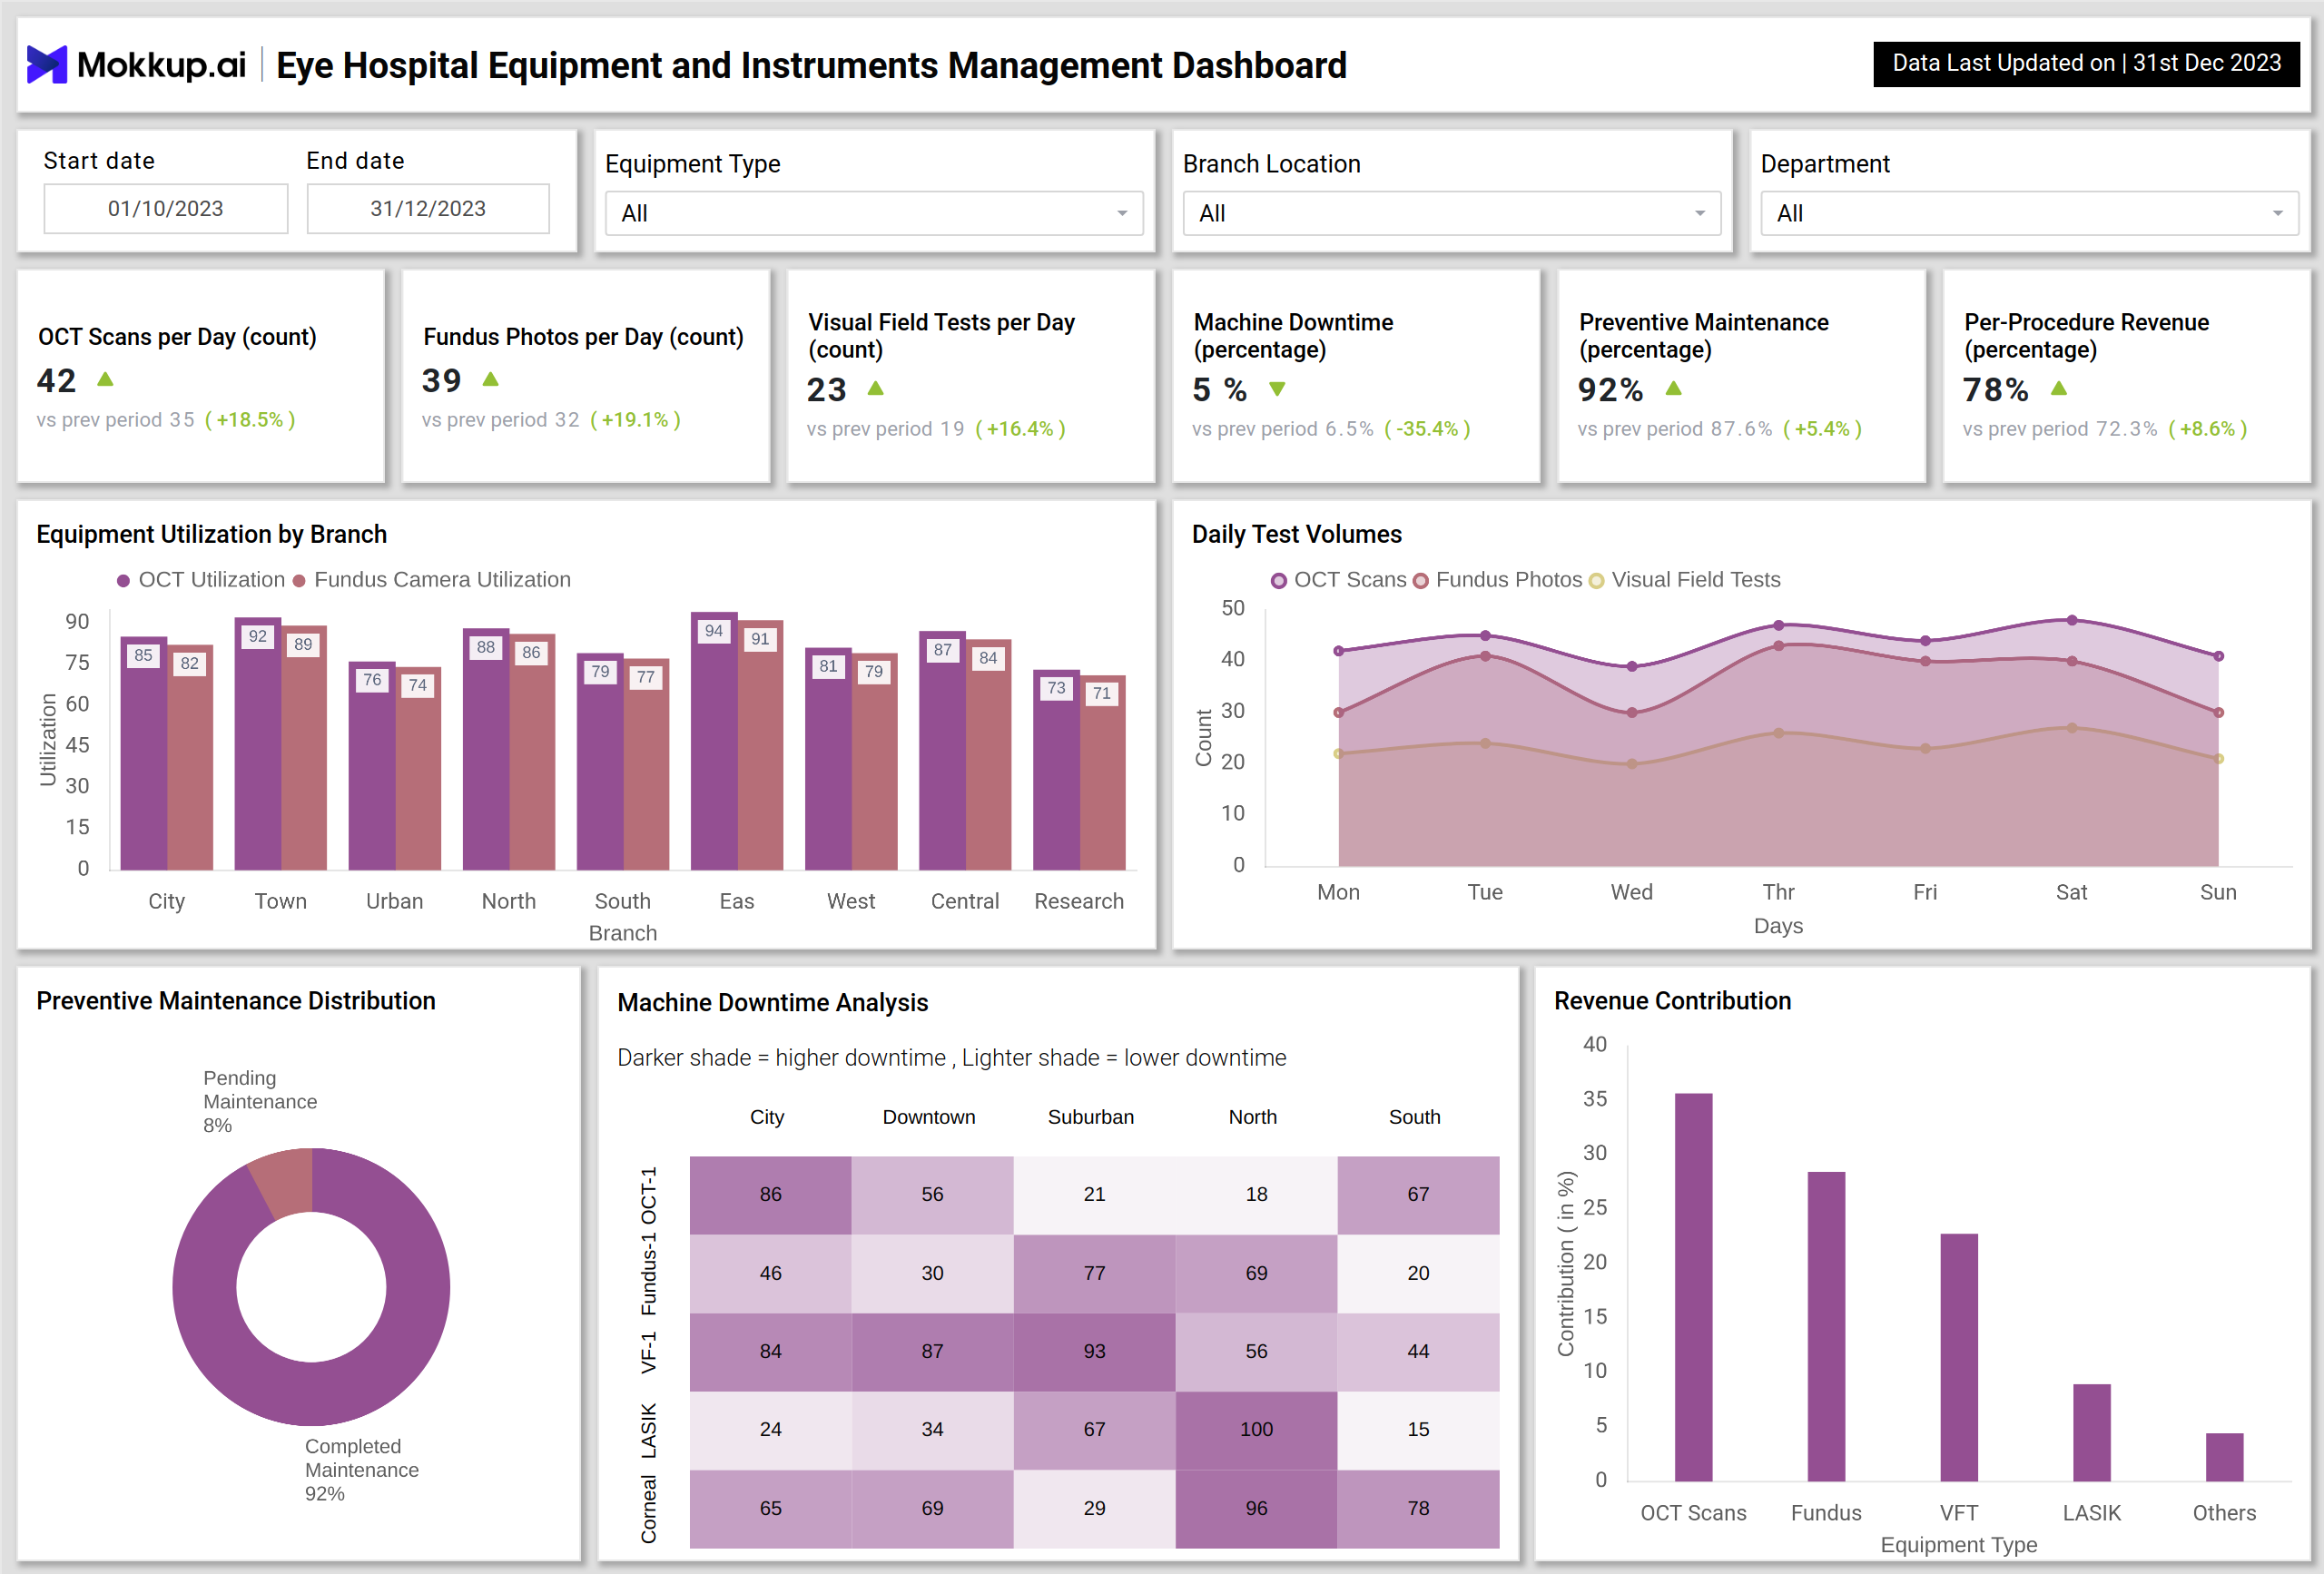
The example dashboard provides a detailed view of equipment performance across branches and departments. At the top, key KPIs track OCT scans, fundus photos, visual field tests, downtime percentage, preventive maintenance, and per-procedure revenue. These indicators provide both operational and financial perspectives.
Charts include Equipment Utilization by Branch, which compares OCT and Fundus camera usage across locations, and Daily Test Volumes, which shows weekly activity trends. The Preventive Maintenance Distribution pie chart highlights the balance between completed and pending maintenance, while the Machine Downtime Analysis heatmap reveals downtime severity across equipment and branches.
Finally, the Revenue Contribution bar chart shows how different equipment types—OCT, Fundus, VFT, LASIK, and others contribute to hospital income. This medical equipment utilization dashboard helps clinics balance patient demand, manage equipment health, enhance financial outcomes, and improve care quality.
How to Analyze Data in Eye Hospital Equipment and Instruments Management Dashboards
Organizations can use an equipment and instruments management dashboard template effectively by:
- Monitoring Equipment Utilization – Ensure machines are being used at optimal levels across branches.
- Tracking Preventive Maintenance – Use the real-time medical equipment monitoring dashboard to confirm regular servicing and reduce breakdowns.
- Analyzing Downtime Trends – Leverage downtime heatmaps to detect underperforming machines.
- Evaluating Daily Test Volumes – Correlate test trends with patient demand for better resource allocation.
- Measuring Revenue Contribution – Treat the dashboard as an incident tracking and utilization dashboard to identify equipment generating the most value.
Benefits of Eye Hospital Equipment and Instruments Management Dashboards
Implementing an Eye Hospital Equipment and Instruments Management Dashboard provides key benefits:
- Improved Equipment Utilization: The equipment and instruments management dashboard template ensures machines are used effectively.
- Reduced Downtime: The real-time medical equipment monitoring dashboard minimizes disruptions through preventive maintenance.
- Cost Optimization: Tracks revenue contribution by equipment type to maximize ROI.
- Better Planning: Downtime heatmaps and utilization charts support resource allocation decisions.
- Enhanced Compliance: Maintenance tracking ensures machines meet safety and performance standards.
KPIs to Track in Eye Hospital Equipment and Instruments Management Dashboards
The key KPIs include:
- OCT Scans per Day (count) – Measures diagnostic throughput, reflecting patient demand.
- Machine Downtime (%) – Tracks equipment downtime to minimize service disruptions.
- Preventive Maintenance (%) – Evaluates completion of scheduled maintenance tasks.
- Equipment Utilization (%) – Shows how effectively devices are being used across branches.
- Per-Procedure Revenue (%) – Monitors revenue generated per diagnostic or procedure, reflecting financial performance.
Frequently Asked Questions
1. Why is an Eye Hospital Equipment and Instruments Management Dashboard important?
It provides real-time insights into equipment performance, utilization, and maintenance, helping reduce downtime and improve revenue.
2. Which healthcare facilities benefit most from this dashboard?
A medical equipment utilization dashboard benefits hospitals, diagnostic centers, eye hospitals, and multi-branch healthcare networks the most.
3. Can this dashboard reduce equipment downtime?
Yes. By monitoring usage and scheduling timely maintenance, the dashboard helps minimize equipment failures and downtime.