
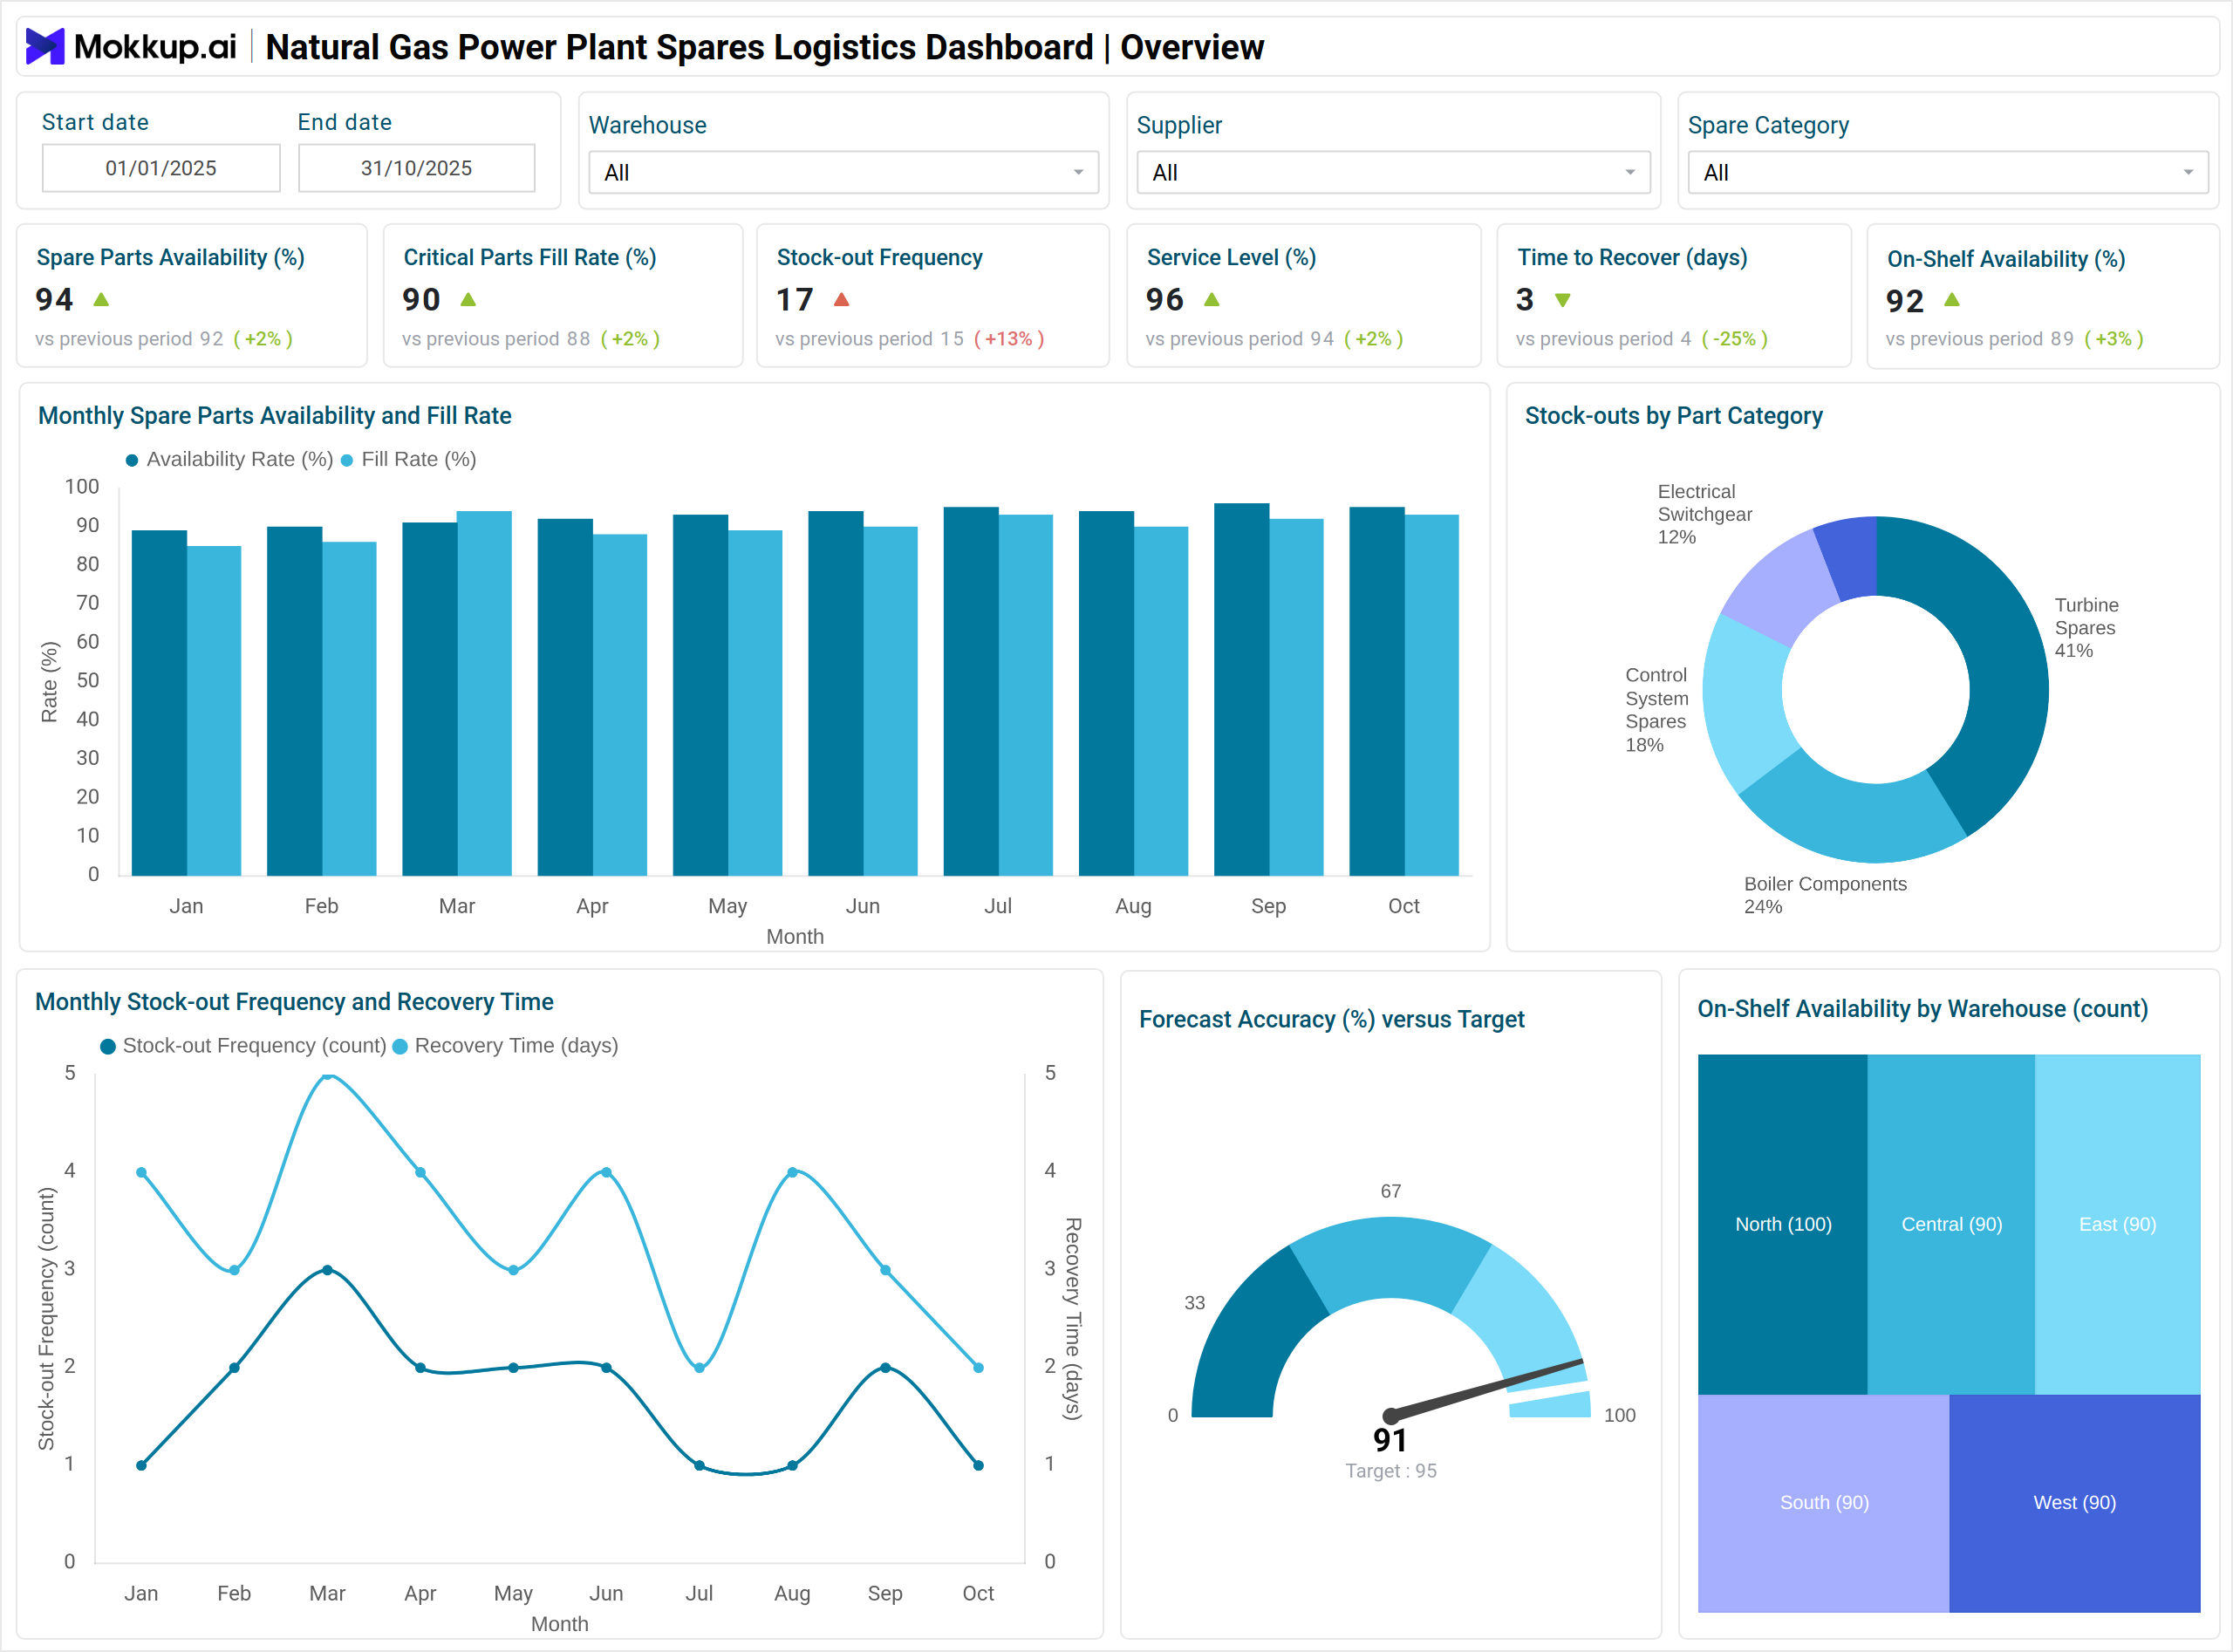
What is a Natural Gas Power Plant Spares Logistics Dashboard?
A Natural Gas Power Plant Spares Logistics Dashboard is a supply chain monitoring system designed for electric power utilities running natural gas-fired power generation assets. It centralizes spare parts visibility, storage performance, supplier efficiency, and procurement activity. The dashboard supports maintenance teams, supply chain planners, and warehouse supervisors who manage gas turbine components, critical spares, consumables, and emergency replacements. With spare parts inventory visibility for gas turbine maintenance, power plants avoid stock-outs, delays, and unplanned shutdowns. Utilities depend on immediate access to operational spares. Any missing part can stop a turbine, reduce generation capacity, or delay return-to-service.
This dashboard gives gas turbine spare parts availability and procurement insights, allowing better maintenance scheduling, supplier coordination, and replenishment planning. Through continuous tracking, the dashboard improves lifecycle management of key components needed for compressors, burners, filters, valves, ignition systems, and rotating machinery. This spare parts logistics dashboard for natural gas power plants helps utilities monitor stock levels, supplier performance, purchasing activity, and warehouse operations for gas turbines.
How to Create a Natural Gas Power Plant Spares Logistics Dashboard
You don’t need to build your report from scratch—just start with a ready-to-use dashboard template from Mokkup. Add in your data and export it however you like. Here’s how to do it:
1. Create or Log in to Your Mokkup Account
Start by signing up on Mokkup.ai using your email. If you already have an account, just log in, and you’ll be good to go.
2. Choose and Customize Your Dashboard Template
Find the Natural Gas Power Plant Spares Logistics Dashboard template in the Templates section. Use the drag-and-drop editor to adjust KPIs, edit filters, or add elements based on your data.
3. Export to Your BI Tool
Once your dashboard wireframe is ready, use the BI Tool Export feature to send it directly to Power BI or Tableau for further analysis and enhancements. You can also download the dashboard as a PDF, PNG, or JPEG, embed it on a platform, or invite your team to collaborate.
Note: This is a Pro template. You’ll need a Pro subscription on Mokkup to use and customize this dashboard wireframe. Upgrade anytime to unlock full access.
Natural Gas Power Plant Spares Logistics Dashboard Example
Consider a maintenance planning team at a natural gas power station preparing for a turbine service outage. The dashboard shows spare parts availability rate, safety stock position, reorder point compliance, and incoming shipments. If a critical part falls below threshold, procurement teams receive alerts to expedite an order.
A supply chain dashboard for natural gas-fired power generation also displays supplier lead time trends. If a supplier repeatedly misses delivery schedules, planners can switch to an alternate vendor. Warehouse supervisors can monitor on-shelf availability and identify where parts are sitting idle, allowing set-level redistribution to avoid overstocking.
A logistics monitoring system for power plant spare components also offers cost insights. Inventory turnover trends show which items move frequently and which accumulate. When procurement compliance falls, management can identify departments bypassing approved purchasing workflows.The dashboard supports critical spare parts tracking in natural gas power utilities, helping teams identify shortages before maintenance shutdowns begin.Teams gain gas turbine spare parts availability and procurement insights, making it easier to verify supplier reliability and delivery performance.
Through this view, decision makers receive a complete operational picture—from warehouse to supplier to turbine—allowing efficient, no-delay maintenance execution.
How to Analyze Data in Natural Gas Power Plant Spares Logistics Dashboard
Here’s how teams can analyze data in spare parts logistics dashboards:
- Assess Availability Trends: Compare current spare parts availability rates with historical performance to spot emerging supply risks.
- Monitor Critical Demand Fulfillment: Track critical parts fill rates to understand how well urgent maintenance requirements are being met.
- Evaluate Stock-Out Behavior: Review stock-out frequency and recovery times to gauge emergency responsiveness and identify gaps.
- Check Warehouse Distribution: Analyze on-shelf availability across warehouses to detect imbalances or understocked locations.
- Strengthen Demand Planning: Measure forecast accuracy to refine demand planning models and reduce uncertainty.
- Validate Supplier Reliability: Study average supplier lead times to confirm consistency and identify vendors causing delays.
- Understand Emergency Orders: Review expedited order patterns to uncover preventable operational emergencies.
- Measure Procurement Compliance: Track adherence to procurement contracts to control costs and maintain sourcing discipline.
- Optimize Inventory Turnover: Evaluate turnover rates to minimize excess stock and lower carrying costs.
- Prevent Shortages: Correlate compliance with reorder point rules to ensure timely replenishment and avoid shortages.
Benefits of Natural Gas Power Plant Spares Logistics Dashboard
This dashboard provides several benefits:
- Centralized Inventory Visibility: Gives maintenance teams a clear view of all spare parts required for gas turbine operations.
- Better Tracking of Critical Spares: Strengthens monitoring of high-priority components needed for natural gas power plant maintenance.
- Reduced Stock-Outs: Lowers the risk of shortages and helps shorten maintenance downtime.
- Standardized Procurement Practices: Encourages consistent purchasing behavior across departments and improves sourcing discipline.
- Smarter Planning: Enhances forecasting, replenishment, and warehouse allocation decisions.
- Supplier Performance Insights: Supports evaluation of vendor reliability through lead time and delivery performance tracking.
- Lower Carrying Costs: Minimizes excess inventory and reduces storage expenses.
- Stronger Outage Preparation: Improves readiness for turbine overhauls and rotating equipment outages.
- Better Maintenance Readiness: Supports both planned and emergency work orders with reliable spare parts availability.
- Higher Unit Reliability: Increases operational reliability for gas-fired generating units.
KPIs to Track in Natural Gas Power Plant Spares Logistics Dashboard
- Spare Parts Availability Rate – Measures the percentage of required spare parts that are available when needed.
- Critical Parts Fill Rate – Shows how often urgent spare part requests are fully met without delay.
- Stock-out Frequency – Tracks how many times required spare parts were unavailable during maintenance or operations.
- Time to Recover from Stock-out – Measures the time taken to source and deliver a part once a shortage occurs.
- On-Shelf Availability – Indicates the proportion of stocked items physically present and accessible in warehouse storage.
- Forecast Accuracy Percent – Compares predicted spare parts demand against actual consumption.
- Average Supplier Lead Time – Measures the time suppliers take to deliver ordered spare parts.
Frequently Asked Questions
Q1. Who uses a Natural Gas Power Plant Spares Logistics Dashboard?
Maintenance planners, warehouse supervisors, procurement teams, and operations managers in natural gas-fired power plants.
Q2. How does the dashboard reduce stock-outs?
It displays inventory thresholds, reorder points, arrival schedules, supplier performance, and fulfillment history. Planners act before shortages occur.
Q3. Can the dashboard support gas turbine overhaul planning?
Yes. It shows required spares, usage predictions, and availability status to prepare for inspections, combustion services, hot gas path outages, and major overhauls.
Q4. How does the dashboard improve supplier management?
Average supplier lead time, purchase order volumes, and compliance metrics identify strong and weak vendors. Procurement can negotiate better terms or switch suppliers if delays continue.
Q5. What makes this dashboard valuable for power utilities?
It provides a unified spare parts logistics view for natural gas power plants, increases reliability of generation assets, avoids turbine stoppages, and improves cost control.