
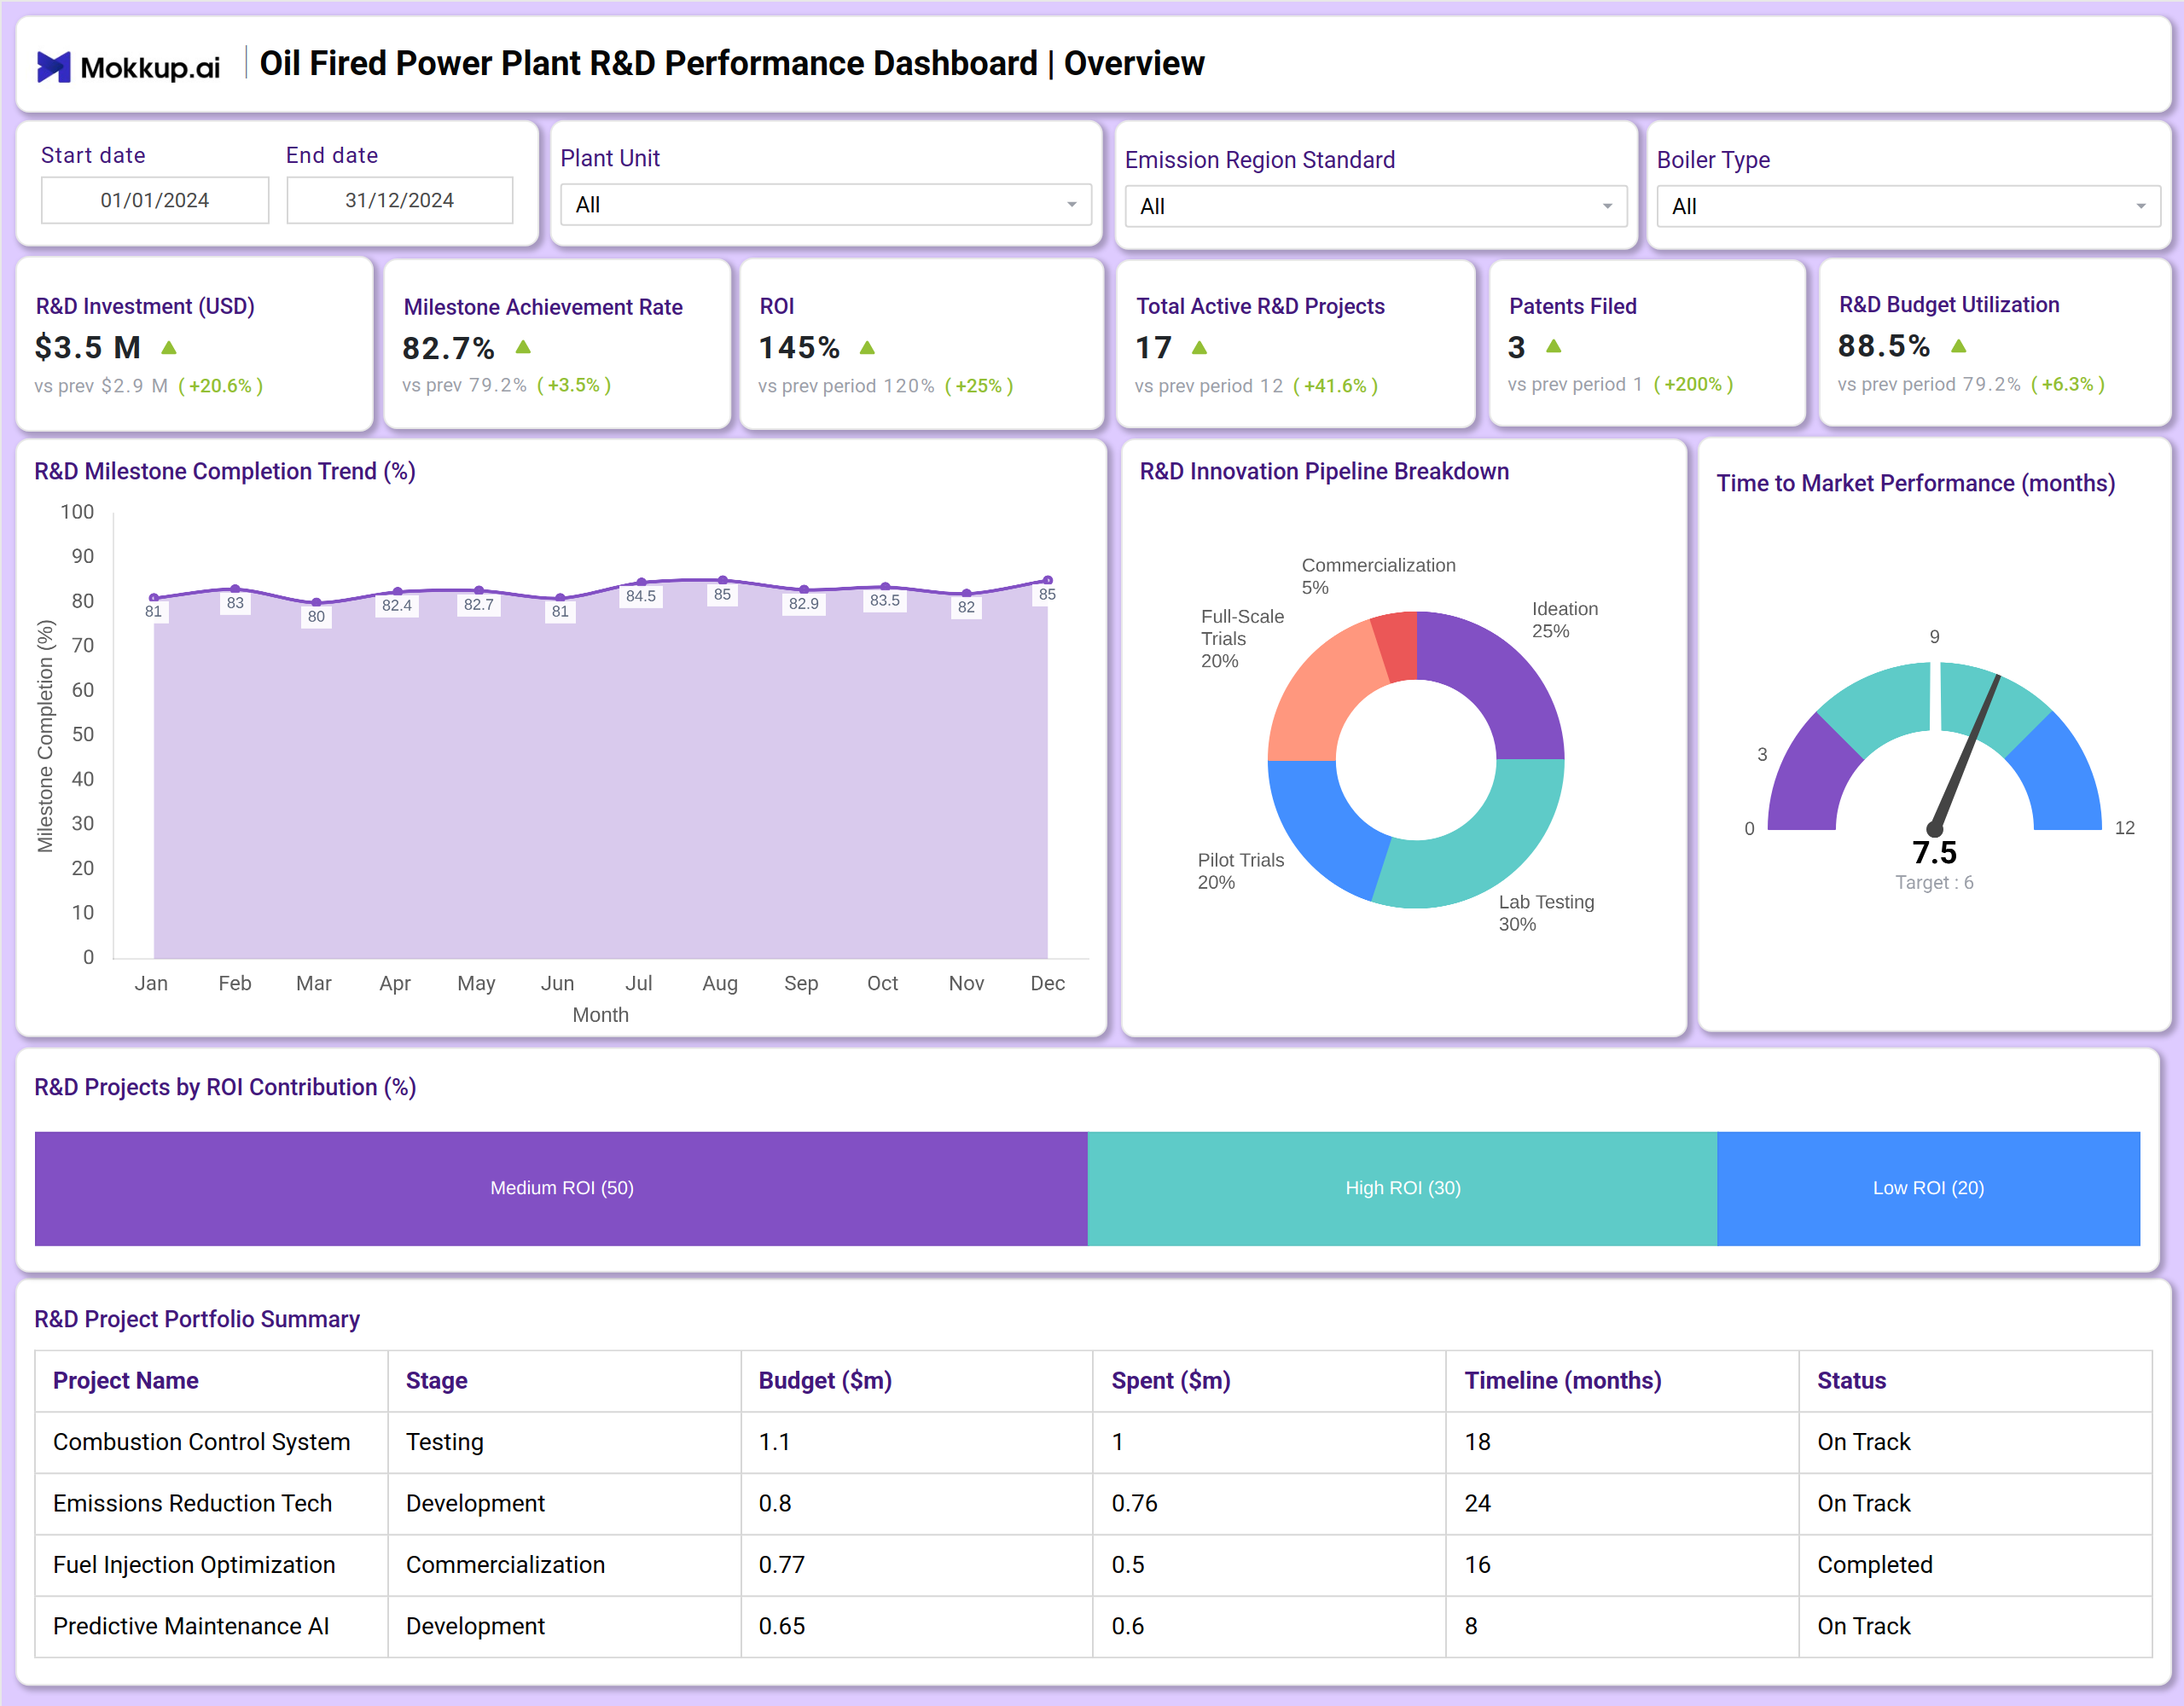
What is an Oil Fired Power Plant R&D Performance Dashboard?
An Oil Fired Power Plant R&D Performance Dashboard is a strategic tool designed to monitor and manage the performance, efficiency, and output of research and development activities within an oil-fired power generation facility. It consolidates data related to financial investment, project milestones, innovation pipeline status, and technical breakthroughs into a single visual platform. By integrating R&D performance tracking for power plants, innovation pipeline management, and technical research KPIs, the dashboard helps R&D managers and plant operators track progress, optimize resource allocation, and demonstrate the value of innovation investments. The dashboard serves as a central hub for monitoring milestone completion, assessing the health of the project portfolio, and identifying technical advancements that can enhance plant efficiency and reduce environmental impact.
How to Create an Oil Fired Power Plant R&D Performance Dashboard
You don’t need to start from scratch—simply use a pre-designed dashboard template from Mokkup. Input your data and export it in your preferred format. Here’s how:
1. Create or Log in to Your Mokkup Account
Start by signing up on Mokkup.ai using your email. If you already have an account, just log in, and you’ll be good to go.
2. Choose and Customize Your Dashboard Template
Find the Oil Fired Power Plant R&D Performance Dashboard template in the Templates section. Use the drag-and-drop editor to adjust KPIs, edit filters, or add elements based on your data.
3. Export to Your BI Tool
Once your dashboard wireframe is ready, use the BI Tool Export feature to send it directly to Power BI or Tableau for further analysis and enhancements. You can also download the dashboard as a PDF, PNG, or JPEG, embed it on a platform, or invite your team to collaborate.
Note: This is a Pro template. You’ll need a Pro subscription on Mokkup to use and customize this dashboard wireframe. Upgrade anytime to unlock full access.
Oil Fired Power Plant R&D Performance Dashboard Example
You can create an Oil Fired Power Plant R&D Performance Dashboard that brings together financial, project, and technical modules into a unified view. A typical dashboard includes the Overview section, where users can track R&D Investment, Milestone Achievement Rate, and ROI. Visual charts help analyze the R&D Milestone Completion Trend, break down the R&D Innovation Pipeline, and summarize the project portfolio with details on budget, spend, and status. The Technical Insights dashboard builds on this by displaying key technical metrics, such as the Fuel Blend Trial Success Rate and Emission Reduction Achieved, as well as critical indices like Fouling and Slagging. A detailed table summarizes Fuel Blend Performance, while charts track the Emission Reduction Trend and Project Success Rate by technology category. Together, these modules deliver crucial R&D insights that help operators justify investment, accelerate time to market for new technologies, and drive innovation in plant efficiency and emission control.
How to Analyze Data in Oil Fired Power Plant R&D Performance Dashboard
Here is how you can analyze data from this dashboard:
- Milestone Achievement Rate: Review this metric to evaluate the effectiveness of R&D initiatives in progressing against planned timelines and assess overall on-time delivery performance.
- R&D Budget Utilization: Monitor spending patterns to ensure financial resources are used efficiently and to identify risks of budget overruns or under-utilization.
- ROI & R&D Projects by ROI Contribution: Track return on investment to prioritize high-value R&D initiatives and evaluate the financial impact of innovation efforts.
- R&D Innovation Pipeline Breakdown: Analyze how projects are distributed across stages from lab testing and pilot trials to commercialization to ensure a balanced innovation pipeline.
- Time-to-Market Performance: Compare actual timelines against targets to identify process bottlenecks that delay the commercialization of products or technologies.
- Total Active R&D Projects & Patents Filed: Assess overall R&D activity levels and intellectual property output to measure innovation intensity and long-term value creation.
- Fuel Blend Trial Success Rate & Emission Reduction Achieved: Evaluate the effectiveness of experimental fuel blends and technologies aimed at improving efficiency and reducing emissions.
- Fouling and Slagging Index: Monitor the impact of new fuels or technologies on boiler health to anticipate maintenance needs and operational risks.
- Project Success Rate by Technology Category: Identify which research areas, such as combustion optimization or control systems, are delivering the strongest results.
Benefits of Oil Fired Power Plant R&D Performance Dashboard
The following are the benefits of using this dashboard:
- Centralized R&D Performance Visibility: Provides a unified view of both financial and technical performance across the entire R&D portfolio.
- Data-Driven R&D Decision-Making: Enables informed decisions for R&D performance tracking and innovation pipeline management.
- Improved Strategic Planning: Provides clear insights into project timelines, budgets, and milestone completion, enabling better long-term planning.
- Enhanced Accountability: Tracks key technical KPIs, research outcomes, and breakthrough achievements across teams.
- Higher R&D Operational Efficiency: Improves efficiency through continuous monitoring of project portfolio health.
- Stronger Stakeholder Communication: Simplifies reporting with structured insights into ROI, patents, and project status.
- Reduced Manual Reporting Effort: Minimizes effort through automated data consolidation and streamlined reporting.
- Preparedness for Strategic Reviews: Ensures readiness for audits and leadership reviews with comprehensive technical and financial records.
KPIs to Track in Oil Fired Power Plant R&D Performance Dashboard
The following key KPIs can be tracked by using this dashboard:
- R&D Investment (USD): The total capital allocated to research and development activities
- Total Active R&D Projects (count): The number of R&D initiatives currently in progress across all stages.
- R&D Budget Utilization (%): The percentage of the allocated R&D budget that has been spent.
- Time to Market Performance (months): The average duration it takes for an R&D project to move from initiation to commercialization.
- Fuel Blend Trial Success Rate (%): The percentage of fuel blend experiments that meet their predefined performance criteria.
- Emission Reduction Achieved (%): The overall reduction in targeted emissions (e.g., NOx, SOx) attributable to R&D projects.
- Technical Breakthroughs (count): The number of significant innovations or discoveries achieved by the R&D team.
- Fouling Index: A numerical indicator of the rate of ash deposition on boiler heat transfer surfaces, impacting efficiency.
- Slagging Index: A measure of the propensity for ash to form molten deposits on furnace walls, affecting boiler operation.
- Project Success Rate (%): The percentage of R&D projects that are completed and deemed successful against their original objectives.
Frequently Asked Questions
1. What is the purpose of an oil fired power plant R&D dashboard?
It helps monitor the financial performance of R&D investments, track project progress and milestones, and oversee technical metrics like emission reduction and trial success rates.
2. Can the dashboard support R&D portfolio reviews?
It provides insights into project timelines, budget adherence, milestone completion, and technical efficacy, allowing managers to identify bottlenecks and reallocate resources for better outcomes.
3. How does the dashboard improve R&D performance?
By providing clear insights into storage trends, discharge activities, and energy efficiency, it supports better operational decisions.
4. Does it track environmental and efficiency improvements from R&D?
Yes. It monitors key technical indicators, such as emission reduction percentages and fuel blend trial success, which directly relate to environmental and operational efficiency gains.
5. Who uses this dashboard?
R&D managers, plant directors, innovation officers, technical leads, and financial analysts oversee the power plant's research and development portfolio.