What is an Investment Review Dashboard?
An Investment Review Dashboard is a comprehensive analytics platform that helps financial institutions and advisors monitor the progress, compliance, and efficiency of investment account reviews. It consolidates data from multiple sources to provide a unified view of review completion status, overdue accounts, advisor performance, and timeliness trends. With its interactive visualizations, this investment review dashboard analytics tool ensures financial teams can track adherence to internal policies and regulatory deadlines.
The dashboard serves as an operational command center, streamlining compliance management, enhancing advisor accountability, and providing real-time insights into portfolio performance. Whether managing retail, high-net-worth (HNI), or institutional clients, this system helps organizations maintain review quality while improving oversight across all portfolios.
How to Create an Investment Review Dashboard
You don’t need to build your report from scratch—just start with a ready-to-use dashboard template from Mokkup. Add in your data and export it however you like. Here’s how to do it:
1. Create or Log in to Your Mokkup Account
Start by signing up on Mokkup.ai using your email. If you already have an account, just log in, and you’ll be good to go.
2. Choose and Customize Your Dashboard Template
Find the Investment Review Dashboard template in the Templates section. Use the drag-and-drop editor to adjust KPIs, edit filters, or add elements based on your data.
3. Export to Your BI Tool
Once your dashboard wireframe is ready, use the BI Tool Export feature to send it directly to Power BI or Tableau for further analysis and enhancements. You can also download the dashboard as a PDF, PNG, or JPEG, embed it on a platform, or invite your team to collaborate.
Note: This is a Pro template. You’ll need a Pro subscription on Mokkup to use and customize this dashboard wireframe. Upgrade anytime to unlock full access.
Investment Review Dashboard Example
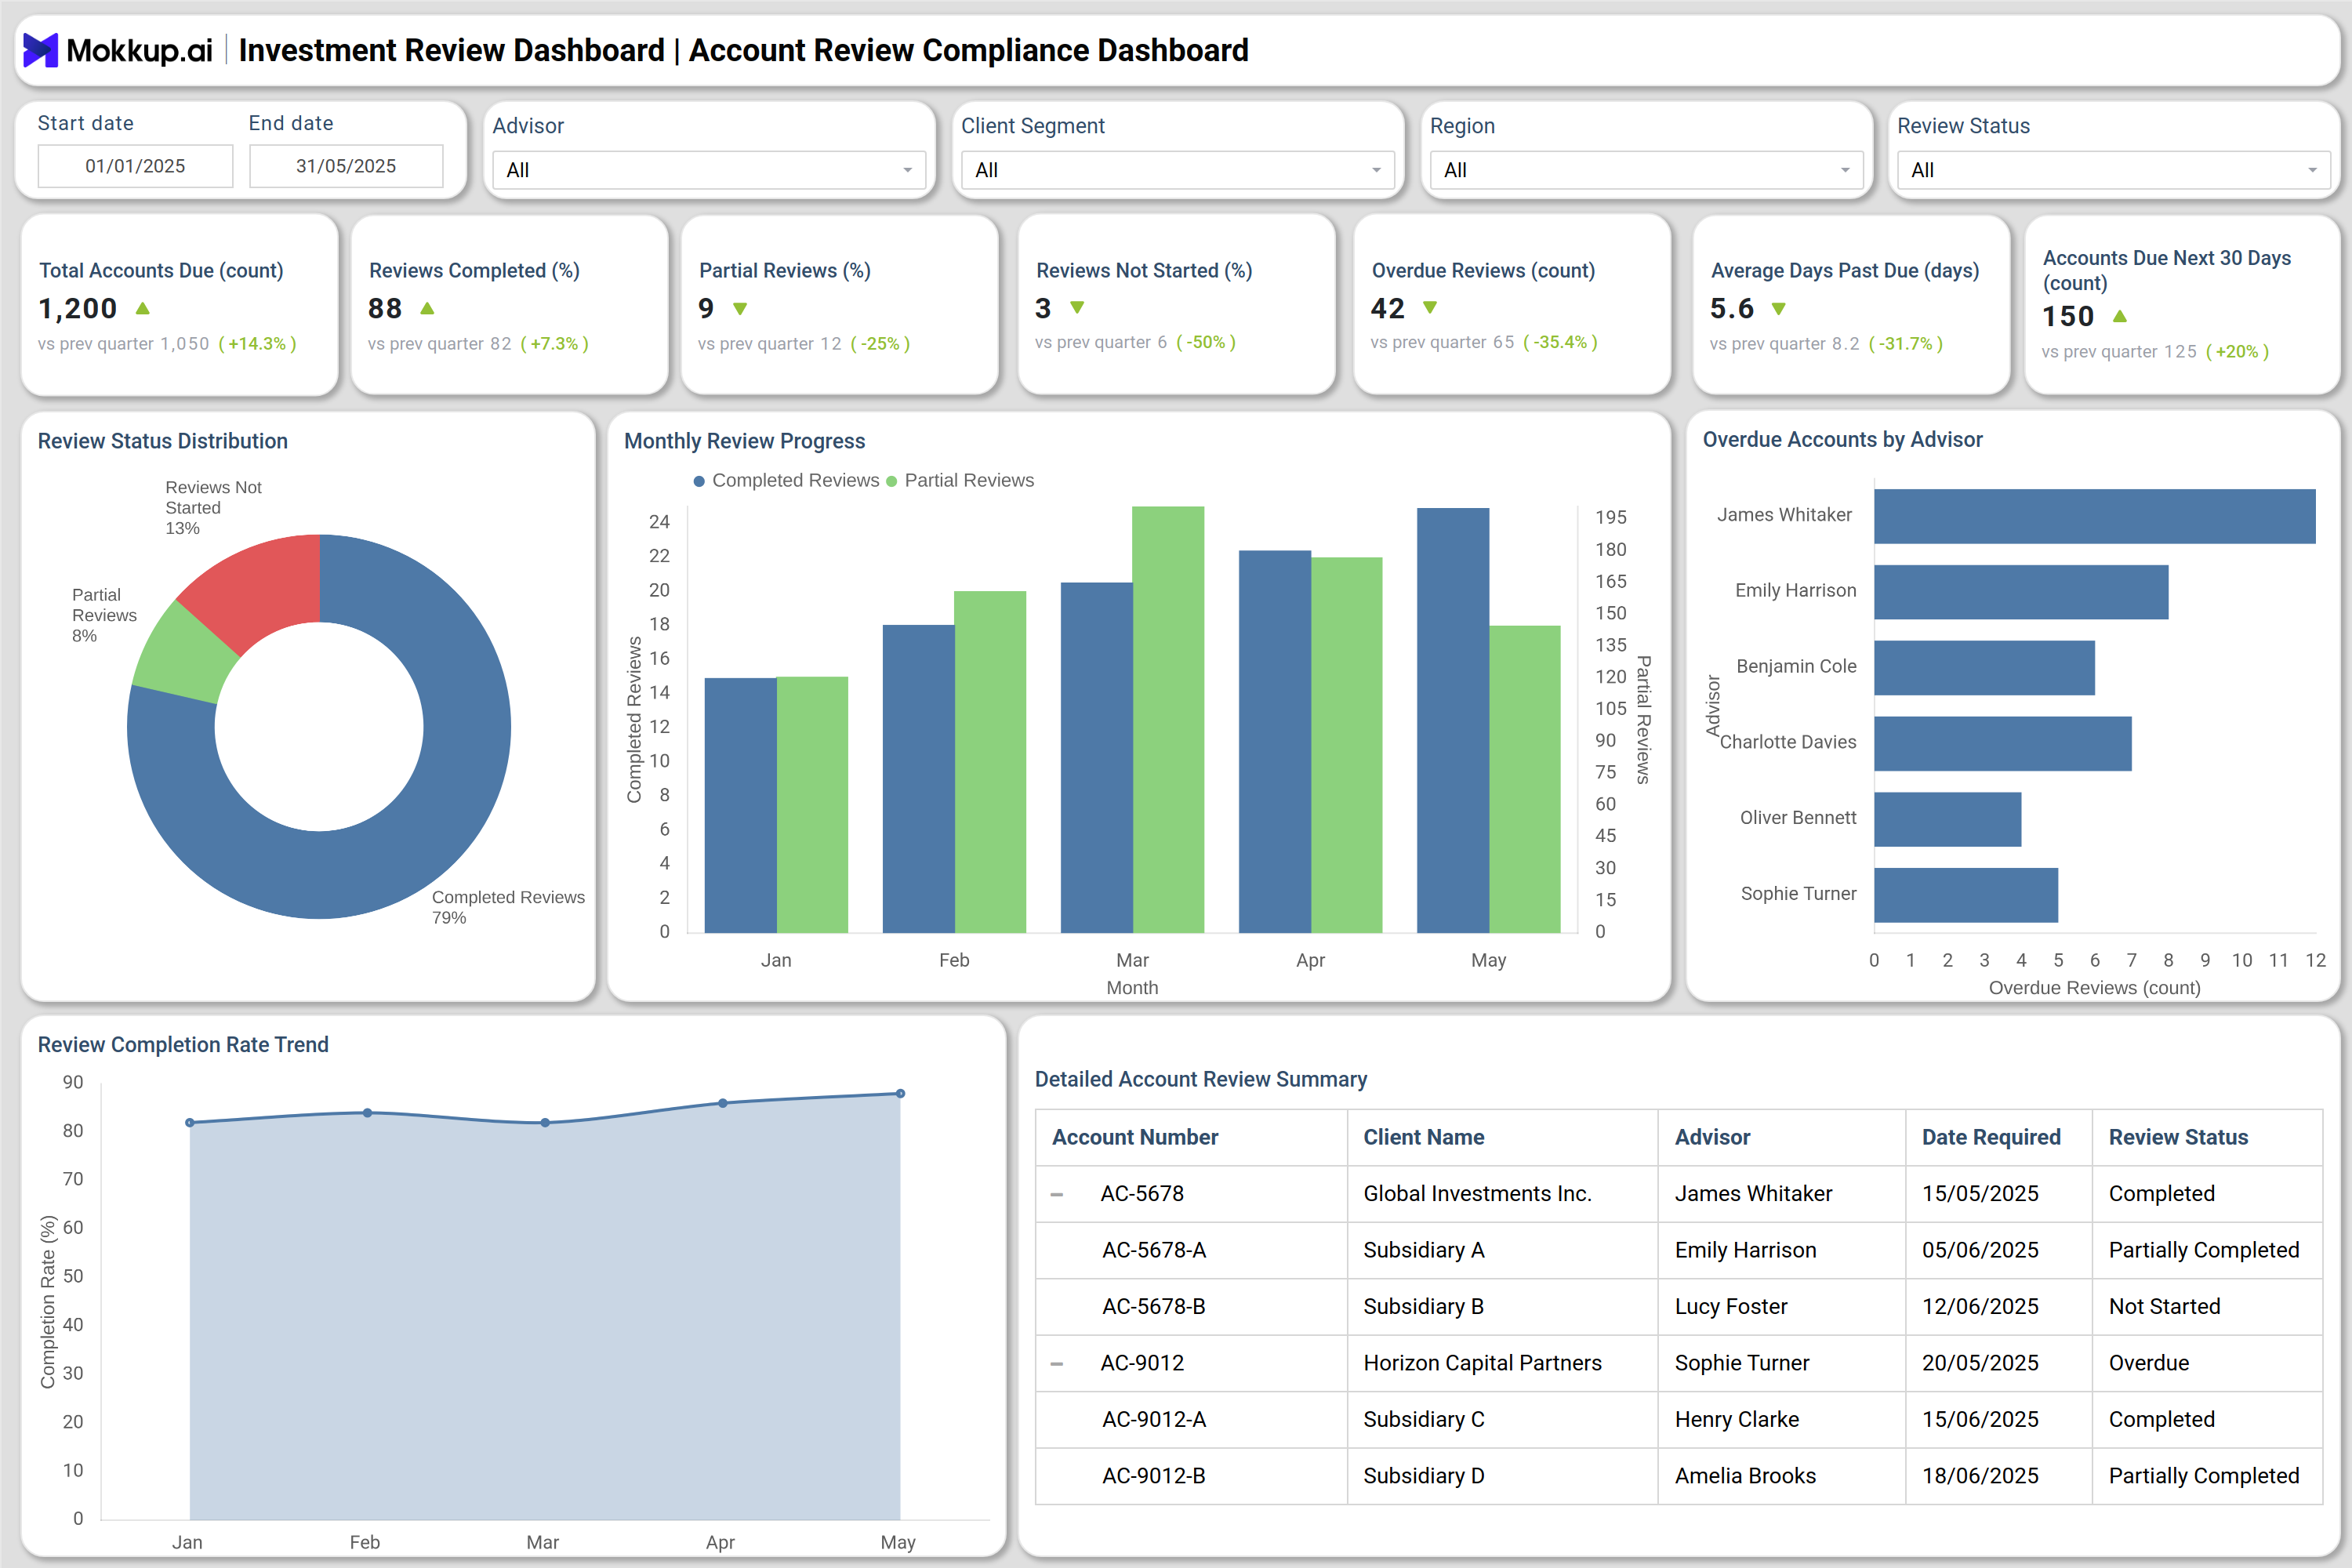
You can create your own Investment Review Dashboard to monitor investment review progress, advisor compliance, and completion rates across multiple client categories. The dashboard includes two main sections: Review Progress & Compliance Overview and Advisor Performance & Timeliness, each designed to provide detailed visibility into review metrics and deadlines. The first screen tracks overall review completion rates, overdue accounts, and pending reviews within specific time periods. Visual tools, such as donut charts and monthly trend columns, display completion breakdowns, while line charts show progress toward compliance targets. Advisors and compliance officers can easily identify bottlenecks, overdue accounts, and areas that require escalation. The second screen focuses on timeliness and advisor performance. It highlights on-time vs delayed reviews, completion delays, and compliance scores. The portfolio investment review tracking dashboard uses heat maps to reveal weekly performance patterns, bar charts for advisor-wise efficiency, and summary tables for detailed accountability tracking. Together, these screens form a robust investment review & reporting dashboard platform that enables data-driven decision-making, enhances productivity, and supports consistent regulatory compliance across teams.
How to Analyze Data in Investment Review Dashboard
Finance professionals can leverage the Investment Review Dashboard template by:
- Track Review Completion Status: Monitor overall review completion rates by category — completed, partially completed, and not started — to assess workflow progress.
- Identify Overdue Accounts: Review lists of overdue accounts by advisor or branch to address compliance risks early.
- Measure Completion Trends: Use monthly or weekly trend lines to identify patterns in completion rate performance.
- Assess Advisor Efficiency: Compare advisor completion rates and compliance scores to identify top performers and underperforming teams.
- Evaluate Timeliness: Analyze on-time vs delayed completion rates and measure median review delays to ensure adherence to regulatory timelines.
- Monitor Client Segment Coverage: Review which client types (Retail, HNI, Corporate, Institutional) have completed reviews and which require attention.
- Spot Compliance Hotspots: Use heat maps to visualize advisors or branches with high overdue rates or low compliance percentages.
- Drill into Account Details: Use tables to view client names, assigned advisors, due dates, and days past due for granular analysis and follow-up.
Benefits of Investment Review Dashboard
These are the benefits of using the Investment Review Dashboards:
- Centralized Compliance Oversight: Consolidate all review progress, completion rates, and overdue accounts into one unified analytics tool for better visibility.
- Improved Advisor Accountability: Track individual advisor performance metrics, completion rates, and on-time compliance percentages.
- Enhanced Regulatory Readiness: Ensure investment reviews meet compliance deadlines and standards, reducing the risk of penalties or audits.
- Operational Efficiency: Automate review tracking and reduce manual monitoring by using a portfolio review and investment analytics dashboard.
- Data-Driven Insights: Enable compliance officers and leadership teams to make informed decisions with interactive data visualizations.
- Timeliness and Productivity Tracking: Monitor delays and average completion times to improve workflow planning and resource allocation.
- Client Segment Performance Analysis: Identify which client categories exhibit the highest review completion and engagement rates.
- Reduced Backlogs and Risks: Identify overdue accounts and non-compliant reviews quickly to minimize operational and regulatory risks.
- Continuous Improvement: Compare historical and current data to identify long-term efficiency trends and opportunities for process improvement.
KPIs to Track in Investment Review Dashboard
The key KPIs in Investment Review Dashboard include:
- Total Accounts Due for Review: Tracks the total number of investment accounts scheduled for compliance review within a defined period.
- Reviews Completed (%): Measures how many reviews have been successfully completed, compared to total assigned.
- Reviews Partially Completed (%): Shows in-progress reviews requiring additional documentation or validation.
- Reviews Not Started (%): Identifies accounts where review activity hasn’t begun.
- Overdue Reviews (#): Monitors how many accounts have exceeded their review due date.
- Average Days Past Due: Indicates how far overdue reviews have extended beyond the target deadline.
- Accounts Due Next 30 Days: Forecasts upcoming review workload to assist in resource planning.
- On-Time Completion Rate (%): Measures the percentage of reviews completed before or by their deadlines.
Frequently Asked Questions
Q1. What is the purpose of an Investment Review Dashboard?
The dashboard helps financial institutions manage, track, and analyze investment account review progress, compliance, and advisor performance.
Q2. Who uses an Investment Review Dashboard?
Wealth managers, compliance teams, and financial advisors use the dashboard to monitor review timelines and ensure adherence to standards.
Q3. Can it be customized for different client segments?
Yes, filters allow users to view data by client type, region, or relationship manager for tailored insights.