
What is an Oil-Fired Power Plant Quality Control Dashboard?
An Oil-Fired Power Plant Quality Control Dashboard template is a centralized visual platform designed to monitor and track the key performance indicators (KPIs) related to the quality of fuel oil and the efficiency of the combustion process. It consolidates data on fuel properties, such as calorific value and sulfur content, as well as operational metrics like combustion efficiency and compliance rates, into a single, easy-to-understand interface.
By integrating fuel oil quality tracking for power plants, oil combustion efficiency analysis, and emissions compliance monitoring for thermal plants, the dashboard wireframe helps operators ensure fuel specifications are met, optimize boiler performance, maintain regulatory compliance, and reduce operational costs. It serves as an essential tool for analyzing fuel test results, monitoring emission parameters, and identifying trends that impact plant reliability and environmental performance.
How to Create an Oil-Fired Power Plant Quality Control Dashboard
You don’t need to build your report from scratch, just start with a ready-to-use Oil-Fired Power Plant Quality Control dashboard template from Mokkup. Add in your data and export it however you like. Here’s how to do it:
1. Create or Log in to Your Mokkup Account
Start by signing up on Mokkup.ai using your email. If you already have an account, just log in, and you’ll be good to go.
2. Choose and Customize Your Dashboard Template
Find the Oil-Fired Power Plant Quality Control dashboard template in the Templates section. Use the drag-and-drop editor to adjust KPIs, edit filters, or add elements based on your data.
3. Export to Your BI Tool
Once your dashboard wireframe is ready, use the BI Tool Export feature to send it directly to Power BI or Tableau for further analysis and enhancements. You can also download the dashboard as a PDF, PNG, or JPEG, embed it on a platform, or invite your team to collaborate.
Note: This is a Pro template. You’ll need a Pro subscription on Mokkup to use and customize this dashboard wireframe. Upgrade anytime to unlock full access.
Oil-Fired Power Plant Quality Control Dashboard Example
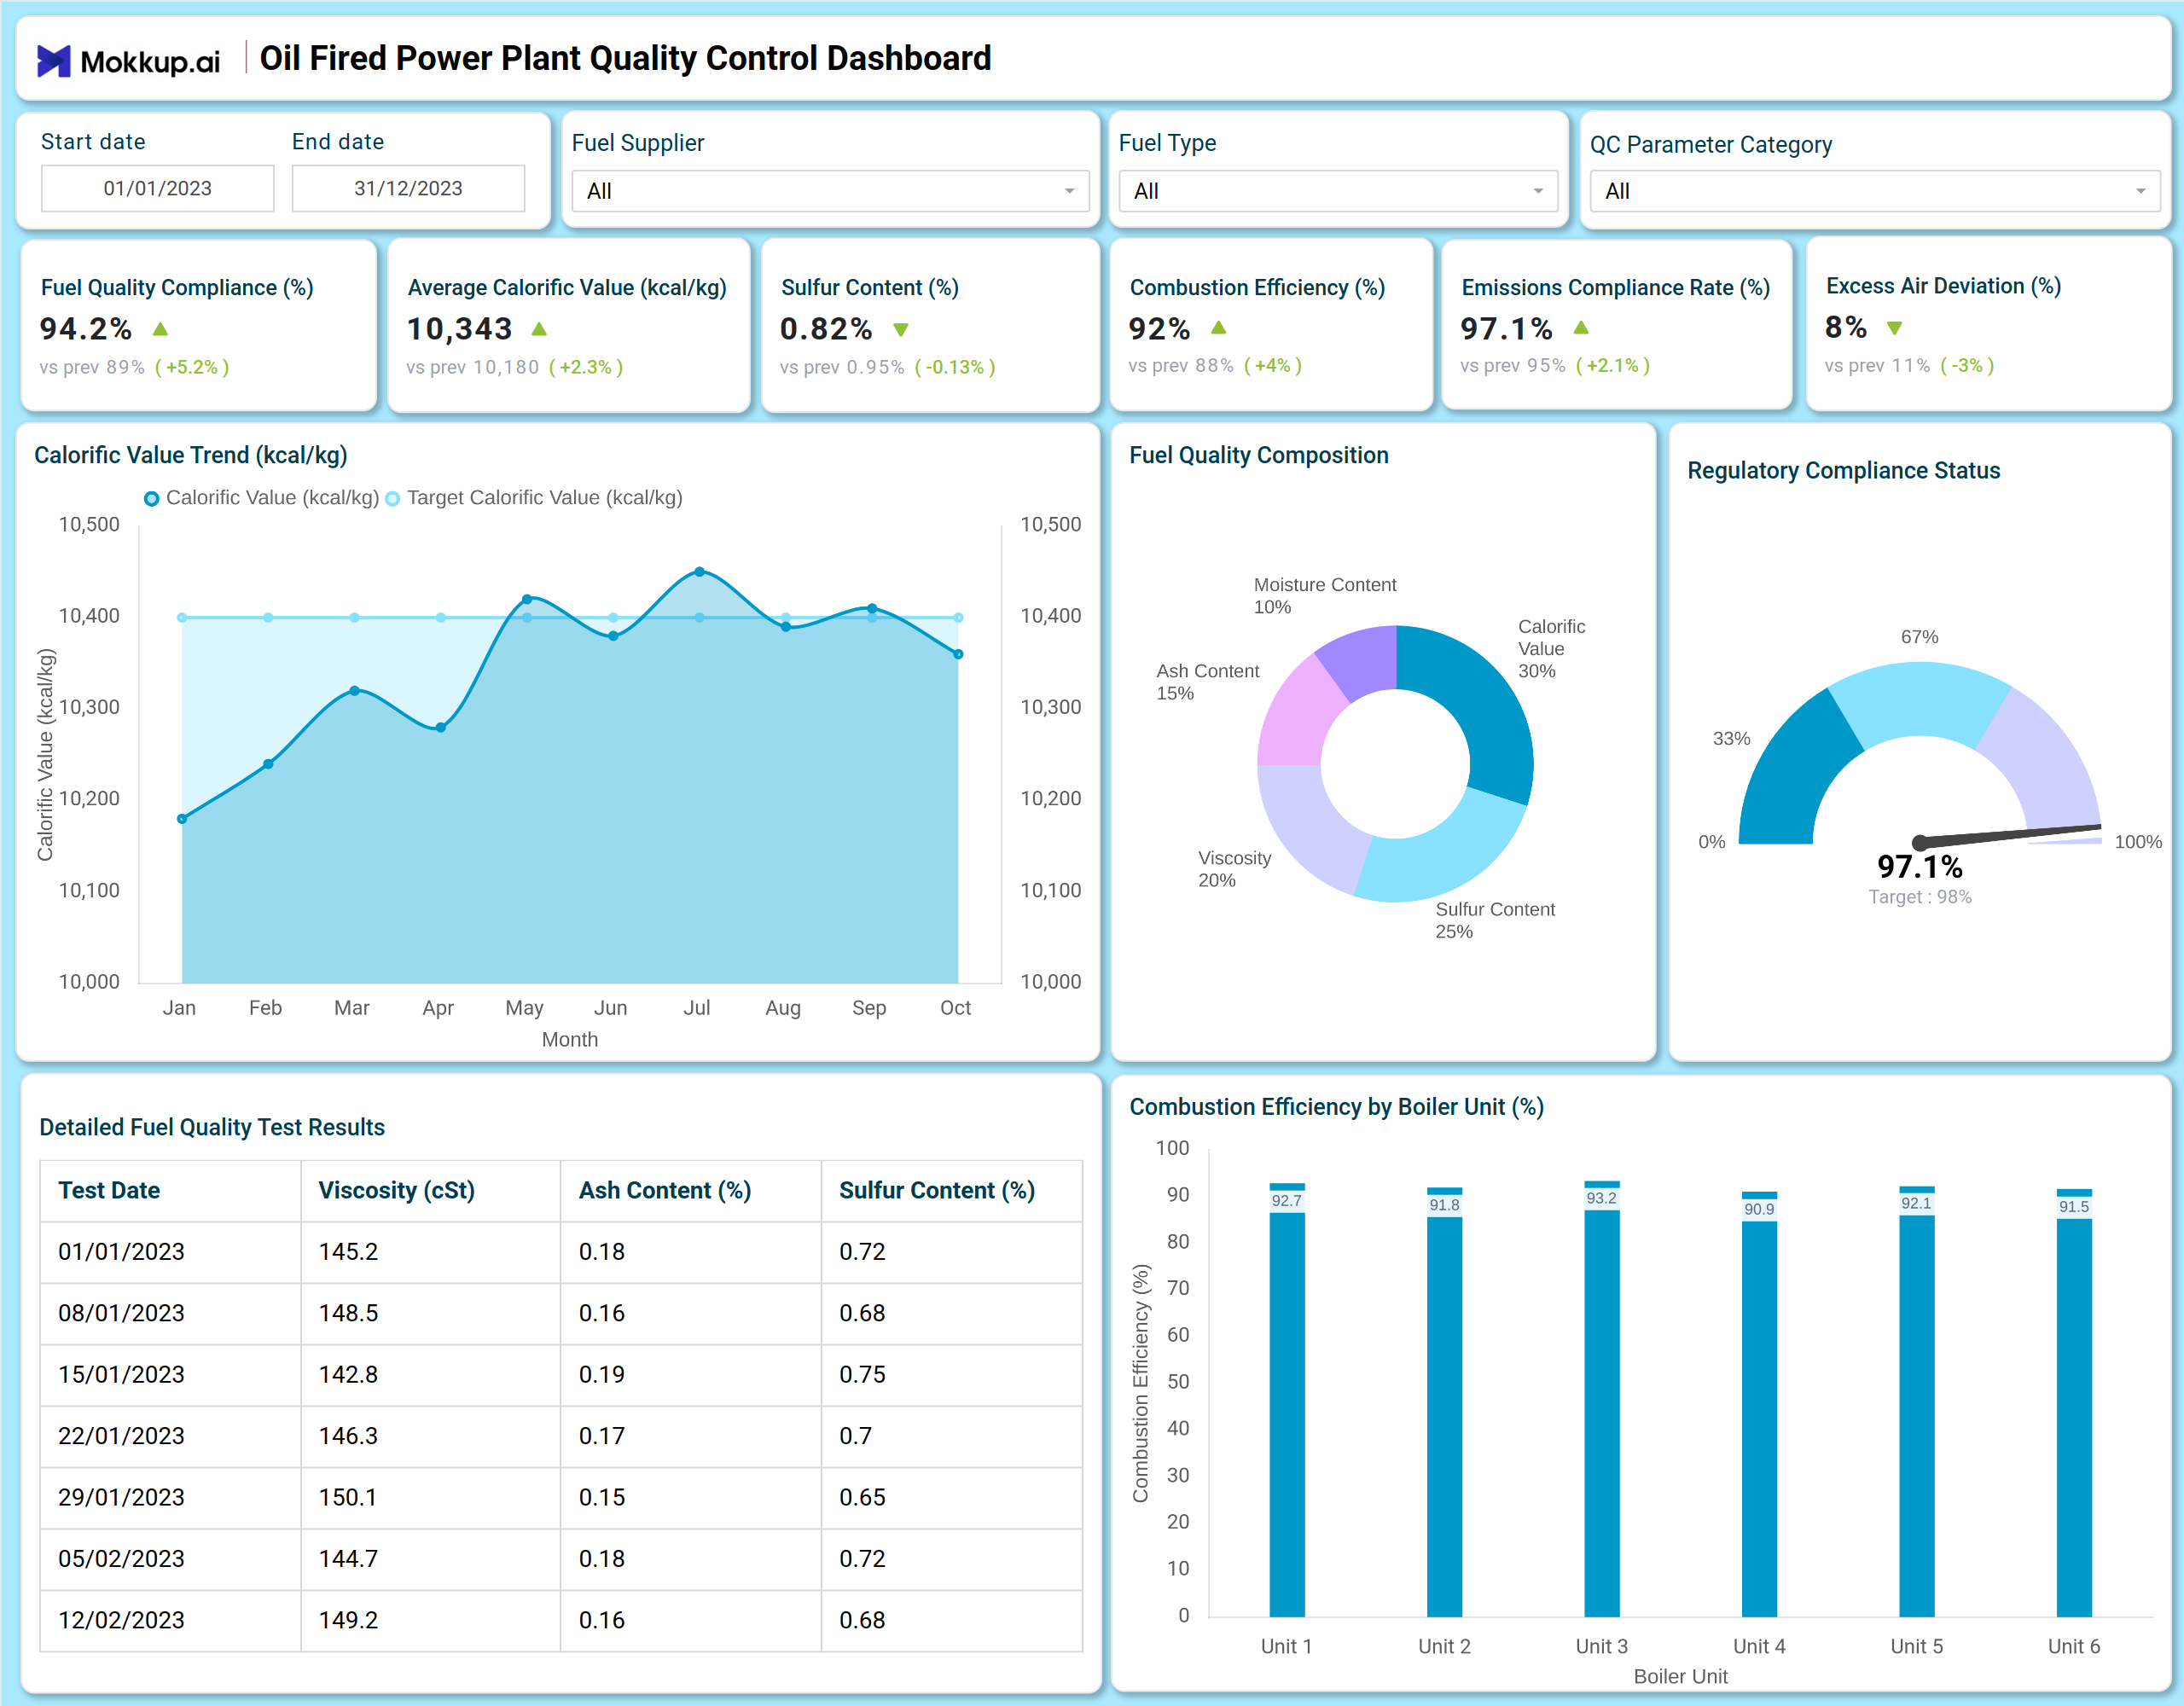
You can create an Oil-Fired Power Plant Quality Control Dashboard that brings together fuel quality, combustion performance, and emissions compliance into a unified view. A typical dashboard includes a Fuel Quality & Compliance section, where users can track overall Fuel Quality Compliance, Average Calorific Value, and Sulfur Content. Visual charts help analyze the Calorific Value Trend over time, understand the Total Quality Composition of tested parameters, and review a detailed table of Fuel Quality Test Results with viscosity and ash content.
The Combustion & Emissions Analysis dashboard builds on this by displaying Combustion Efficiency, Emissions Compliance Rate, and Excess Air Deviation. A bar chart illustrates Combustion Efficiency by Boiler Unit, enabling performance comparison across the plant. Together, these modules deliver crucial oil power plant performance metrics and fuel oil QC parameter analysis, helping operators ensure efficient energy production, maintain compliance with environmental standards, and uphold strong thermal plant quality assurance protocols.
How to Analyze Data in Oil-Fired Power Plant Quality Control Dashboard
Here is how you can analyze data from this dashboard:
- Monitor Fuel Quality Compliance (%): Ensure incoming fuel meets contractual and operational specifications.
- Track the Average Calorific Value (kcal/kg): Assess the energy content of the fuel, which directly impacts generation efficiency and cost.
- Analyze the Sulfur Content (%): Manage corrosion risks, ash handling, and ensure compliance with emissions regulations.
- Review the Combustion Efficiency (%): Evaluate how effectively the fuel is being converted into useful energy in the boilers.
- Assess the Emissions Compliance Rate (%): Gauge the plant's adherence to environmental standards for released gases.
- Scrutinize the Excess Air Deviation (%): Optimize the air-to-fuel ratio, which influences efficiency and emissions.
- Examine the Calorific Value Trend Over Time: Identify patterns or shifts in fuel quality that may require supplier intervention.
- Study the Detailed Fuel Quality Test Results: for viscosity and ash content to predict and prevent potential operational issues like slagging or fouling.
- Compare Combustion Efficiency by Boiler Unit (%): Identify underperforming units for targeted maintenance or tuning.
Benefits of Oil-Fired Power Plant Quality Control Dashboard
The following are the benefits of using this dashboard:
- Centralized Fuel Insights: Provides a unified view of fuel quality and combustion performance metrics.
- Transparent Compliance Monitoring: Supports emissions compliance tracking for thermal plants with ease.
- Improved Decision-Making: Offers clear insights into how fuel properties impact operations.
- Enhanced Operational Efficiency: Enables optimization through detailed combustion efficiency analysis.
- Reduced Operational Risks: Identifies sub-standard fuel or declining performance early.
- Stronger Supplier Management: Facilitates data-driven evaluation of fuel oil quality.
- Streamlined Reporting: Consolidates key oil power plant performance metrics for faster reporting.
- Audit Preparedness: Maintains organized records of quality tests and compliance status.
KPIs to Track in Oil-Fired Power Plant Quality Control Dashboard
The following key KPIs can be tracked by using this dashboard:
- Fuel Quality Compliance (%): The percentage of fuel batches that meet all specified quality parameters.
- Average Calorific Value (kcal/kg): The average energy content per unit mass of the fuel oil, indicating its power generation potential.
- Sulfur Content (%): The percentage of sulfur in the fuel, which affects emissions and equipment corrosion.
- Combustion Efficiency (%): The effectiveness of the boiler in converting fuel into heat energy.
- Emissions Compliance Rate (%): The rate at which plant emissions adhere to regulatory limits.
- Excess Air Deviation (%): The deviation from the ideal amount of air supplied for combustion, impacting efficiency and NOx formation.
- Viscosity (cSt): A measure of the fuel's resistance to flow, affecting atomization and combustion.
- Ash Content (%): The amount of inorganic residue left after fuel combustion, which can cause slagging and fouling.
Frequently Asked Questions
Q1. What is the purpose of an oil power plant quality control dashboard?
It helps monitor the quality of incoming fuel oil, track combustion efficiency, and ensure compliance with emissions regulations to optimize plant performance and reliability.
Q2. Can the dashboard help with supplier evaluation?
Yes. Tracking fuel quality parameters like calorific value and sulfur content over time provides data to assess and manage fuel supplier performance.
Q3. How does the dashboard improve plant efficiency?
It provides insights into combustion efficiency and excess air levels, allowing operators to tune boiler operations for optimal performance.
Q4. Does it track environmental compliance?
Yes. It monitors key indicators like the Emissions Compliance Rate and Sulfur Content to help ensure the plant meets environmental standards.
Q5. Who uses this dashboard?
Plant managers, operations supervisors, fuel procurement managers, quality control engineers, and environmental compliance officers.