
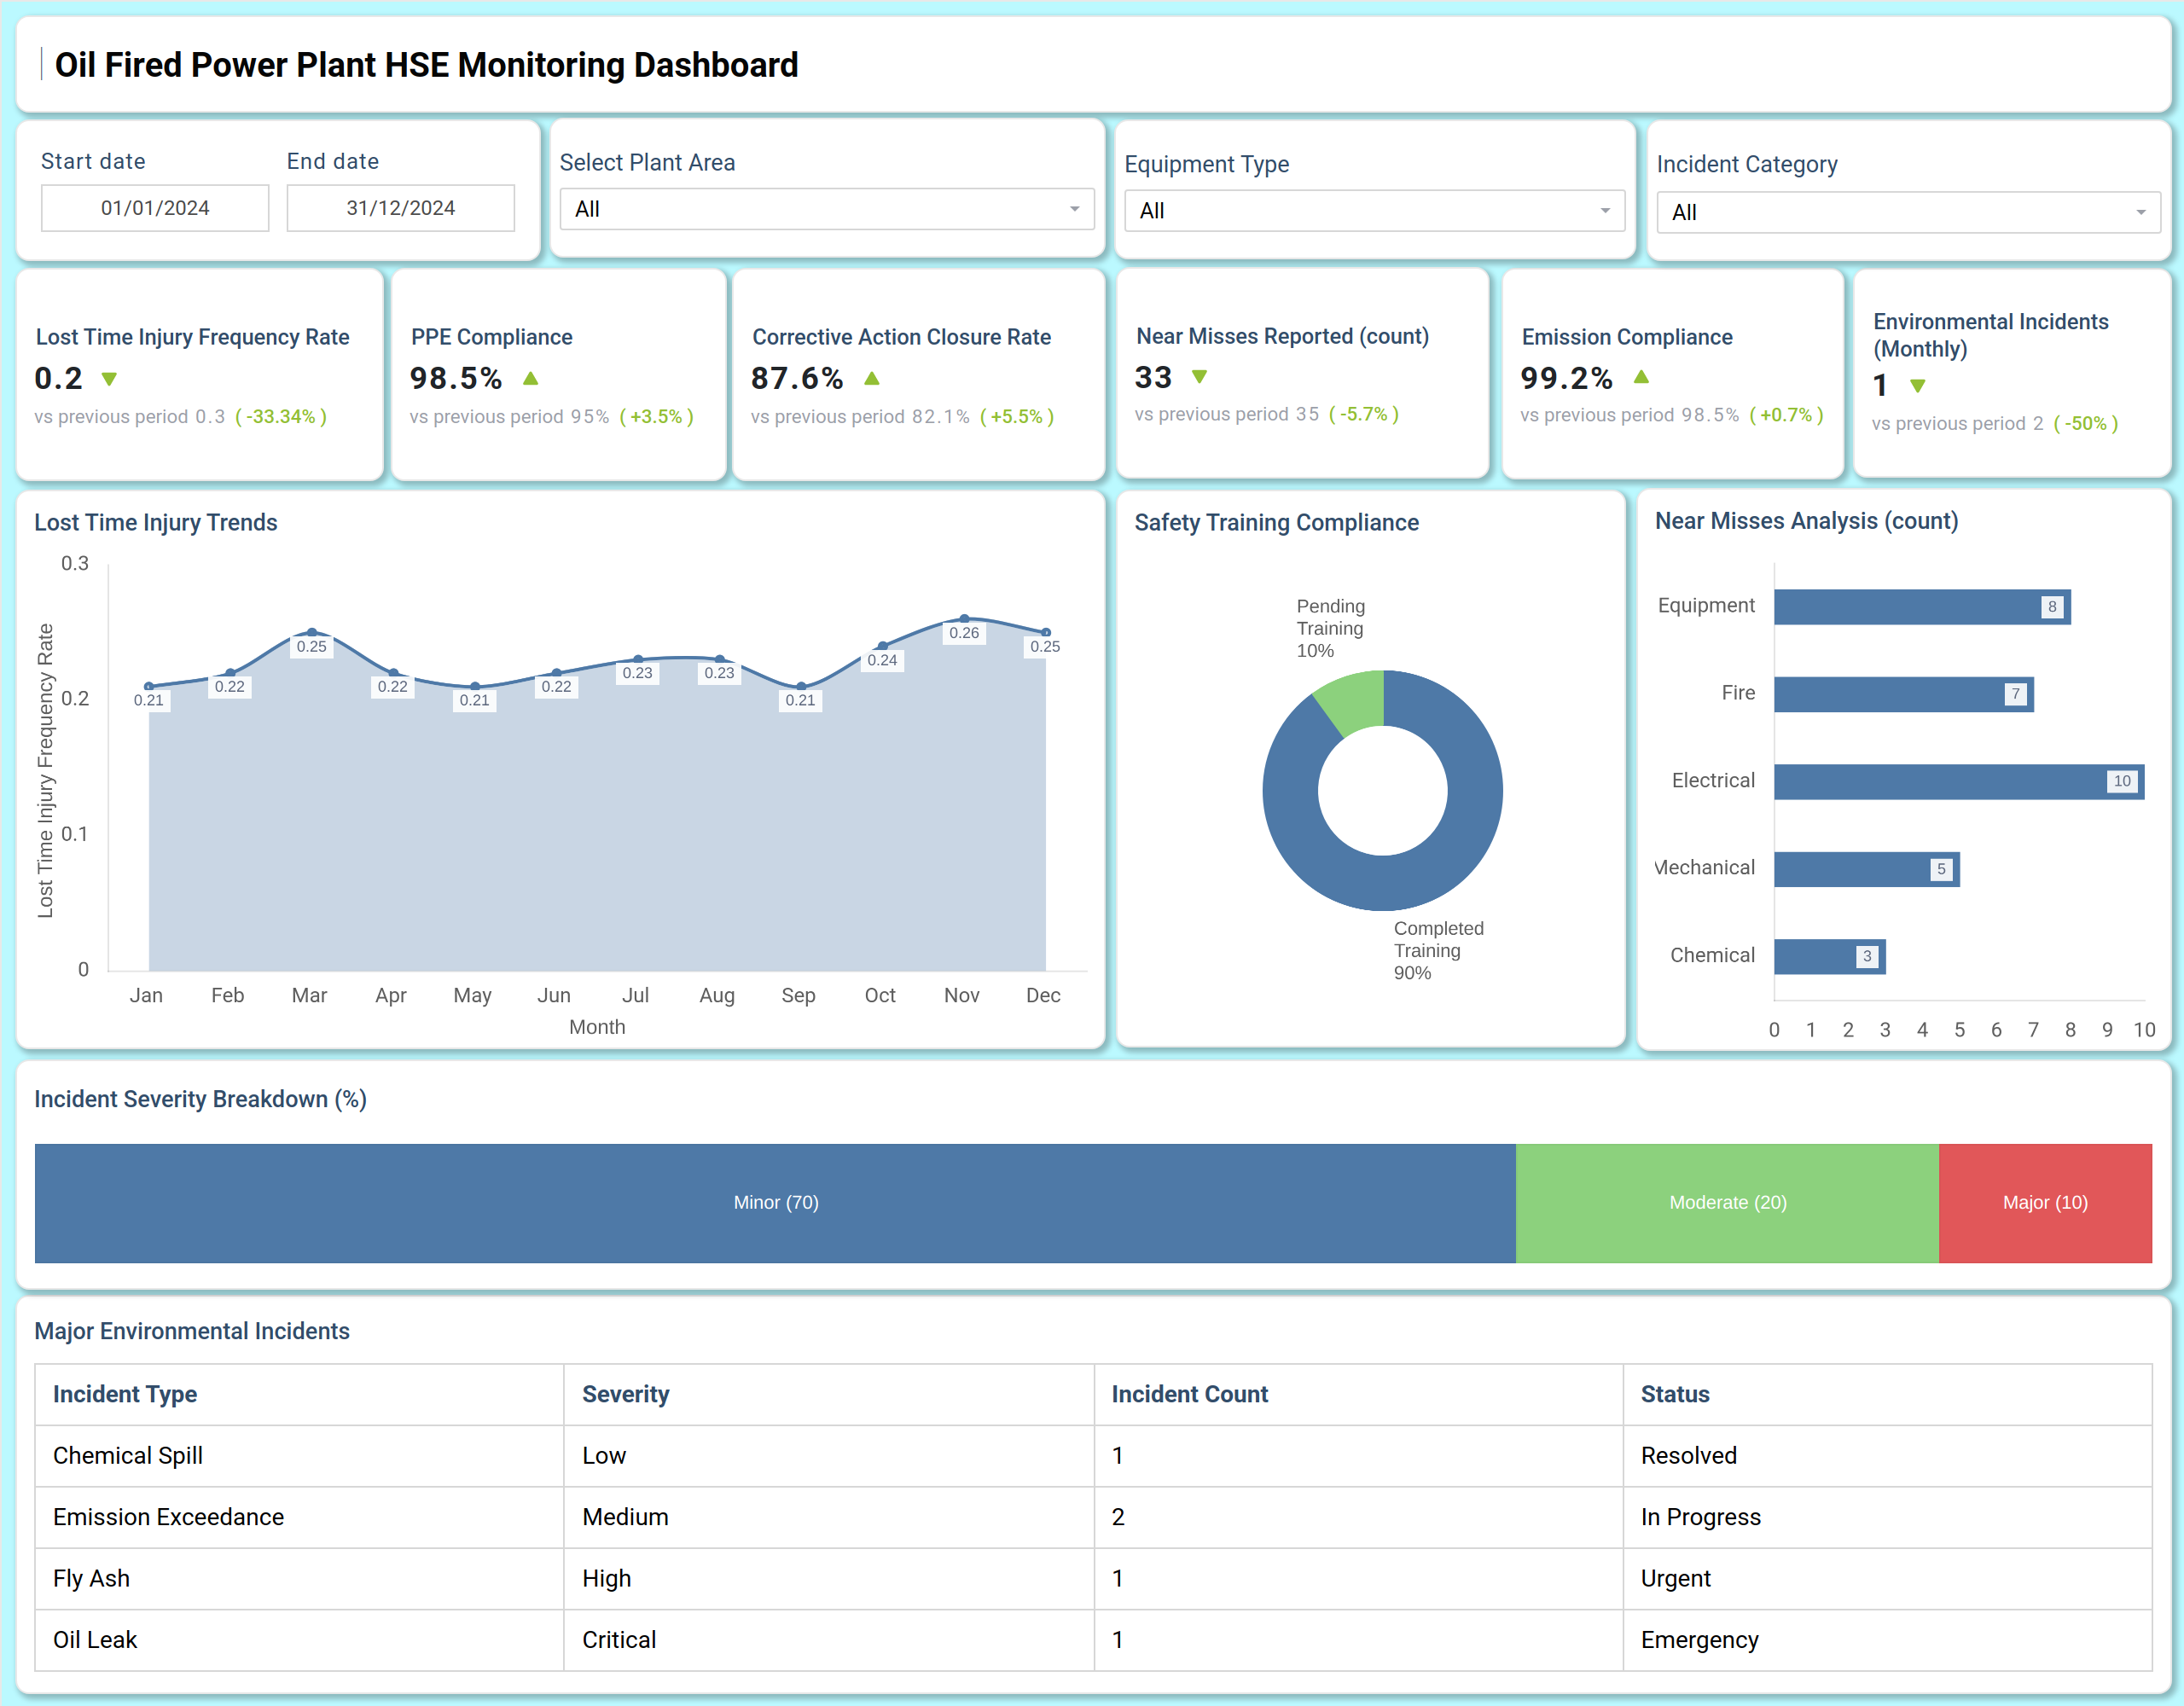
What is an Oil-Fired Power Plant HSE Monitoring Dashboard?
An Oil-Fired Power Plant HSE Monitoring Dashboard template is a centralized visual tool designed to track and manage Health, Safety, and Environmental performance within an oil-fired power generation facility. It consolidates key metrics related to personnel safety, incident reporting, environmental compliance, and corrective actions into a single, accessible platform.
By integrating oil power plant safety performance tracking, HSE compliance monitoring for power plants, and oil-fired facility incident analytics, the dashboard wireframe enables safety managers and plant operators to proactively identify risks, ensure regulatory adherence, and foster a culture of continuous safety improvement. It serves as an essential tool for monitoring trends, evaluating the effectiveness of safety programs, and driving strategic decisions to protect personnel, assets, and the environment.
How to Create an Oil-Fired Power Plant HSE Monitoring Dashboard
You don’t need to build your report from scratch—just start with a ready-to-use sample Oil-Fired Power Plant HSE Monitoring Dashboard template from Mokkup. Plug in your own data and export it however you like. Here’s how to do it:
1. Create or Log in to Your Mokkup Account
Start by signing up on Mokkup.ai using your email. If you already have an account, just log in, and you’ll be good to go.
2. Choose and Customize Your Dashboard Template
Find the Oil-Fired Power Plant HSE Monitoring dashboard template in the Templates section. Use the drag-and-drop editor to adjust KPIs, edit filters, or add elements based on your data.
3. Export to Your BI Tool
Once your dashboard wireframe is ready, use the BI Tool Export feature to send it directly to Power BI or Tableau for further analysis and enhancements. You can also download the dashboard as a PDF, PNG, or JPEG, embed it on a platform, or invite your team to collaborate.
Note: This is a Pro template. You’ll need a Pro subscription on Mokkup to use and customize this dashboard wireframe. Upgrade anytime to unlock full access.
Oil-Fired Power Plant HSE Monitoring Dashboard Example
You can create an Oil-Fired Power Plant HSE Monitoring Dashboard that unifies safety performance and environmental stewardship metrics, providing a comprehensive view of both. A typical dashboard includes a Safety Performance Overview, where users can track the Lost Time Injury Frequency Rate (LTIFR), PPE Compliance, and the Corrective Action Closure Rate. Visual charts help monitor LTIFR trends over months, analyze the categories of Near Misses reported (such as Equipment, Fire, or Electrical), and break down incident severity into Minor, Moderate, and Major categories.
The Environmental & Incident Analysis section builds on this by displaying Emission Compliance percentages, the count of Environmental Incidents, and a detailed log of Major Environmental Incidents, including type, severity, count, and resolution status. This provides comprehensive HSE dashboard insights for oil power plants, enabling safety teams to monitor occupational health indicators in the energy sector and ensure robust environmental compliance.
How to Analyze Data in Oil-Fired Power Plant HSE Monitoring Dashboard
Here is how you can analyze data from this dashboard:
- Monitor LTIFR Trends: Track Lost Time Injury Frequency Rate to assess long-term safety performance.
- Track PPE Compliance: Measure adherence to essential protective equipment protocols.
- Review Corrective Action Closure Rate: Assess the speed at which identified safety issues are resolved.
- Analyze Near Misses Reported: Identify recurring hazards by reviewing near-miss categories such as Equipment or Fire.
- Assess Incident Severity Breakdown: Understand the ratio of minor, moderate, and major incidents to prioritize attention.
- Scrutinize Emission Compliance: Confirm alignment with environmental regulations and emission limits.
- Track Environmental Incidents: Monitor the count of incidents and review major event logs for resolution planning.
- Check Safety Training Compliance: Ensure all personnel have completed required HSE training to reduce risks.
Benefits of Oil-Fired Power Plant HSE Monitoring Dashboard
The following are the benefits of using this dashboard:
- Centralized HSE Visibility: Provides a unified view of health, safety, and environmental performance.
- Proactive Safety Management: Leverages oil-fired facility incident analytics to detect and prevent emerging risks.
- Improved Decision-Making: Offers clear visualizations of key occupational health indicators.
- Streamlined Compliance Tracking: Supports regulatory reporting and ongoing HSE compliance for power plants.
- Higher Operational Safety: Monitors PPE compliance and corrective action trends to strengthen worker safety.
- Enhanced Environmental Stewardship: Tracks emission compliance and environmental incident logs.
- Reduced Major Incident Risk: Uses near-miss and severity trend analysis to anticipate potential failures.
- Audit-Ready Transparency: Ensures visibility for internal audits and external regulatory inspections.
KPIs to Track in Oil-Fired Power Plant HSE Monitoring Dashboard
The following key KPIs can be tracked by using this dashboard:
- Lost Time Injury Frequency Rate (LTIFR): Measures the number of lost-time injuries per million hours worked, indicating overall workplace safety.
- PPE Compliance (%): Tracks the percentage of personnel correctly using required Personal Protective Equipment.
- Corrective Action Closure Rate (%): Shows the percentage of identified corrective actions that have been completed.
- Near Misses Reported (count): The number of unreleased incidents that had the potential to cause harm, indicating proactive safety reporting.
- Emission Compliance (%): The percentage of time plant emissions remain within permitted regulatory limits.
- Environmental Incidents (count): The total number of incidents with a negative environmental impact.
- Safety Training Compliance (%): The percentage of mandatory safety training sessions completed by personnel.
- Incident Severity Breakdown (%): The distribution of incidents by their severity level (Minor, Moderate, Major).
Frequently Asked Questions
Q1. What is the purpose of an oil-fired power plant HSE dashboard?
It helps monitor health, safety, and environmental performance, track incidents, and ensure compliance with regulatory standards.
Q2. Can the dashboard help in reducing workplace injuries?
Yes. Tracking LTIFR, near misses, and PPE compliance helps identify risk areas and implement preventive measures.
Q3. How does the dashboard support environmental management?
It tracks emission compliance and logs environmental incidents, providing crucial data for environmental performance reviews.
Q4. Does it track the status of safety corrective actions?
Yes. The Corrective Action Closure Rate KPI specifically monitors the progress of closing out safety actions.
Q5. Who uses this dashboard?
HSE managers, plant operations managers, safety officers, environmental compliance officers, and site supervisors.