What is an Oil Fired Power Plant Audit & Compliance Dashboard?
An Oil Fired Power Plant Audit & Compliance Dashboard is a strategic visual tool designed to monitor and manage the internal audit performance and regulatory compliance status of oil-fired power generation facilities. It consolidates critical data related to audit scores, finding closure rates, emission compliance, and permit adherence into a single, accessible platform. By integrating oil power plant audit tracking, compliance adherence monitoring for fossil fuels, and environmental regulation compliance for oil power, the dashboard empowers plant managers and compliance officers to proactively manage risks, demonstrate regulatory conformance, and drive operational excellence. It serves as a central hub for tracking audit finding trends, evaluating the effectiveness of corrective actions, and ensuring all environmental and operational permits are maintained.
How to Create an Oil Fired Power Plant Audit & Compliance Dashboard
You don’t need to start from scratch—simply use a pre-designed dashboard template from Mokkup. Input your data and export it in your preferred format. Here’s how:
1. Create or Log in to Your Mokkup Account
Start by signing up on Mokkup.ai using your email. If you already have an account, just log in, and you’ll be good to go.
2. Choose and Customize Your Dashboard Template
Find the Oil Fired Power Plant Audit & Compliance Dashboard template in the Templates section. Use the drag-and-drop editor to adjust KPIs, edit filters, or add elements based on your data.
3. Export to Your BI Tool
Once your dashboard wireframe is ready, use the BI Tool Export feature to send it directly to Power BI or Tableau for further analysis and enhancements. You can also download the dashboard as a PDF, PNG, or JPEG, embed it on a platform, or invite your team to collaborate.
Note: This is a Pro template. You’ll need a Pro subscription on Mokkup to use and customize this dashboard wireframe. Upgrade anytime to unlock full access.
Oil Fired Power Plant Audit & Compliance Dashboard Example
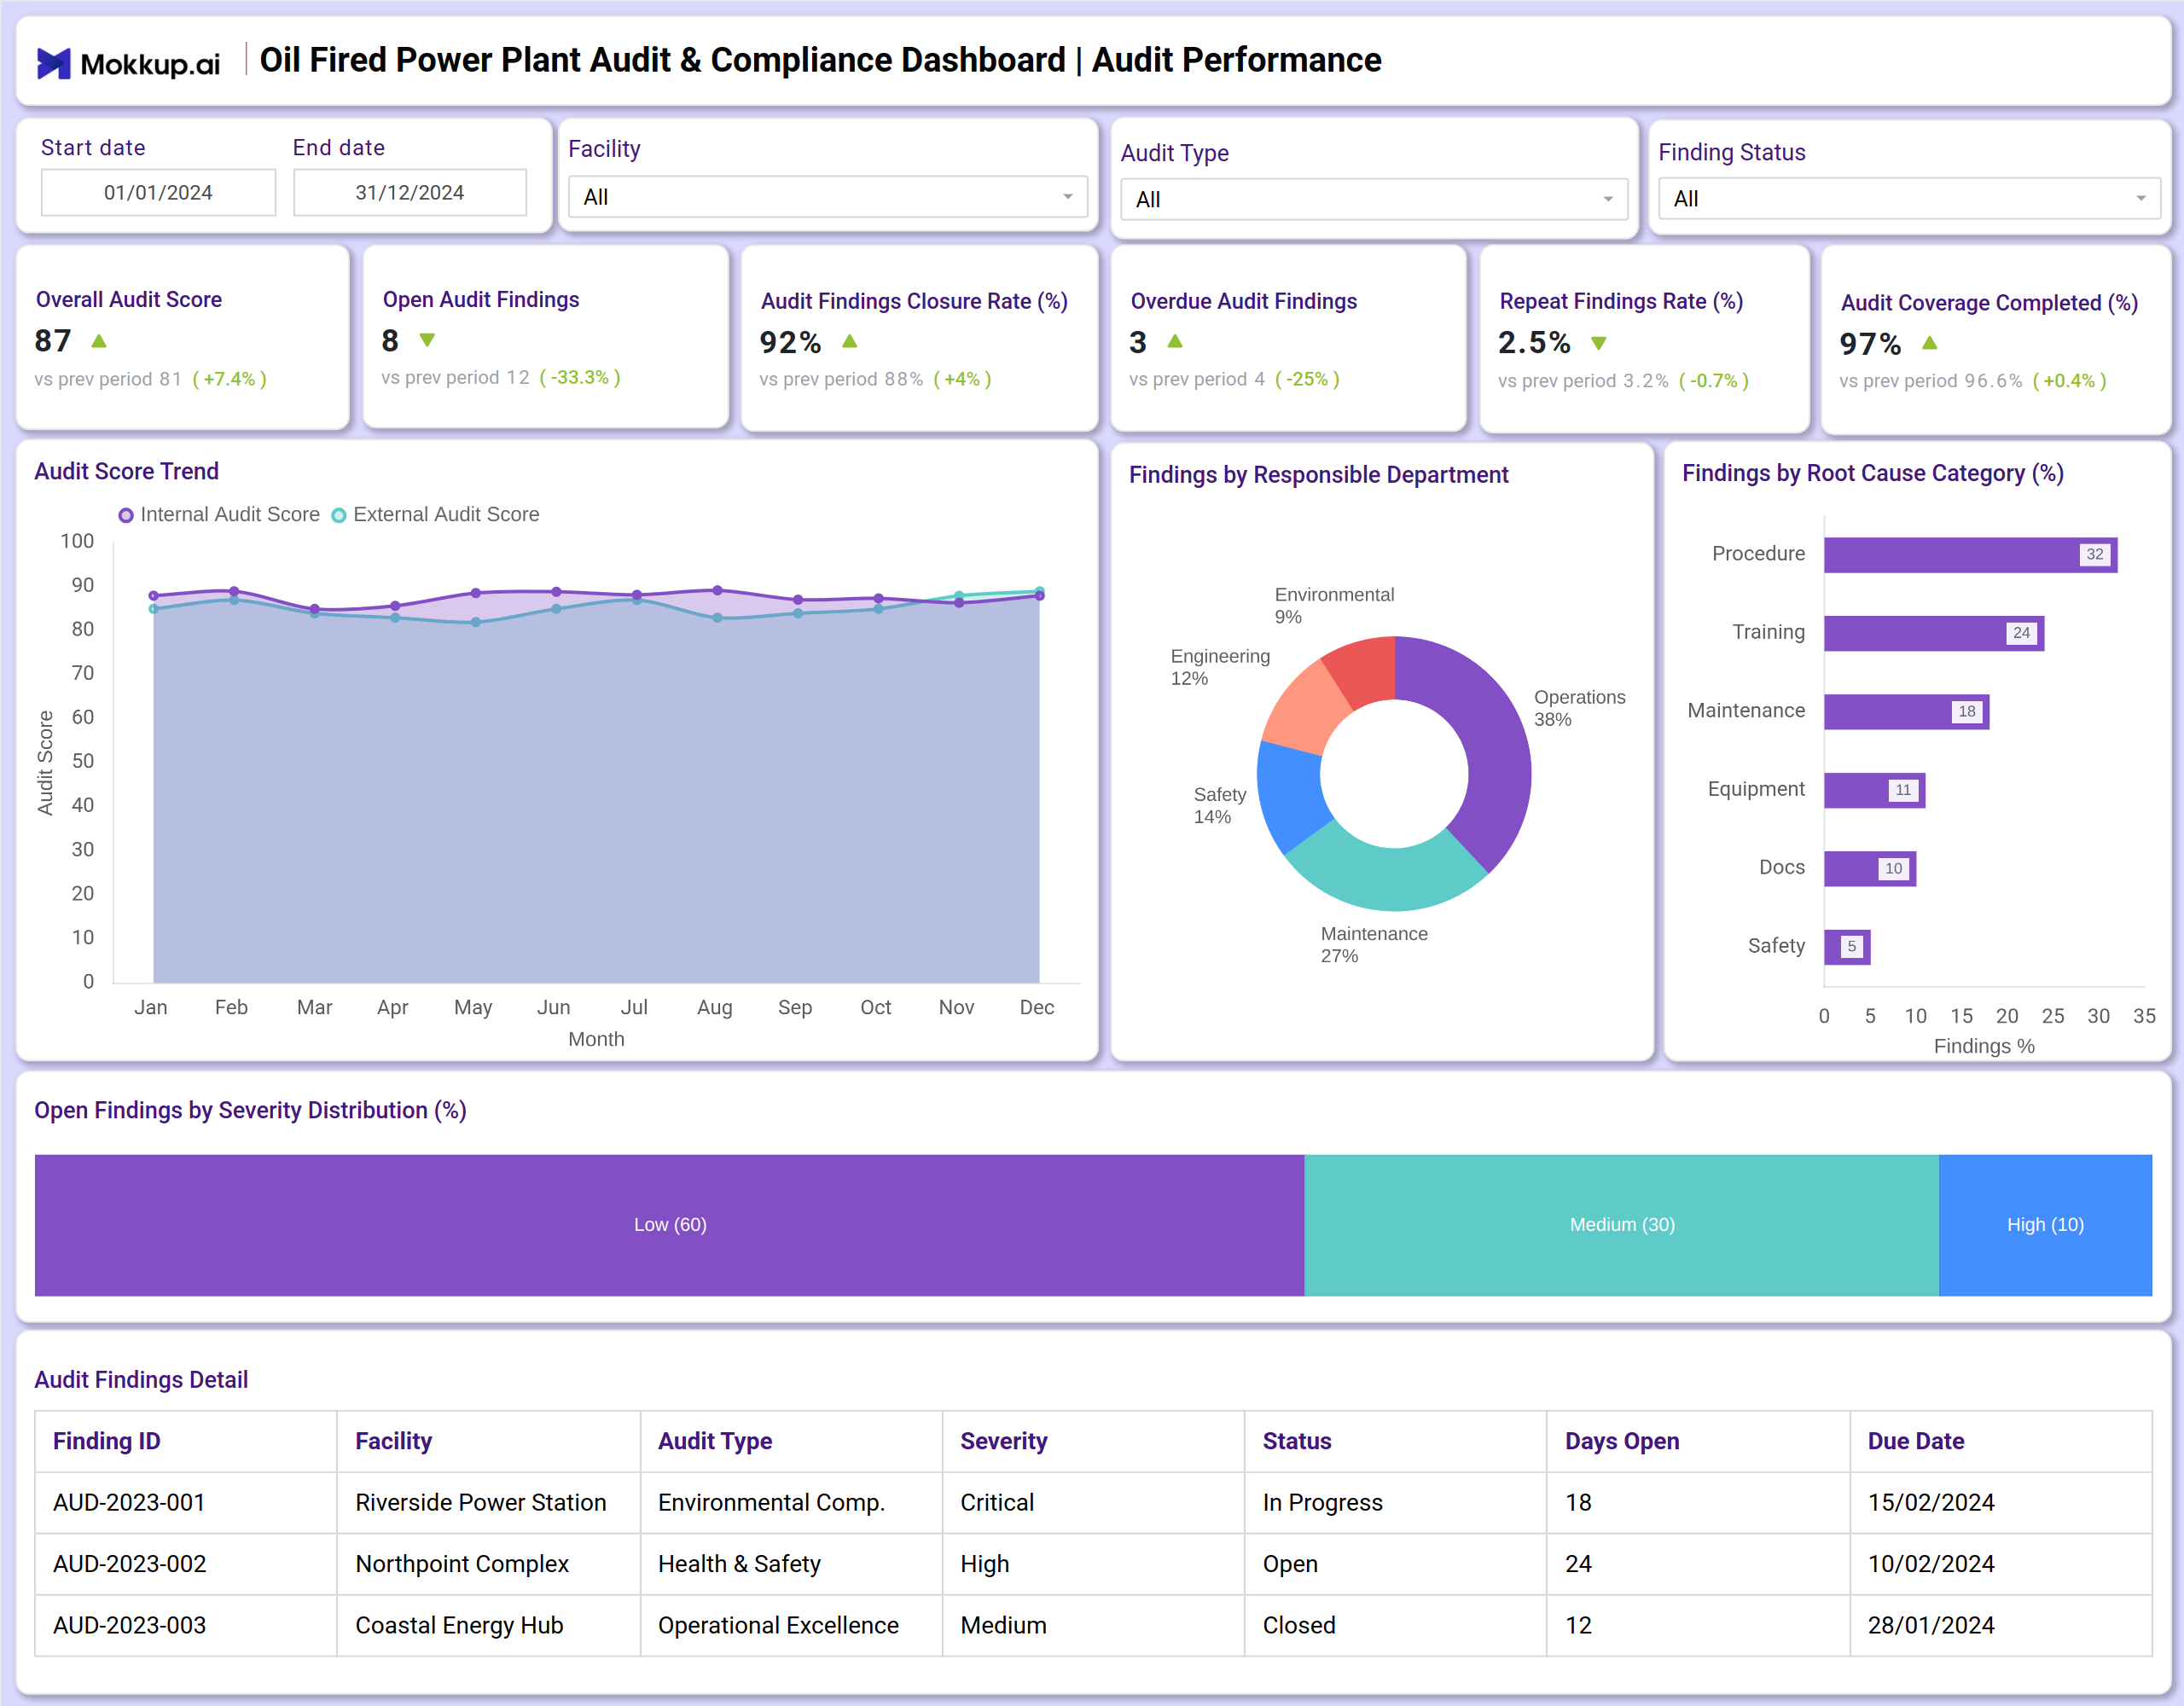
You can create an Oil Fired Power Plant Audit & Compliance Dashboard that brings together audit performance and compliance adherence into a unified view. A typical dashboard includes the Audit Performance section, where users can track the overall audit score, monitor open and overdue findings, and analyze trends by department and root cause. Visual charts help track the audit score over time and break down findings by categories, such as procedure or training. A detailed table logs each audit finding with its severity and status.
The Compliance Adherence dashboard builds on this by displaying emission compliance rates, stack test pass rates, and fuel quality compliance. A trend line visualizes emission compliance over the year, while charts break down emissions by pollutant and fuel type. A register of non-compliance events helps track incidents from permit excursions to environmental events. Together, these modules provide crucial insights into oil power plant compliance, assisting operators to ensure regulatory adherence, improve audit outcomes, and maintain operational integrity.
How to Analyze Data in Oil Fired Power Plant Audit & Compliance Dashboard
Here is how you can analyze data from this dashboard:
- Review the Overall Audit Score to gauge the plant's overall adherence to internal and external audit standards.
- Monitor Open Audit Findings and Closure Rate to track the efficiency of the corrective action process.
- Track the Repeat Findings Rate to assess the effectiveness of corrective actions in preventing recurring issues.
- Analyze Overdue Audit Findings to identify and prioritize corrective actions that are past their due date.
- Evaluate Audit Coverage Completed to ensure all planned audits have been executed as scheduled.
- Assess Findings by the Responsible Department and Root Cause to target improvement efforts where they are most needed.
- Monitor the Emission Compliance (%) to ensure stack emissions consistently meet regulatory permit limits.
- Track the Stack Test Pass Rate (%) to verify the accuracy and reliability of emission monitoring systems.
- Review Fuel Quality Compliance (%) to ensure fuel inputs meet specifications for efficient and compliant operation.
- Scrutinize Permit Excursions and Environmental Incidents to manage and learn from regulatory non-conformance events.
- Verify Compliance Documentation (%) to ensure all required environmental and operational records are complete and up to date.
Benefits of a Oil Fired Power Plant Audit & Compliance Dashboard
The following are the benefits of using this dashboard:
- Provides a centralized view of audit performance and environmental compliance status.
- Supports transparent compliance adherence monitoring for fossil fuels for internal reviews and regulatory reporting.
- Enhances risk management by highlighting high-severity findings and compliance excursions.
- Improves accountability by assigning findings to responsible departments and tracking due dates.
- Drives continuous operational improvement through oil power plant audit tracking and root cause analysis.
- Streamlines preparation for internal and external audits by maintaining organized records and identifying trends.
- Reduces the manual effort required to compile compliance and audit reports from disparate sources.
- Helps prevent fines and sanctions by ensuring compliance with environmental regulations for oil and power.
KPIs to Track in a Oil Fired Power Plant Audit & Compliance Dashboard
The following key KPIs can be tracked by using this dashboard:
- Overall Audit Score: A percentage score reflecting the plant's performance against audit criteria, indicating overall procedural health.
- Open Audit Findings: The number of audit findings that have not yet been closed shows the current workload of identified issues.
- Audit Findings Closure Rate (%): The percentage of findings closed against the total identified, measuring the efficiency of the corrective action process.
- Repeat Findings Rate (%): The percentage of findings that have recurred, indicating the effectiveness of root cause analysis and corrective actions.
- Audit Coverage Completed (%): The percentage of planned audits that have been completed, showing the execution of the audit schedule.
- Emission Compliance (%): The percentage of time that stack emissions are within permitted limits, a key measure of environmental regulatory adherence.
- Stack Test Pass Rate (%): The percentage of stack tests that meet regulatory standards, validating continuous emission monitoring system performance.
- Fuel Quality Compliance (%): The percentage of fuel deliveries that meet specified quality standards, crucial for efficient and compliant combustion.
- Permit Excursions (count): The number of times operational parameters exceeded permit conditions, tracking instances of non-compliance.
- Environmental Incidents (count): The number of reported events with a negative environmental impact, such as spills or unpermitted releases.
- Compliance Documentation (%): The percentage of required compliance documents that are complete and current, ensuring readiness for inspections.
Frequently Asked Questions
1. What is the purpose of an Oil Fired Power Plant Audit & Compliance Dashboard?
It helps plant operators and compliance teams monitor audit outcomes, track the status of findings, and ensure ongoing adherence to environmental regulations and operational permits.
2. Can the dashboard support regulatory inspections?
Yes. It consolidates key data on emission compliance, stack tests, audit findings, and incident logs that are essential for demonstrating compliance during regulatory inspections.
3. How does the dashboard improve operational performance?
It provides clear insights into audit trends and compliance metrics, enabling proactive management of issues, reducing repeat findings, and preventing compliance violations.
4. Does it track environmental performance?
Yes. It monitors critical environmental metrics like emission compliance rates, stack test results, and ecological incident counts.
5. Who uses this dashboard?
Plant managers, compliance officers, environmental health and safety (EHS) teams, internal auditors, and operations supervisors.