
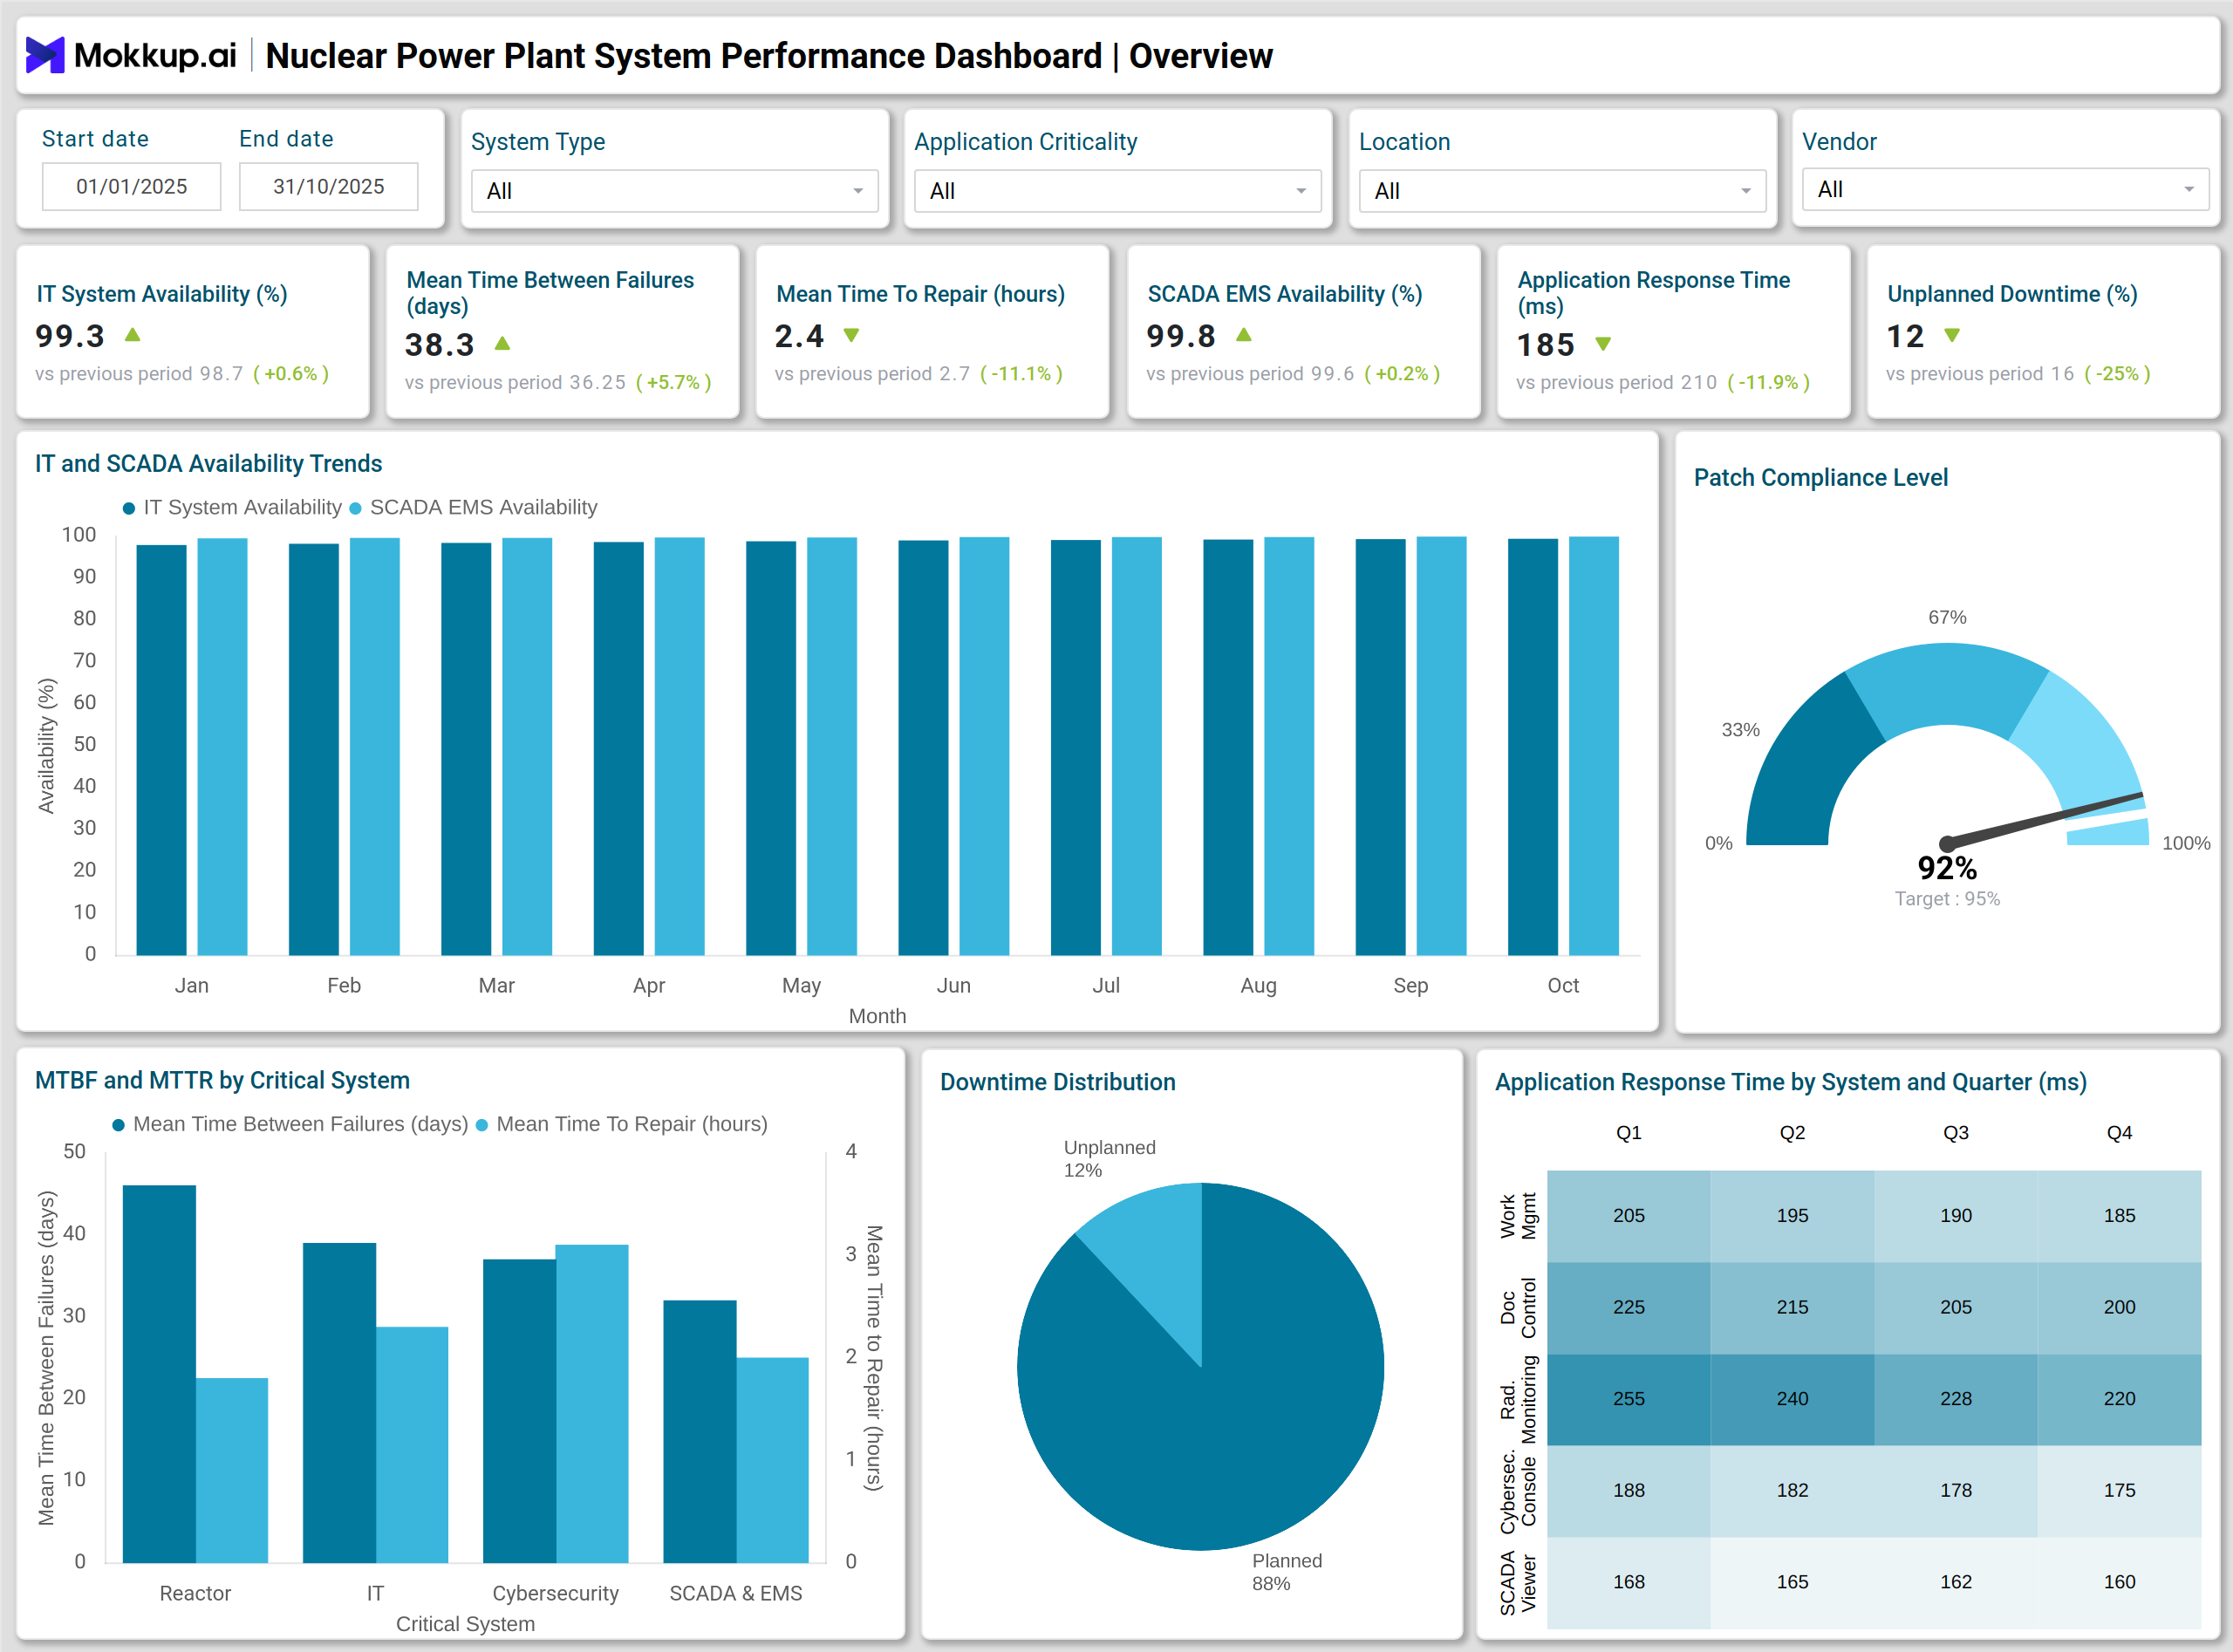
What is a Nuclear Power Plant System Performance Dashboard?
A Nuclear Power Plant System Performance Dashboard is a monitoring and assessment tool used by electric power utilities to evaluate the stability, reliability, and efficiency of core plant systems. It helps teams track operational health across IT, OT, SCADA, networking, applications, and cybersecurity workflows. The dashboard enables utilities to maintain strong system availability, improve maintenance planning, and identify performance issues before they affect generation continuity. It supports nuclear plant operational performance monitoring by offering structured insights into system behavior, incident patterns, and overall technology performance within nuclear power generation environments. This makes it a key component of a nuclear utility performance management platform. Because atomic operations rely on strict safety and reliability standards, the dashboard enables teams to maintain compliance while optimizing plant-wide performance.
How to Create a Nuclear Power Plant System Performance Dashboard
You don’t need to build your report from scratch—just start with a ready-to-use dashboard template from Mokkup. Add in your data and export it however you like. Here’s how to do it:
1. Create or Log in to Your Mokkup Account
Start by signing up on Mokkup.ai using your email. If you already have an account, just log in, and you’ll be good to go.
2. Choose and Customize Your Dashboard Template
Find the Nuclear Power Plant System Performance Dashboard template in the Templates section. Use the drag-and-drop editor to adjust KPIs, edit filters, or add elements based on your data.
3. Export to Your BI Tool
Once your dashboard wireframe is ready, use the BI Tool Export feature to send it directly to Power BI or Tableau for further analysis and enhancements. You can also download the dashboard as a PDF, PNG, or JPEG, embed it on a platform, or invite your team to collaborate.
Note: This is a Pro template. You’ll need a Pro subscription on Mokkup to use and customize this dashboard wireframe. Upgrade anytime to unlock full access.
Nuclear Power Plant System Performance Dashboard Example
A typical Nuclear Power Plant System Performance Dashboard provides an integrated view of operational health across critical infrastructure layers. The top section often highlights overall IT system availability, SCADA and EMS performance, and significant system alerts. Supporting visuals display application response patterns, MTBF, and MTTR values for high-priority equipment, as well as a breakdown of incident categories for both IT and OT systems. The dashboard also functions as a nuclear plant equipment performance monitoring dashboard, showing MTBF, MTTR, and alarm trends for critical assets.
A heatmap can help identify applications that may require optimization, while trend lines show how availability and performance evolve. A treemap helps illustrate how different plant systems utilize storage resources, and waterfall visuals explain what contributes most to incident resolution timelines. For utilities focused on nuclear power generation system performance analysis, this dashboard example provides a structured approach to evaluating performance drivers and maintaining operational readiness.
How to Analyze Data in Nuclear Power Plant System Performance Dashboards
Here is how you can analyze data from this dashboard:
- Identify availability patterns across IT and SCADA systems to understand how system stability affects nuclear generation workflows.
- Compare MTBF and MTTR trends to evaluate reliability performance and find systems with recurring failures.
- Analyze downtime distribution to determine the proportion of system unavailability resulting from planned versus unplanned outages.
- Monitor response time heatmaps to pinpoint systems that require optimization due to latency or processing delays.
- Track vulnerability trends to assess your security posture and determine if remediation efforts are improving over time.
- Review incident breakdowns to identify problem types that occur frequently in IT and OT environments.
- Use storage utilization visuals to determine if specific systems require capacity planning improvements.
- Analyze network performance metrics to detect bandwidth pressure or unauthorized access patterns.
- Review incident resolution contributors to understand where delays occur during problem management.
Benefits of Nuclear Power Plant System Performance Dashboards
- Improves plant reliability by offering clear visibility into technology performance across IT, OT, and SCADA systems.
- Helps nuclear utilities reduce operational risks by monitoring vulnerabilities, alarms, and incident patterns.
- Strengthens maintenance planning through MTBF and MTTR evaluation.
- Supports compliance and oversight activities through consistent performance tracking.
- Enables faster problem resolution by showing contributing factors in the incident management process.
- Enhances performance optimization by providing clarity on response times, system stress points, and storage utilization.
- Helps leadership make informed decisions using consistent nuclear power utility system performance metrics.
- Supports long-term performance improvements through structured trend analysis.
KPIs to Track in Nuclear Power Plant System Performance Dashboards
- Overall IT System Availability Percent – Measures how consistently IT systems remain operational to support nuclear plant workflows.
- Mean Time Between Failures Hours – Indicates the average duration systems operate without experiencing a failure.
- Mean Time To Repair Hours – Shows how long it typically takes to restore systems after a failure occurs.
- SCADA EMS Availability Percent – Tracks the operational uptime of SCADA and EMS systems that support nuclear control functions.
- Application Response Time – Measures the speed at which critical applications respond during plant operations.
- Unplanned Downtime Percent – Represents the share of downtime caused by unexpected system outages.
- Number of IT OT Incidents – Counts reported issues affecting IT and OT systems across the nuclear plant.
Frequently Asked Questions
1. What is the purpose of a Nuclear Power Plant System Performance Dashboard?
It provides a structured view of system performance, reliability, and operational health across IT, OT, and SCADA layers within nuclear power plants.
2. Who uses this type of dashboard?
Operations teams, plant managers, IT engineers, cybersecurity teams, and reliability engineers in nuclear power utilities.
3. Which metrics matter most for nuclear system performance?
Availability, MTBF, MTTR, incident trends, vulnerability counts, storage utilization, and alarm patterns.
4. Does this dashboard help cybersecurity teams?
Yes. Vulnerability counts, incident categories, and unauthorized access patterns support security oversight.