
What is a Nuclear Power Plant Supply Chain Dashboard?
A Nuclear Power Plant Supply Chain Dashboard is a centralized system that tracks fuel inventory, critical spare parts, procurement activities, and supplier performance across a nuclear facility. It helps maintenance teams monitor nuclear spare parts management, procurement efficiency, and material readiness required for safe and continuous plant operation. This dashboard consolidates data from fuel cycle logistics, component suppliers, warehouse systems, and delivery workflows, enabling better nuclear maintenance parts tracking, forecasting, and decision-making.
By integrating real-time updates, it provides plant operators, supply chain managers, and procurement teams with a transparent view of equipment availability, lead times, and replenishment risks.
How to Create a Nuclear Power Plant Supply Chain Dashboard
You don’t need to build your report from scratch—just start with a ready-to-use dashboard template from Mokkup. Add in your data and export it however you like. Here’s how to do it:
1. Create or Log in to Your Mokkup Account
Start by signing up on Mokkup.ai using your email. If you already have an account, just log in, and you’ll be good to go.
2. Choose and Customize Your Dashboard Template
Find the Nuclear Power Plant Supply Chain Dashboard template in the Templates section. Use the drag-and-drop editor to adjust KPIs, edit filters, or add elements based on your data.
3. Export to Your BI Tool
Once your dashboard wireframe is ready, use the BI Tool Export feature to send it directly to Power BI or Tableau for further analysis and enhancements. You can also download the dashboard as a PDF, PNG, or JPEG, embed it on a platform, or invite your team to collaborate.
Note: This is a Pro template. You’ll need a Pro subscription on Mokkup to use and customize this dashboard wireframe. Upgrade anytime to unlock full access.
Nuclear Power Plant Supply Chain Dashboard Example
You can create a Nuclear Power Plant Supply Chain Dashboard that combines fuel cycle visibility, inventory health, and supplier evaluation in a single interface. In the Nuclear Fuel & Inventory Readiness section, users can monitor total inventory value, critical stock availability, stockout incidents, inventory turnover days, and spent fuel storage utilization. Bar charts help compare inventory value by materials such as nuclear fuel, turbine spares, pumps, sensors, and chemicals. Additional visuals, such as critical versus non-critical stock levels, enable teams to assess readiness for equipment replacements. The dashboard also includes a visualization of the nuclear fuel cycle status, showing fuel received, stored, in transit, and loaded into the reactor. Supplier tables display current stock, minimum requirements, reorder ETA, and supplier names, enabling accurate planning of reactor equipment procurement workflows.
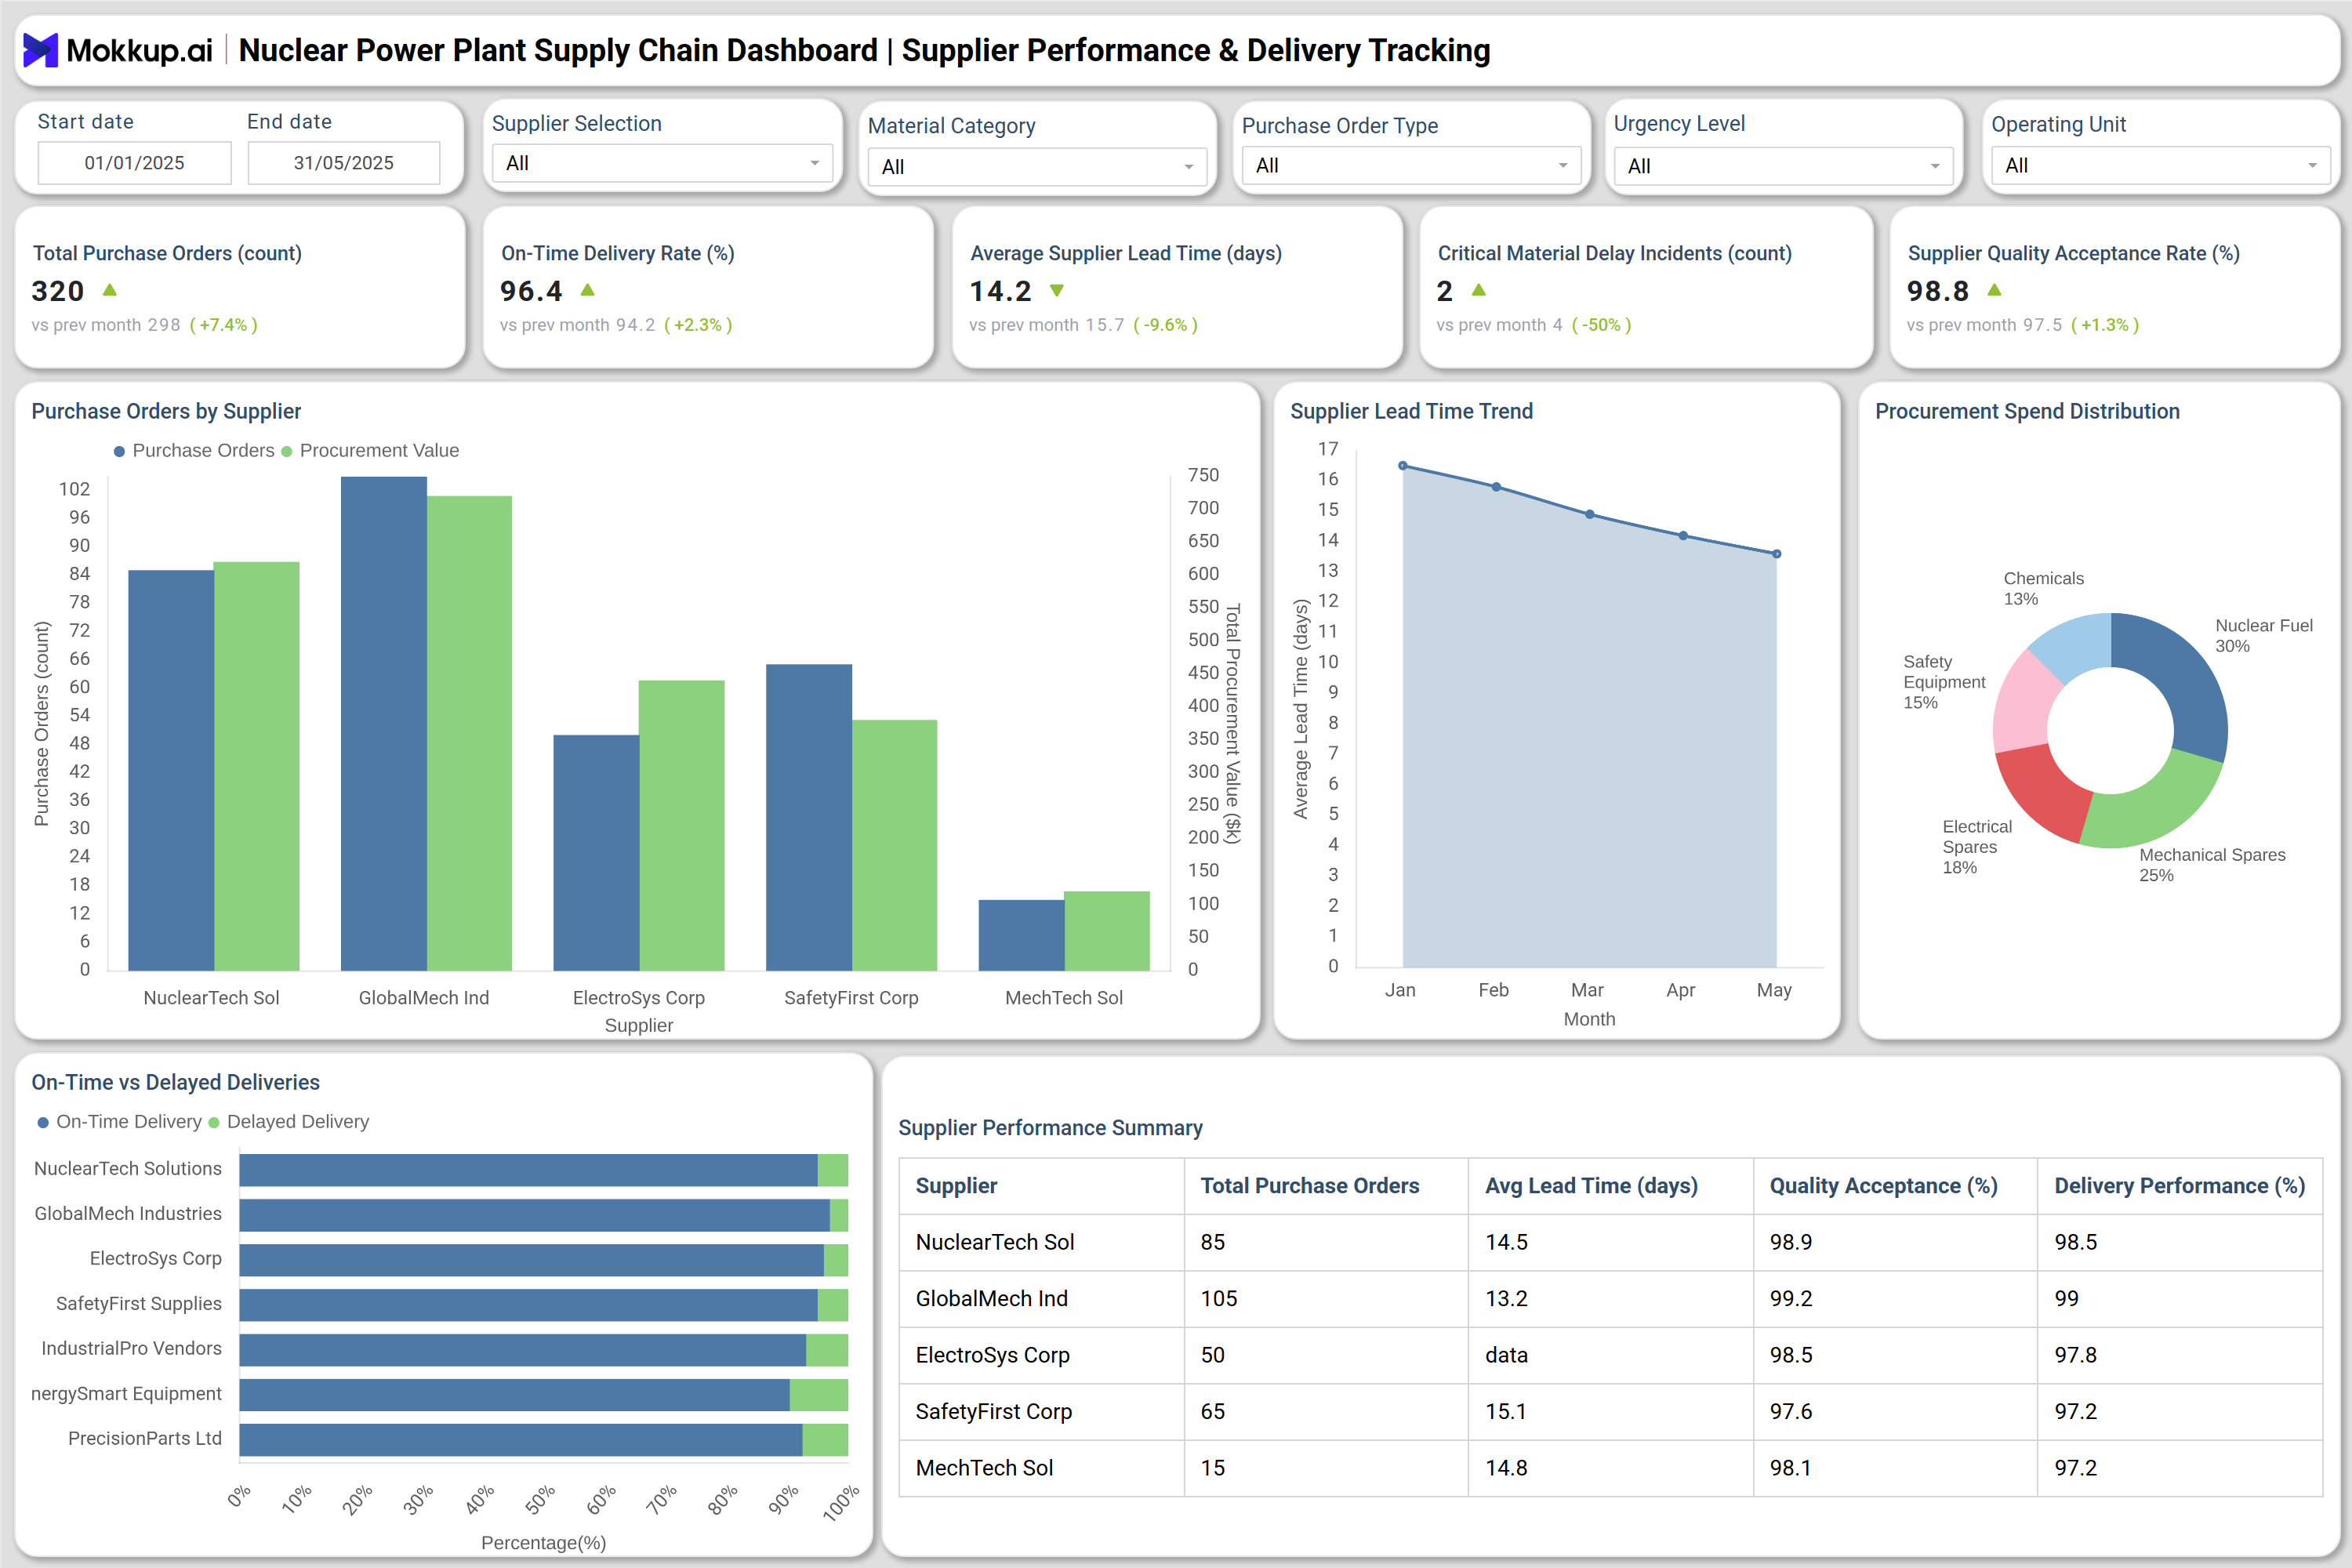
The Supplier Performance & Delivery Tracking module extends this by showing total purchase orders, on-time delivery rate, average supplier lead time, critical delay incidents, and supplier quality acceptance rate. Lead time trends highlight changes across months, while doughnut charts display the distribution of procurement spend across nuclear fuel, mechanical spares, electrical equipment, safety equipment, and chemicals. Together, these dashboards enhance nuclear power plant supply chain visibility and provide accurate insights for plant inventory replenishment analysis and monitoring of nuclear supplier performance.
How to Analyze Data in a Nuclear Power Plant Supply Chain Dashboard
Organizations can use a downtime nuclear power plant supply chain dashboard template by following these steps:
- Track critical spare parts availability to ensure essential reactor and turbine components remain above safety thresholds.
- Compare inventory turnover trends to identify slow-moving items, excess inventory, or urgent replenishment needs.
- Monitor supplier lead time patterns to assess reliability and plan procurement schedules more accurately.
- Evaluate supplier quality acceptance rates to identify risks related to defective or non-compliant materials.
- Review procurement spend distribution to prioritize high-value categories and optimize sourcing strategies.
- Analyze nuclear fuel cycle data (received, stored, in transit, loaded) to ensure uninterrupted reactor operations.
- Assess critical vs. non-critical stock ratios to verify operational readiness and emergency preparedness.
- Validate stockout incidents and delay events to improve supply chain resilience and prevent downtime.
Benefits of a Nuclear Power Plant Supply Chain Dashboard
- Enhances reliability by centralizing all inventory and supplier performance metrics.
- Reduces procurement risks with real-time visibility into supplier delivery accuracy and lead times.
- Improves nuclear maintenance parts tracking and ensures compliance with operational standards.
- Optimizes inventory spending by identifying stock levels that can be reduced or consolidated.
- Strengthens reactor equipment procurement workflow through automated tracking and alerts.
- Supports long-term planning with data-driven insights into fuel cycles and material usage.
- Prevents operational disruptions by monitoring critical stock and replenishment requirements.
- Helps maintain safety and regulatory readiness by tracking essential nuclear components.
KPIs to Track in a Nuclear Power Plant Supply Chain Dashboard
- Total Inventory Value ($) – Measures capital tied up in nuclear fuel, spares, and operational materials.
- Critical Stock Availability (%) – Tracks readiness of essential components required for safe plant operation.
- Stockout Incidents (count) – Identifies shortages that may risk system performance or safety.
- Inventory Turnover (days) – Evaluates efficiency of material usage and warehousing practices.
- Spent Fuel Storage Utilization (%) – Monitors available capacity in long-term fuel storage systems.
- Inventory Value by Material Category ($) – Shows cost distribution across major material groups.
- Critical vs. Non-Critical Stock Ratio (%) – Indicates supply chain resilience for high-risk components.
- Supplier On-Time Delivery Rate (%) – Measures reliability and consistency of supplier shipments.
- Average Supplier Lead Time (days) – Helps plan procurement timelines and reduce delays.
Frequently Asked Questions
1. Why do nuclear power plants need a supply chain dashboard?
To ensure continuous operations, manage critical materials, and reduce risks associated with delays, shortages, or procurement failures.
2. How does the dashboard support reactor operations?
It monitors nuclear fuel availability, tracks critical spare parts, and ensures the timely procurement of reactor components.
3. Can this dashboard improve supplier performance?
Yes. It highlights lead times, delivery accuracy, and quality acceptance rates, enabling better supplier evaluations and negotiations.
4. Is the dashboard useful during outages or shutdowns?
Absolutely. It helps plan spare parts allocation, procurement schedules, and resource readiness for maintenance cycles.