What is a Nuclear Power Plant Radiation & Worker Safety Dashboard?
A Nuclear Power Plant Radiation & Worker Safety dashboard template is a centralized monitoring system used to track radiation levels, worker exposure, contamination status, and personnel compliance within regulated zones of a nuclear facility. It combines nuclear radiation exposure monitoring with worker safety compliance tracking to ensure operational safety and regulatory adherence.
The dashboard wireframe provides visibility into plant radiation trends, zone-wise dose concentrations, alarm events, and worker dosimetry logs. It supports decision-makers by integrating radiation dose limit analysis, corrective actions, and workforce protection metrics into a single interface, enabling nuclear facilities to maintain strict safety standards and adhere to ALARA (As Low As Reasonably Achievable) requirements.
As part of a nuclear facility operational safety dashboard ecosystem, it ensures early risk detection, reduces exposure variability, and strengthens plant-wide safety management.
How to Create a Nuclear Power Plant Radiation & Worker Safety Dashboard
You don’t need to build your report from scratch—just start with a ready-to-use Nuclear Power Plant Radiation & Worker Safety dashboard template from Mokkup. Add in your data and export it however you like. Here’s how to do it:
1. Create or Log in to Your Mokkup Account
Start by signing up on Mokkup.ai using your email. If you already have an account, just log in, and you’ll be good to go.
2. Choose and Customize Your Dashboard Template
Find the Nuclear Power Plant Radiation & Worker Safety Dashboard template in the Templates section. Use the drag-and-drop editor to adjust KPIs, edit filters, or add elements based on your data.
3. Export to Your BI Tool
Once your dashboard wireframe is ready, use the BI Tool Export feature to send it directly to Power BI or Tableau for further analysis and enhancements. You can also download the dashboard as a PDF, PNG, or JPEG, embed it on a platform, or invite your team to collaborate.
Note: This is a Pro template. You’ll need a Pro subscription on Mokkup to use and customize this dashboard wireframe. Upgrade anytime to unlock full access.
Nuclear Power Plant Radiation & Worker Safety Dashboard Example
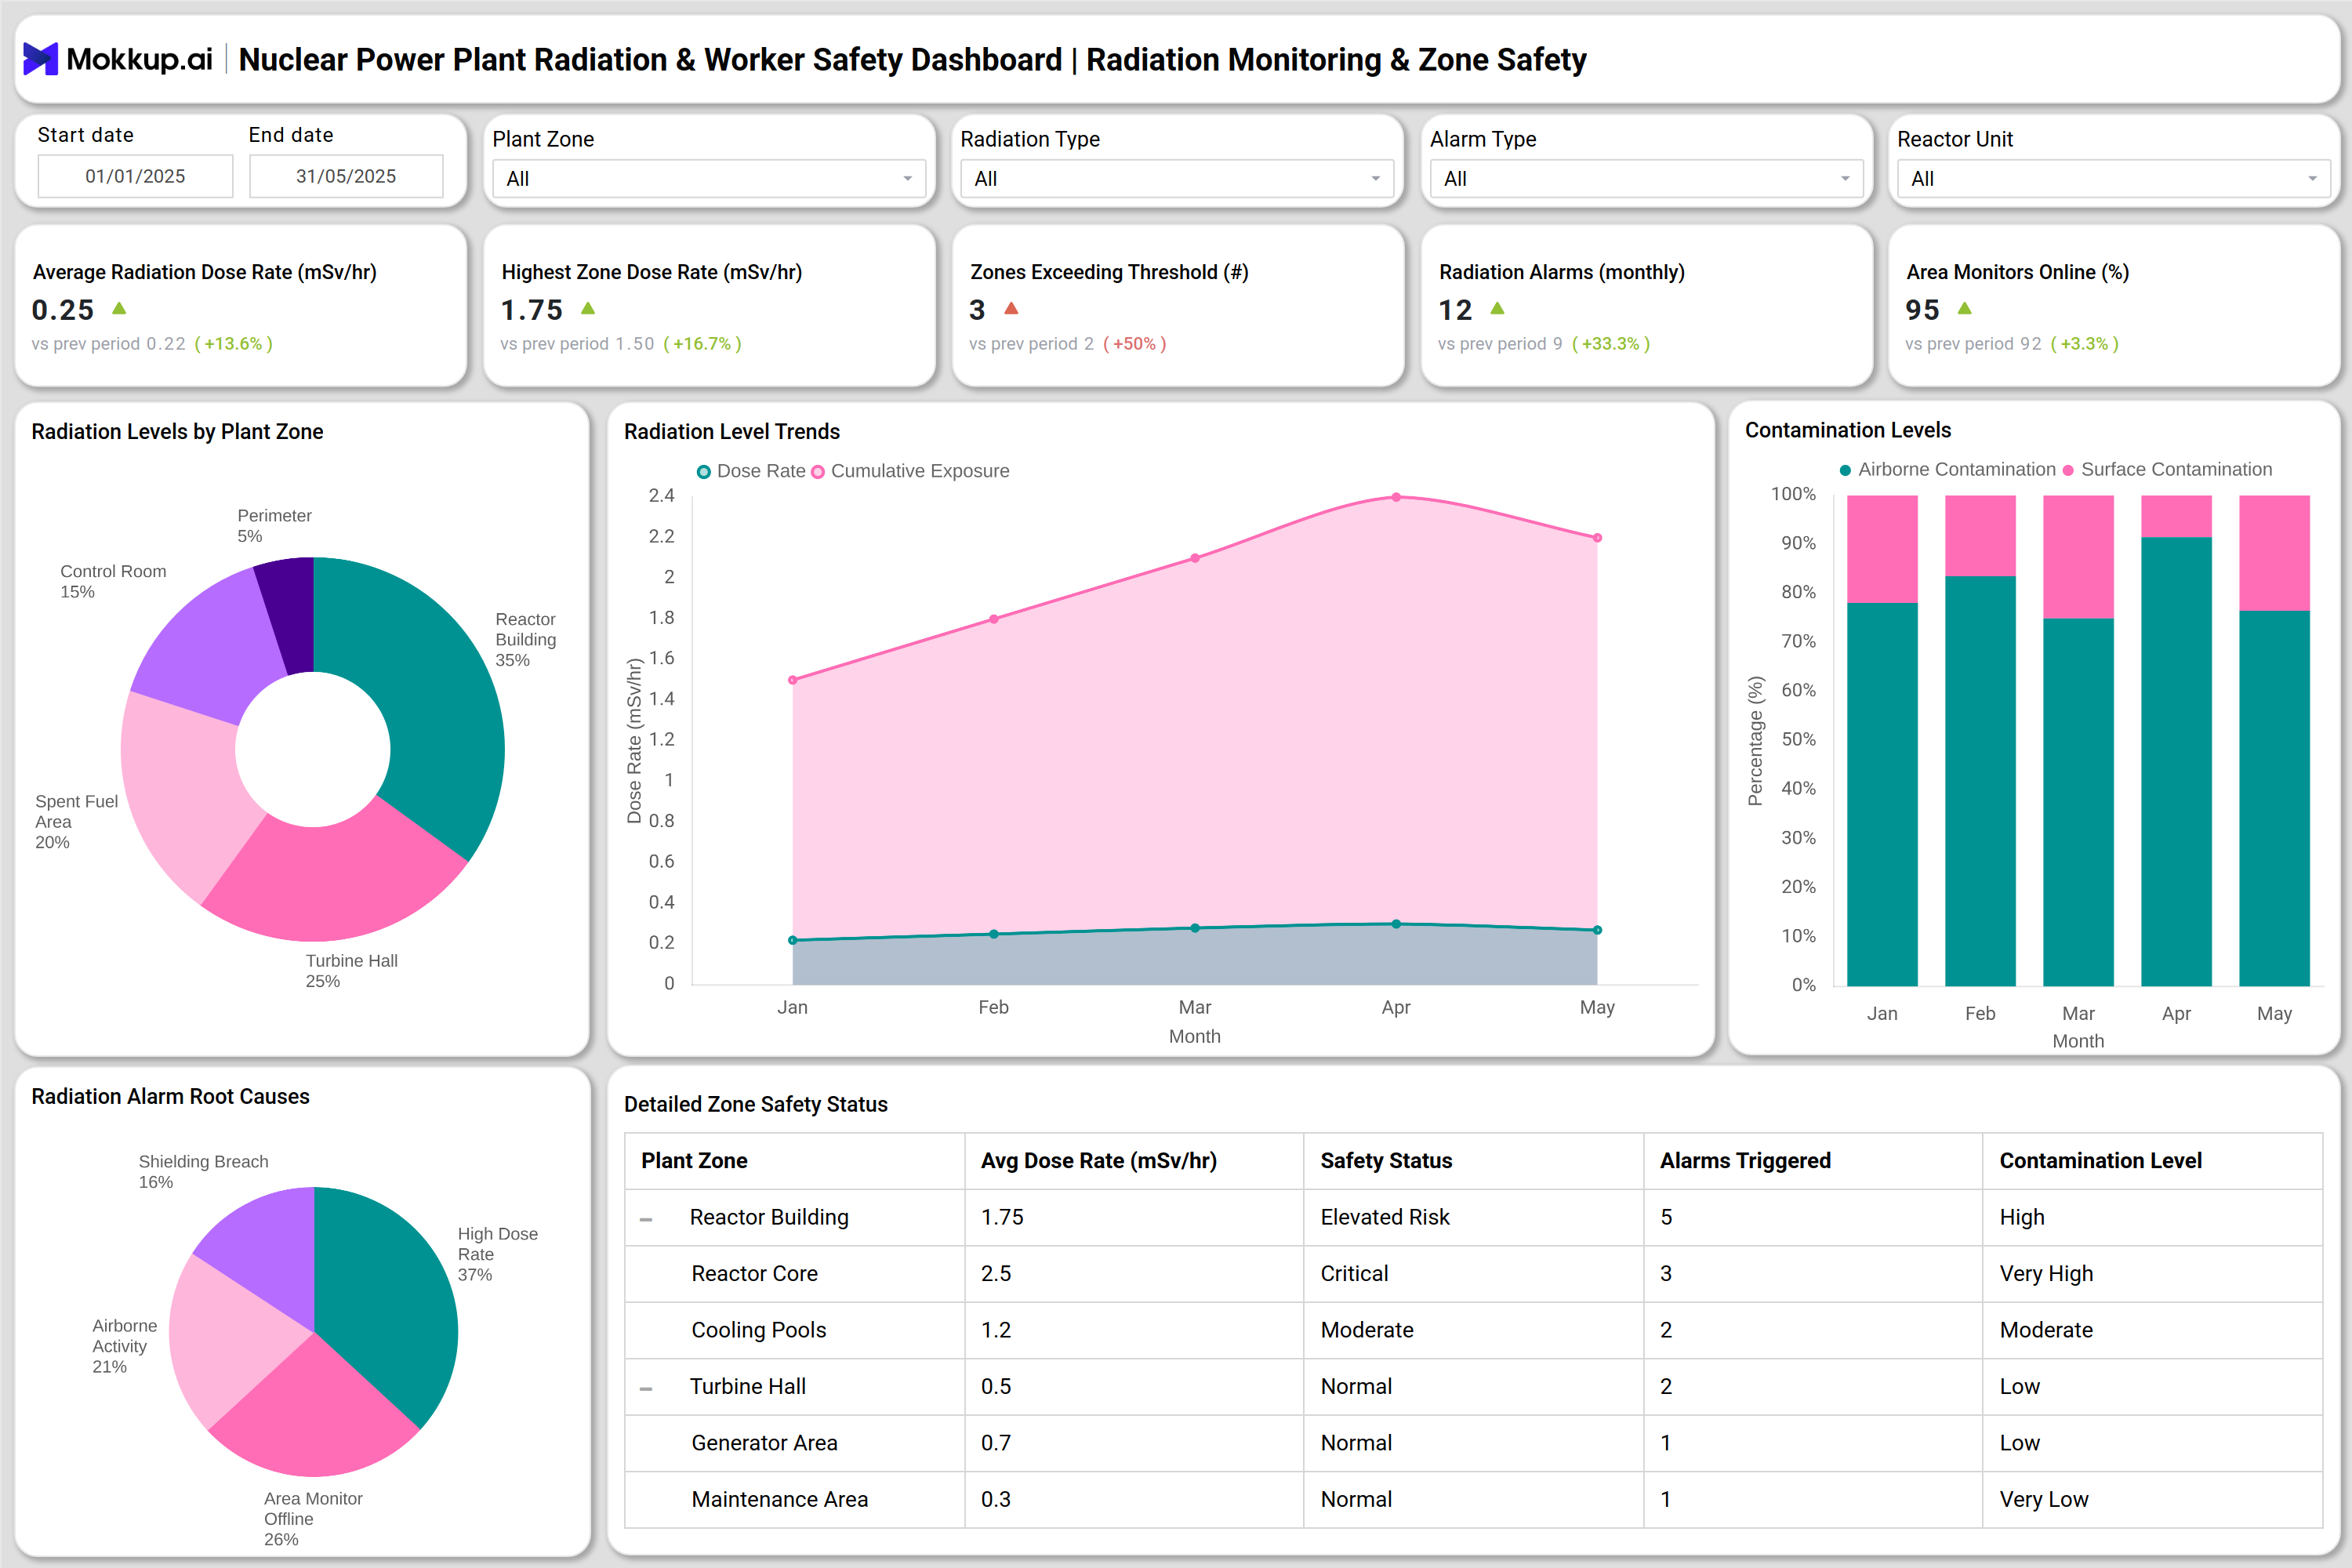
You can create a Nuclear Power Plant Radiation & Worker Safety Dashboard that includes modules for radiation zone monitoring, dose trend visualization, and contamination mapping. In the Radiation Monitoring & Zone Safety interface, users can track the average radiation dose rate, the highest zone dose, the number of alarms triggered, and the number of areas exceeding permissible thresholds. Doughnut charts illustrate dose contributions across the reactor building, spent fuel area, turbine hall, and control room, while trend graphs help identify rising exposure patterns across months.
The Worker Exposure & Dosimetry Compliance dashboard extends this by displaying monthly worker dose levels, maximum individual dose, ALARA categories, and compliance metrics, including PPE adherence and badge usage. Department-wise exposure distribution highlights high-risk job roles, such as fuel handling or maintenance engineering. A detailed worker exposure log provides monthly and cumulative dose data along with compliance status. Together, these modules serve as a comprehensive plant radiation hazard dashboard, providing actionable insights into nuclear facility safety for radiation safety officers, plant managers, and compliance teams.
How to Analyze Data in a Nuclear Power Plant Radiation & Worker Safety Dashboard
To ensure safe operations and regulatory compliance in nuclear environments, analyze the dashboard using these key focus areas:
- Review Radiation Dose Rates: Examine average and peak dose rates to identify high-risk facility zones.
- Track Monthly Exposure Trends: Monitor month-to-month trends to detect abnormal increases in radiation or contamination.
- Compare Contamination Types: Analyze airborne versus surface contamination levels to pinpoint contamination sources.
- Assess Radiation Alarm Causes: Review alarm root-cause data to prioritize corrective actions and improve preventive controls.
- Use Zone Safety Status Tables: Identify zones categorized as critical, elevated, or moderate exposure areas for focused monitoring.
- Monitor Worker Dose Distribution: Track individual and departmental exposure levels to detect outliers or abnormal dose patterns.
- Check ALARA Compliance: Validate adherence to ALARA limits to ensure workers stay within allowable exposure thresholds.
- Validate PPE and Badge Usage: Review PPE compliance and dosimetry badge usage to confirm operational discipline.
- Use Worker Exposure Logs: Analyze exposure logs to schedule job rotation or reduce time spent in high-risk zones.
Benefits of Nuclear Power Plant Radiation & Worker Safety Dashboard
A radiation and worker safety dashboard centralizes exposure, contamination, and operational safety insights to strengthen nuclear facility governance.
- Enhanced Radiation Exposure Monitoring: Provides real-time visibility into radiation conditions across the plant.
- Improved Worker Safety Compliance: Tracks safety adherence across roles and departments.
- Early Detection of Abnormal Dose Levels: Alerts teams to unusual spikes in radiation.
- Automated Dose Limit Analysis: Simplifies regulatory reporting with automated calculations and alerts.
- Centralized Contamination Tracking: Offers a unified view of airborne and surface contamination patterns.
- Stronger ALARA Enforcement: Supports corrective action planning aligned with ALARA principles.
- Reduced Operational Risk: Identifies hazard zones early to prevent unsafe exposure.
- Integrated Workforce Safety Insights: Combines personnel protection metrics for a holistic safety view.
- Optimized Worker Rotation: Helps manage assignments to minimize cumulative exposure.
- Greater Transparency and Accountability: Increases visibility into plant-wide safety performance.
KPIs to Track in Nuclear Power Plant Radiation & Worker Safety Dashboard
Use these KPIs to monitor radiation trends, contamination risks, and worker exposure levels effectively:
- Average Radiation Dose Rate (mSv/hr): Measures typical radiation levels in monitored zones.
- Highest Zone Dose Rate (mSv/hr): Identifies the most critical exposure area.
- Zones Exceeding Threshold: Indicates areas surpassing regulatory limits.
- Radiation Alarms (count): Tracks frequency of alarms triggered by unsafe conditions.
- Area Monitors Online (%): Confirms operational availability of monitoring equipment.
- Contamination Levels (%): Measures airborne and surface contamination distribution.
- Radiation Alarm Root Causes: Shows reasons behind exposure events.
- Avg Worker Dose (mSv): Represents the monthly average exposure per worker.
- ALARA Compliance Score: Evaluates alignment with minimal exposure standards.
Frequently Asked Questions
Q1. Why is radiation monitoring important in nuclear power plants?
It ensures radiation levels remain within safe regulatory limits and prevents harmful exposure to personnel.
Q2. Who uses a radiation and worker safety dashboard?
Radiation safety officers, plant supervisors, compliance teams, and regulatory auditors.
Q3. How often should worker exposure data be reviewed?
Usually daily or weekly, depending on job roles and exposure risk.
Q4. Can dashboards help reduce radiation exposure?
Yes, by identifying high-risk zones, tracking cumulative doses, and improving compliance behaviors.
Q5. What regulatory frameworks require radiation monitoring?
Guidelines from bodies such as the NRC, IAEA, and national radiation safety authorities.