What is a Coal Power Plant Safety Dashboard?
A Coal Power Plant Safety Dashboard template is a centralized digital platform designed to monitor, analyze, and improve workplace safety within coal-based energy generation facilities. It integrates operational data, incident records, compliance results, and emergency response metrics to help safety officers and plant managers track key safety parameters. By leveraging power generation safety analytics, organizations can proactively identify risks, minimize hazards, and maintain regulatory compliance.
This type of industrial safety management dashboard enhances visibility into employee safety, environmental risks, and operational incidents, supporting data-driven decisions that prevent downtime and protect personnel.
How to Create a Coal Power Plant Safety Dashboard
You don’t need to build your report from scratch—just start with a ready-to-use dashboard template from Mokkup. Add in your data and export it however you like. Here’s how to do it:
1. Create or Log in to Your Mokkup Account
Start by signing up on Mokkup.ai using your email. If you already have an account, just log in, and you’ll be good to go.
2. Choose and Customize Your Dashboard Template
Find the Coal Power Plant Safety Dashboard template in the Templates section. Use the drag-and-drop editor to adjust KPIs, edit filters, or add elements based on your data.
3. Export to Your BI Tool
Once your dashboard wireframe is ready, use the BI Tool Export feature to send it directly to Power BI or Tableau for further analysis and enhancements. You can also download the dashboard as a PDF, PNG, or JPEG, embed it on a platform, or invite your team to collaborate.
Note: This is a Pro template. You’ll need a Pro subscription on Mokkup to use and customize this dashboard wireframe. Upgrade anytime to unlock full access.
Coal Power Plant Safety Dashboard Example
You can create a Coal Power Plant Safety Dashboard that consolidates multiple layers of operational and safety insights into a unified, data-driven monitoring system. The Emergency Preparedness & Risk Monitoring Dashboard provides a comprehensive view of critical safety metrics, including fire drill compliance, emergency response times, and risk assessment coverage. Through visual reports on alarm performance, risk category distribution, and equipment inspection status, safety teams can assess readiness across departments and ensure all safety protocols are functioning effectively.
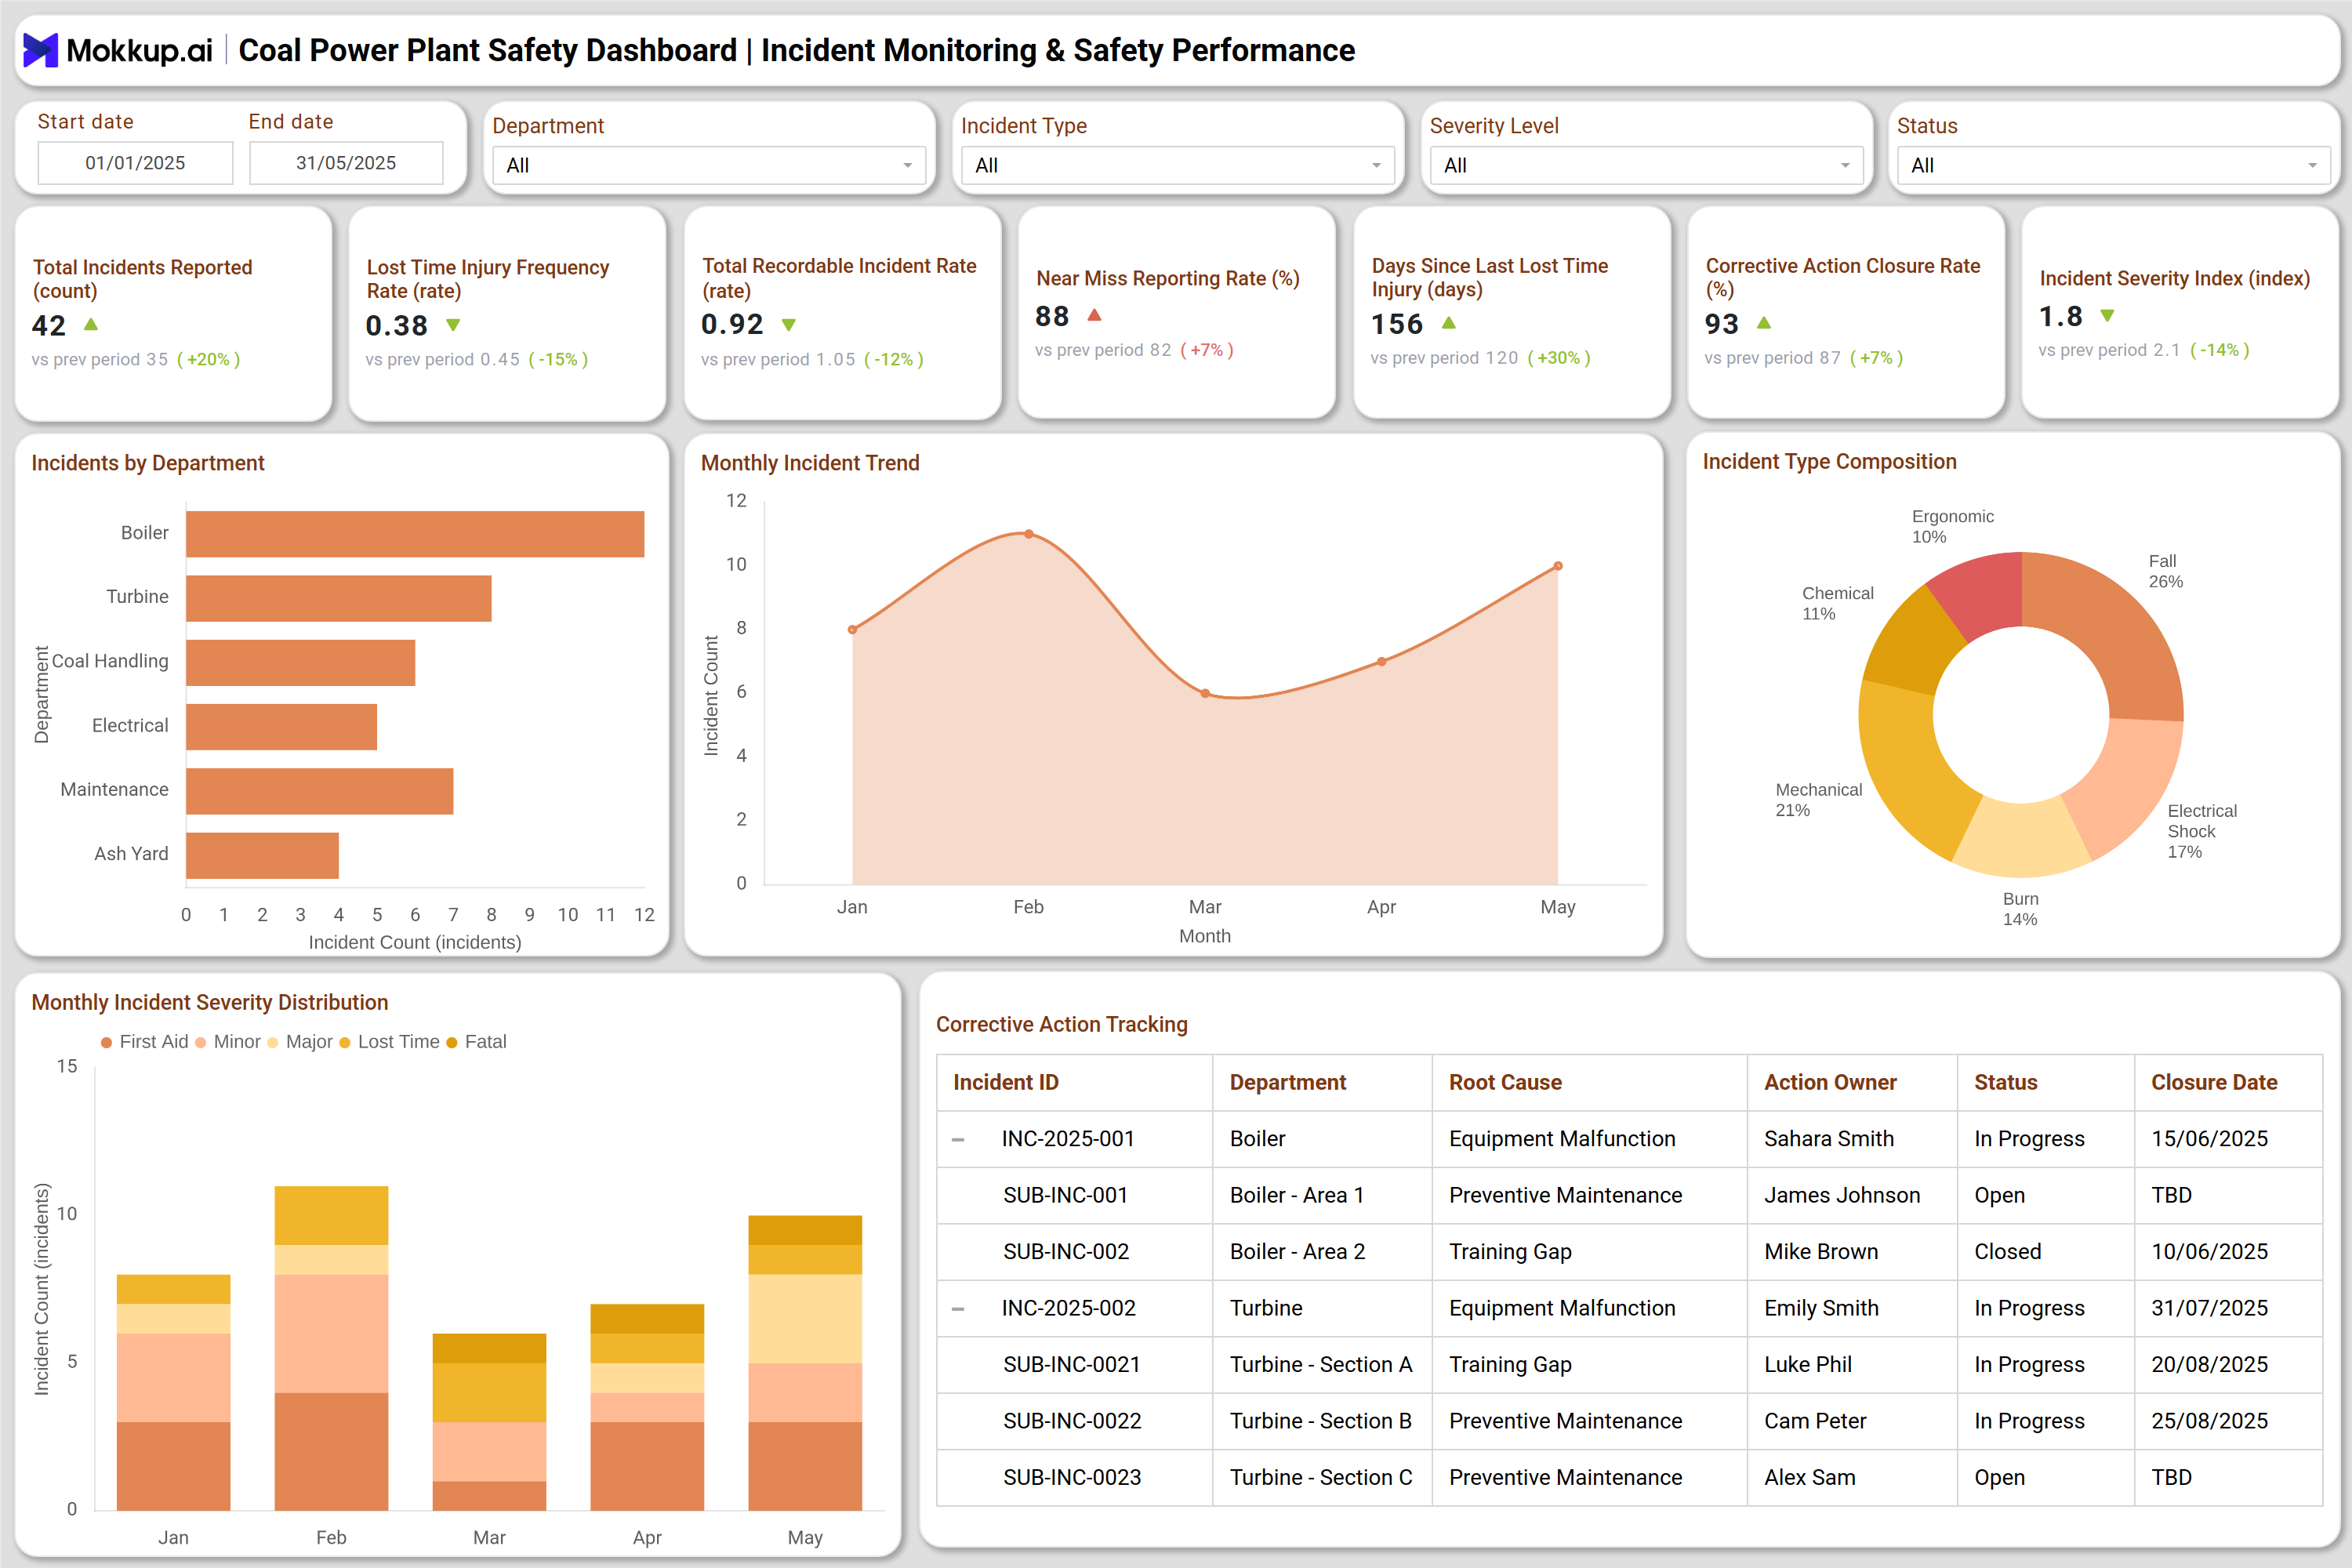
The Incident Monitoring & Safety Performance Dashboard enables continuous tracking and analysis of workplace incidents. It monitors essential indicators, such as the lost-time injury rate, total recordable incident rate, and near-miss reporting percentage. Interactive charts display monthly incident trends, severity levels, and progress on corrective actions, helping identify recurring causes, such as equipment malfunctions or inadequate training. These insights guide targeted interventions that reduce downtime and improve workplace safety outcomes.
The Safety Compliance & Audit Management Dashboard evaluates compliance rates for PPE usage, safety training completion, and permit-to-work adherence. It also visualizes safety audit findings, contractor compliance results, and pending corrective actions for operational units such as boilers, turbines, and electrical maintenance areas. Together, these integrated dashboards serve as a robust energy plant safety performance dashboard, empowering safety officers and plant administrators to manage risk, enhance audit performance, and foster a culture of proactive safety throughout the entire power generation facility.
How to Analyze Data in a Coal Power Plant Safety Dashboard
A Coal Power Plant Safety Dashboard helps management teams monitor workplace safety, track compliance, and reduce risks across high-risk operational areas. By analyzing data, teams can identify hazards early and improve overall plant safety performance.
- Monitor Risk Indicators: Track metrics such as fire drill compliance, risk assessment coverage, and safety equipment inspections to identify readiness gaps.
- Assess Incident Trends: Evaluate monthly incident frequency, severity distribution, and root causes to determine recurring issues.
- Review Response Efficiency: Analyze emergency response times and evacuation drill performance to measure preparedness.
- Evaluate Compliance Rates: Compare safety training completion, PPE compliance, and permit-to-work adherence across departments.
- Correlate Audit and Incident Data: Use insights from audit reports to verify whether safety procedures are effectively reducing incident rates.
- Visualize Equipment Safety: Leverage inspection trackers to monitor maintenance, calibration, and expiration dates for critical safety devices.
- Implement Corrective Actions: Identify areas requiring improvement and assign responsibility using the corrective action tracker.
Benefits of Coal Power Plant Safety Dashboard
Implementing a coal power plant safety dashboard enhances operational visibility, ensures regulatory compliance, and promotes a proactive approach to workplace safety management.
- Centralized Visibility: Provides a unified view of safety operations across departments like turbine, boiler, and coal handling units.
- Faster Risk Detection: Real-time workplace safety monitoring dashboard alerts managers to deviations or high-risk conditions.
- Regulatory Compliance: Ensures all safety audits, inspections, and training activities meet energy sector compliance standards.
- Reduced Incident Rates: Helps identify leading indicators of accidents and implement preventive measures effectively.
- Operational Efficiency: Simplifies coordination between maintenance, safety, and operations teams for timely corrective actions.
- Improved Emergency Preparedness: Tracks evacuation drills and emergency readiness metrics to ensure rapid response during incidents.
- Data-Driven Safety Culture: Encourages continuous improvement by leveraging analytics to reduce human error and equipment-related risks.
KPIs to Track in Coal Power Plant Safety Dashboard
Key performance indicators (KPIs) help measure safety compliance, emergency readiness, and overall risk management efficiency within coal power plant operations.
- Fire Drill Compliance (%): Monitors adherence to scheduled safety drills across facilities.
- Emergency Response Time (min): Measures how quickly emergency teams respond to alerts or incidents.
- Risk Assessment Coverage (%): Indicates the extent to which operational risks are thoroughly assessed.
- Safety Equipment Compliance (%): Tracks inspection and maintenance status of fire extinguishers, alarms, and PPE.
- Total Recordable Incident Rate (TRIR): Evaluates total workplace incidents per reporting period.
- Corrective Action Closure Rate (%): Measures how efficiently corrective measures are executed post-audit.
- Permit-to-Work Compliance (%): Assesses authorization control for high-risk operations like electrical or confined space work.
- PPE Compliance Rate (%): Tracks adherence to mandatory protective equipment usage.
- Contractor Safety Compliance (%): Evaluates third-party safety practices in plant operations.
Frequently Asked Questions
Q1. What is the purpose of a coal power plant safety dashboard?
It provides a real-time, data-driven overview of all safety operations, helping plant managers detect risks, prevent incidents, and ensure compliance with industrial safety standards.
Q2. How does a workplace safety monitoring dashboard help in coal plants?
It consolidates data from incident reports, equipment inspections, and safety audits, allowing teams to monitor hazards and improve plant safety performance.
Q3. What departments benefit from this dashboard?
Departments like boiler, turbine, coal handling, electrical maintenance, and logistics use the dashboard to manage safety KPIs and reduce operational risks.
Q4. Can the dashboard track audits and compliance reports?
Yes, it serves as a complete coal plant incident tracking system, integrating audit results, inspection logs, and compliance metrics for internal and regulatory reporting.
Q5. How often should the data be updated?
Ideally, safety dashboards are updated daily or weekly, depending on plant activity and compliance requirements, ensuring continuous safety oversight.