The emergency department dashboard provides a comprehensive overview of patients' health analysis. It serves as a vital tool for healthcare professionals, offering real-time insights into patient status, medical histories, current conditions, and treatment plans.
Screen 1: Total Patient Overview
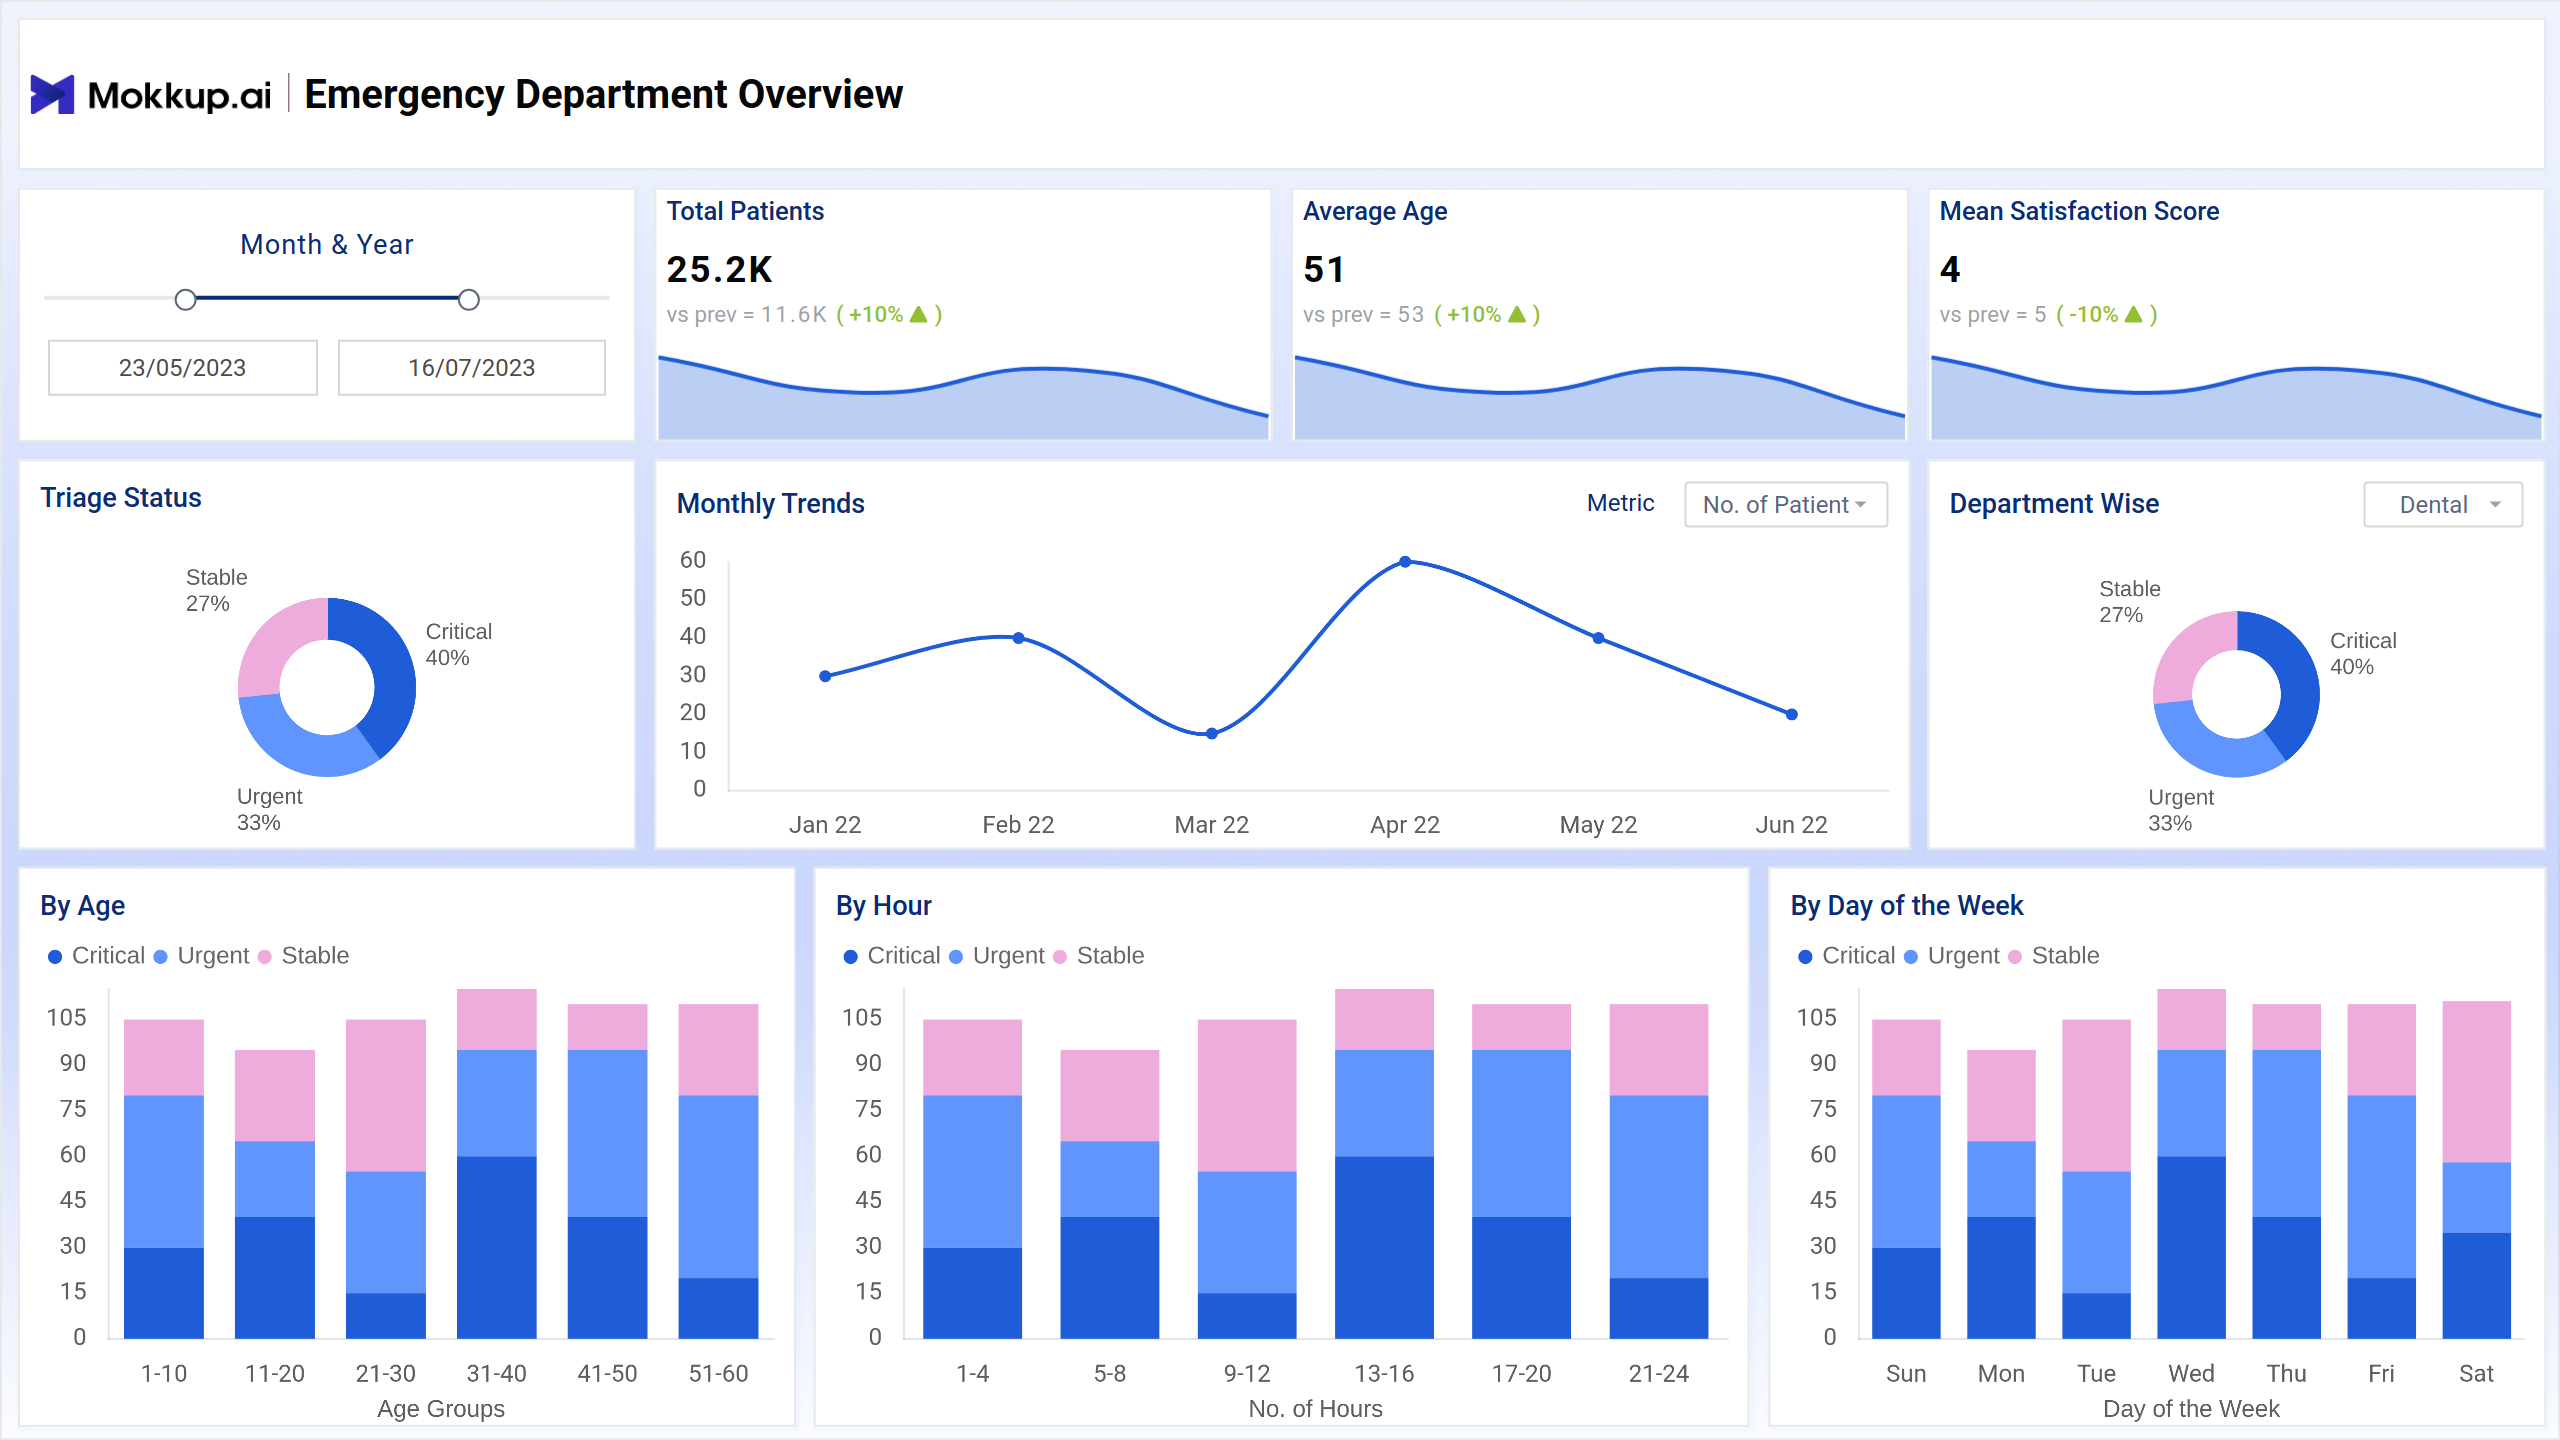
Provides information on patient triage status, monthly trends, departmental patient distribution by age, hourly updates, and day-to-day patient statuses. It also includes important key metrics like the total number of patients, average age, and the average satisfaction level of the patients.
Key Terms to consider:
- Triage status: The dashboard provides real-time updates on patients' triage statuses, enabling efficient prioritization of medical attention.
- Total patients: Users can quickly access the total number of patients currently present in the emergency department, aiding in resource allocation and workload management.
- Average age: The dashboard displays the average age of patients, allowing healthcare providers to tailor care plans to demographic trends and specific age groups.
- Mean satisfaction score: Users can gauge patient satisfaction levels through the mean satisfaction score, helping to identify areas for improvement and enhance overall patient experience.
- Department-wise: The dashboard organizes patient data by department, facilitating targeted analysis and resource allocation for different areas of the emergency department.
- Monthly trends: Users can track monthly trends in patient influx, acuity levels, and resource utilization, facilitating proactive planning and decision-making for future operational needs.
Screen 2: Resource Utilization and Patterns
The second dashboard view shows resource allocation, readmission, patient acuity, available resources, discharge rates, and the patient flow chart, providing a comprehensive overview of resource management and patient care.
Key Terms to consider:
- Readmission%: The dashboard tracks readmission percentages, providing insights into the effectiveness of discharge plans and post-discharge care.
- Resource utilization: Users can monitor resource utilization levels, ensuring efficient allocation of staff, equipment, and facilities to meet patient needs.
- Resource availability: Real-time updates on resource availability help healthcare providers make informed decisions and allocate resources effectively to optimize patient care.
- Discharge rate: The dashboard displays discharge rates, allowing healthcare teams to assess patient turnover and streamline discharge processes for improved efficiency.
- Patient flow chart: Visual representations of patient flow enable healthcare providers to identify bottlenecks, streamline workflows, and enhance overall departmental efficiency.
- Patient acuity level: Users can assess patient acuity levels to prioritize care and allocate resources based on the severity of patient conditions, ensuring timely interventions and optimal outcomes.
Dashboard Template Insights
This dashboard introduces an essential emergency department dashboard for healthcare professionals, offering real-time insights into patient health and operational efficiency. Screen 1 provides key metrics like patient count, average age, and satisfaction levels, aiding in resource allocation and patient prioritization. Screen 2 delves into resource management with data on readmission rates, resource utilization, and patient flow, enabling efficient allocation and streamlined workflows for improved patient outcomes.
Conclusion
The emergency department dashboard provides a patient health overview through two views: Total Patients Overview and Resource Utilization. It tracks patient triage, demographics, resource allocation, and satisfaction scores, enabling efficient management for better patient care.