What is a Neurology Screening Performance & Preventive Care Dashboard?
A Neurology Screening Performance & Preventive Care Dashboard is a centralized tool designed for neurology clinic leadership, including medical directors, practice managers, and clinical leads, to monitor and evaluate the effectiveness of screening programs and preventive care initiatives. It provides a clear view of screening volumes, patient risk stratification, follow-up adherence, and early detection rates. Unlike static reports, this dashboard acts as a focused Neurology screening performance and preventive care dashboard, helping clinics track operational efficiency, patient outcomes, and preventive care quality in one place.
How to Create a Neurology Screening Performance & Preventive Care Dashboard
You don’t need to build your report from scratch—just start with a ready-to-use Neurology Screening Performance & Preventive Care Dashboard template from Mokkup. Add in your data and export it however you like. Here’s how to do it:
1. Create or Log in to Your Mokkup Account
Start by signing up on Mokkup.ai using your email. If you already have an account, just log in, and you’ll be good to go.
2. Choose and Customize Your Dashboard Template
Find the Neurology Screening Performance & Preventive Care Dashboard template in the Templates section. Use the drag-and-drop editor to adjust KPIs, edit filters, or add elements based on your data.
3. Export to Your BI Tool
Once your dashboard wireframe is ready, use the BI Tool Export feature to send it directly to Power BI or Tableau for further analysis and enhancements. You can also download the dashboard as a PDF, PNG, or JPEG, embed it on a platform, or invite your team to collaborate.
Note: This is a Pro template. You’ll need a Pro subscription on Mokkup to use and customize this dashboard wireframe. Upgrade anytime to unlock full access.
Neurology Screening Performance & Preventive Care Dashboard Example
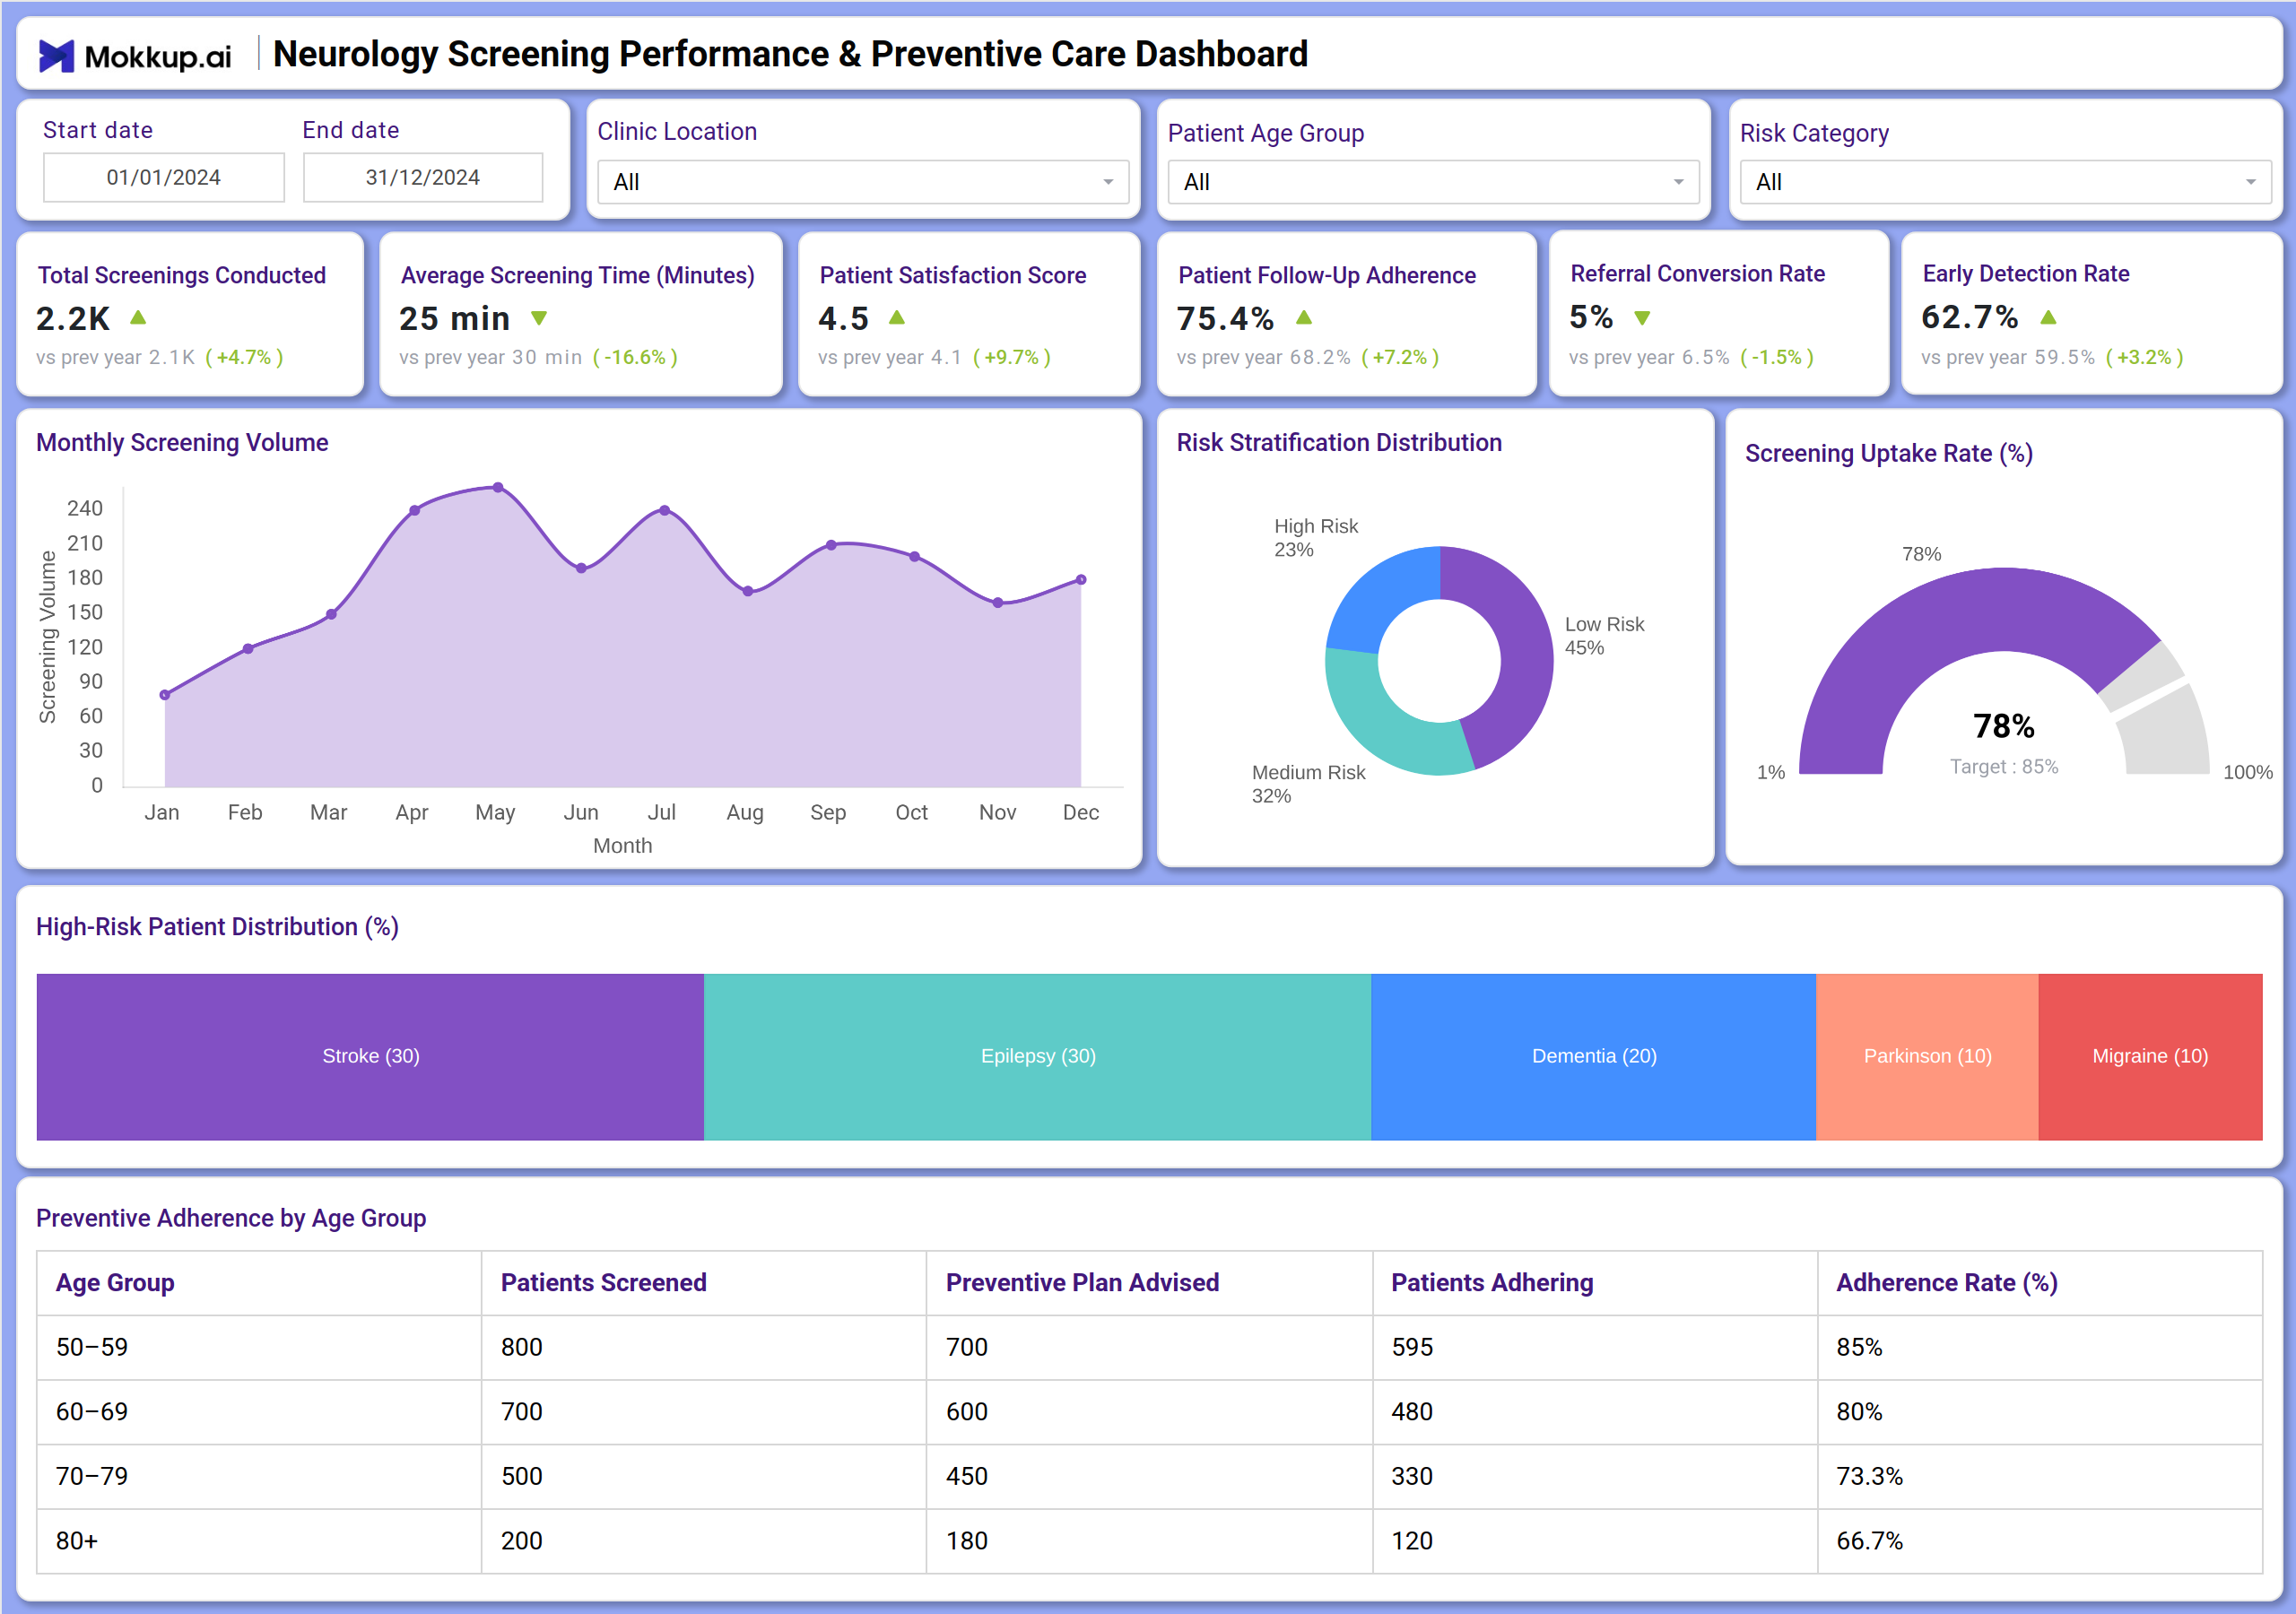
You can create a Neurology Screening Performance & Preventive Care Dashboard with a mix of KPI tiles and visualizations. At the top, KPI cards track key metrics, including total screenings conducted, average screening time, patient satisfaction, follow-up adherence, referral conversion rates, and early detection rates. Below that, charts show monthly screening volumes, risk stratification distribution, high-risk patient breakdown, and preventive adherence by age group. Bar and line charts help monitor trends and adherence rates. Together, this dashboard serves as a comprehensive tool for tracking neurology screening and preventive care metrics, ensuring leadership gains both clinical and operational visibility.
How to Analyze Data in Neurology Screening Performance & Preventive Care Dashboards
Here’s how clinics can make the most of the data available on the Neurology screening performance and preventive care dashboard:
- Track screening activity: Use line charts to monitor monthly screening volumes and identify seasonal trends.
- Monitor efficiency: Analyze average screening time to optimize clinical workflows and reduce patient wait times.
- Evaluate patient satisfaction: Track satisfaction scores to gauge patient experience and service quality.
- Measure follow-up adherence: Review adherence rates to assess patient compliance with recommended care plans.
- Assess referral effectiveness: Monitor referral conversion rates to evaluate the efficiency of specialist referrals.
- Gauge early detection success: Track early detection rates to measure the impact of screening programs.
- Review risk distribution: Analyze risk stratification to prioritize resources for high-risk groups.
- Monitor preventive care: Utilize adherence rate tables to assess the effectiveness of different age groups in following preventive plans.
Benefits of Neurology Screening Performance & Preventive Care Dashboards
The dashboard for tracking neurology screening and preventive care metrics has following advantages:
- Improved visibility: Clear KPIs across screening performance, risk management, and preventive care.
- Operational efficiency: Tracks screening time and follow-up rates for better resource planning.
- Enhanced patient outcomes: Monitors early detection and adherence to improve long-term health.
- Risk-based prioritization: Identifies high-risk patients for targeted interventions.
- Preventive care tracking: Measures adherence across age groups to tailor education and support.
- Compliance & reporting: Works as a neurology screening, reporting and compliance dashboard for audits and governance.
Together, these elements provide clinic leadership with clinical and operational visibility, making it easier to align screening efforts with patient outcomes. That’s why many healthcare leaders call it the best dashboard for neurology screening and preventive care when aiming to improve clinical effectiveness and patient adherence.
KPIs to Track in Neurology Screening Performance & Preventive Care Dashboards
The key KPIs in neurology screening reporting and compliance dashboard include:
- Total Screenings Conducted: Volume of screenings performed in a given period.
- Average Screening Time (Minutes): Average duration taken per screening session.
- Patient Satisfaction Score: Patient-rated experience with screening services.
- Patient Follow-Up Adherence (%): Percentage of patients adhering to follow-up plans.
- Referral Conversion Rate (%): Proportion of referrals leading to further treatment.
- Early Detection Rate (%): Percentage of conditions identified at an early stage.
- Risk Stratification Distribution: Breakdown of patients by risk level (high, medium, low).
- Screening Uptake Rate (%): Participation rate across risk categories.
- High-Risk Patient Distribution (%): Proportion of patients by specific neurological risk (e.g., stroke, epilepsy).
- Preventive Adherence by Age Group: Adherence rates to preventive plans across different age brackets.
Frequently Asked Questions
1. Who should use a Neurology Screening Performance & Preventive Care Dashboard?
Medical directors, neurology practice managers, clinical leads, and healthcare administrators are responsible for screening programs and preventive care.
2. Can this dashboard help improve patient adherence?
Yes. By tracking follow-up and preventive adherence rates, clinics can identify gaps and implement support strategies.
3. How does it support early detection efforts?
It monitors early detection rates and risk stratification, helping clinics measure the impact of screening initiatives.
4. Is this dashboard useful for compliance?
Yes, because a neurology screening workflow and outcome analytics dashboard support governance, reporting, and compliance audits.