What is an Outreach & Preventive Care Dashboard?
An Outreach & Preventive Care Dashboard is a centralized platform designed to monitor outreach program performance, preventive care initiatives, and early CKD detection across dialysis centers. This real-time CKD outreach dashboard allows Public Health Officers, Outreach Program Managers, Nephrology Heads, and Preventive Care Coordinators to track awareness campaigns, screening participation, referral conversions, and follow-up compliance. By combining outreach session data, patient demographics, referral sources, and follow-up effectiveness, the CKD awareness and preventive care dashboard for dialysis centers enables program optimization, early CKD detection, and improved decision-making.
How to Create an Outreach & Preventive Care Dashboard
You don’t need to build your report from scratch-just start with a ready-to-use Outreach & Preventive care dashboard template from Mokkup. Add your data and export it as needed. Here’s how to do it:
1. Create or Log in to Your Mokkup Account
Start by signing up on Mokkup.ai using your email. If you already have an account, simply log in, and you’ll be all set.
2. Choose and Customize Your Dashboard Template
Find the Outreach & Preventive Care Dashboard template in the Templates section. Use the drag-and-drop editor to adjust KPIs, edit filters, or add elements based on your preventive care program metrics.
3. Export to Your BI Tool
Once your dashboard wireframe is ready, use the BI Tool Export feature to send it directly to Power BI or Tableau for further analysis and enhancements. You can also download the dashboard as a PDF, PNG, or JPEG, embed it on a platform, or invite your team to collaborate.
Note: This is a Pro template. You’ll need a Pro subscription on Mokkup to use and customize this dashboard wireframe. Upgrade anytime to unlock full access.
Outreach & Preventive Care Dashboard Example
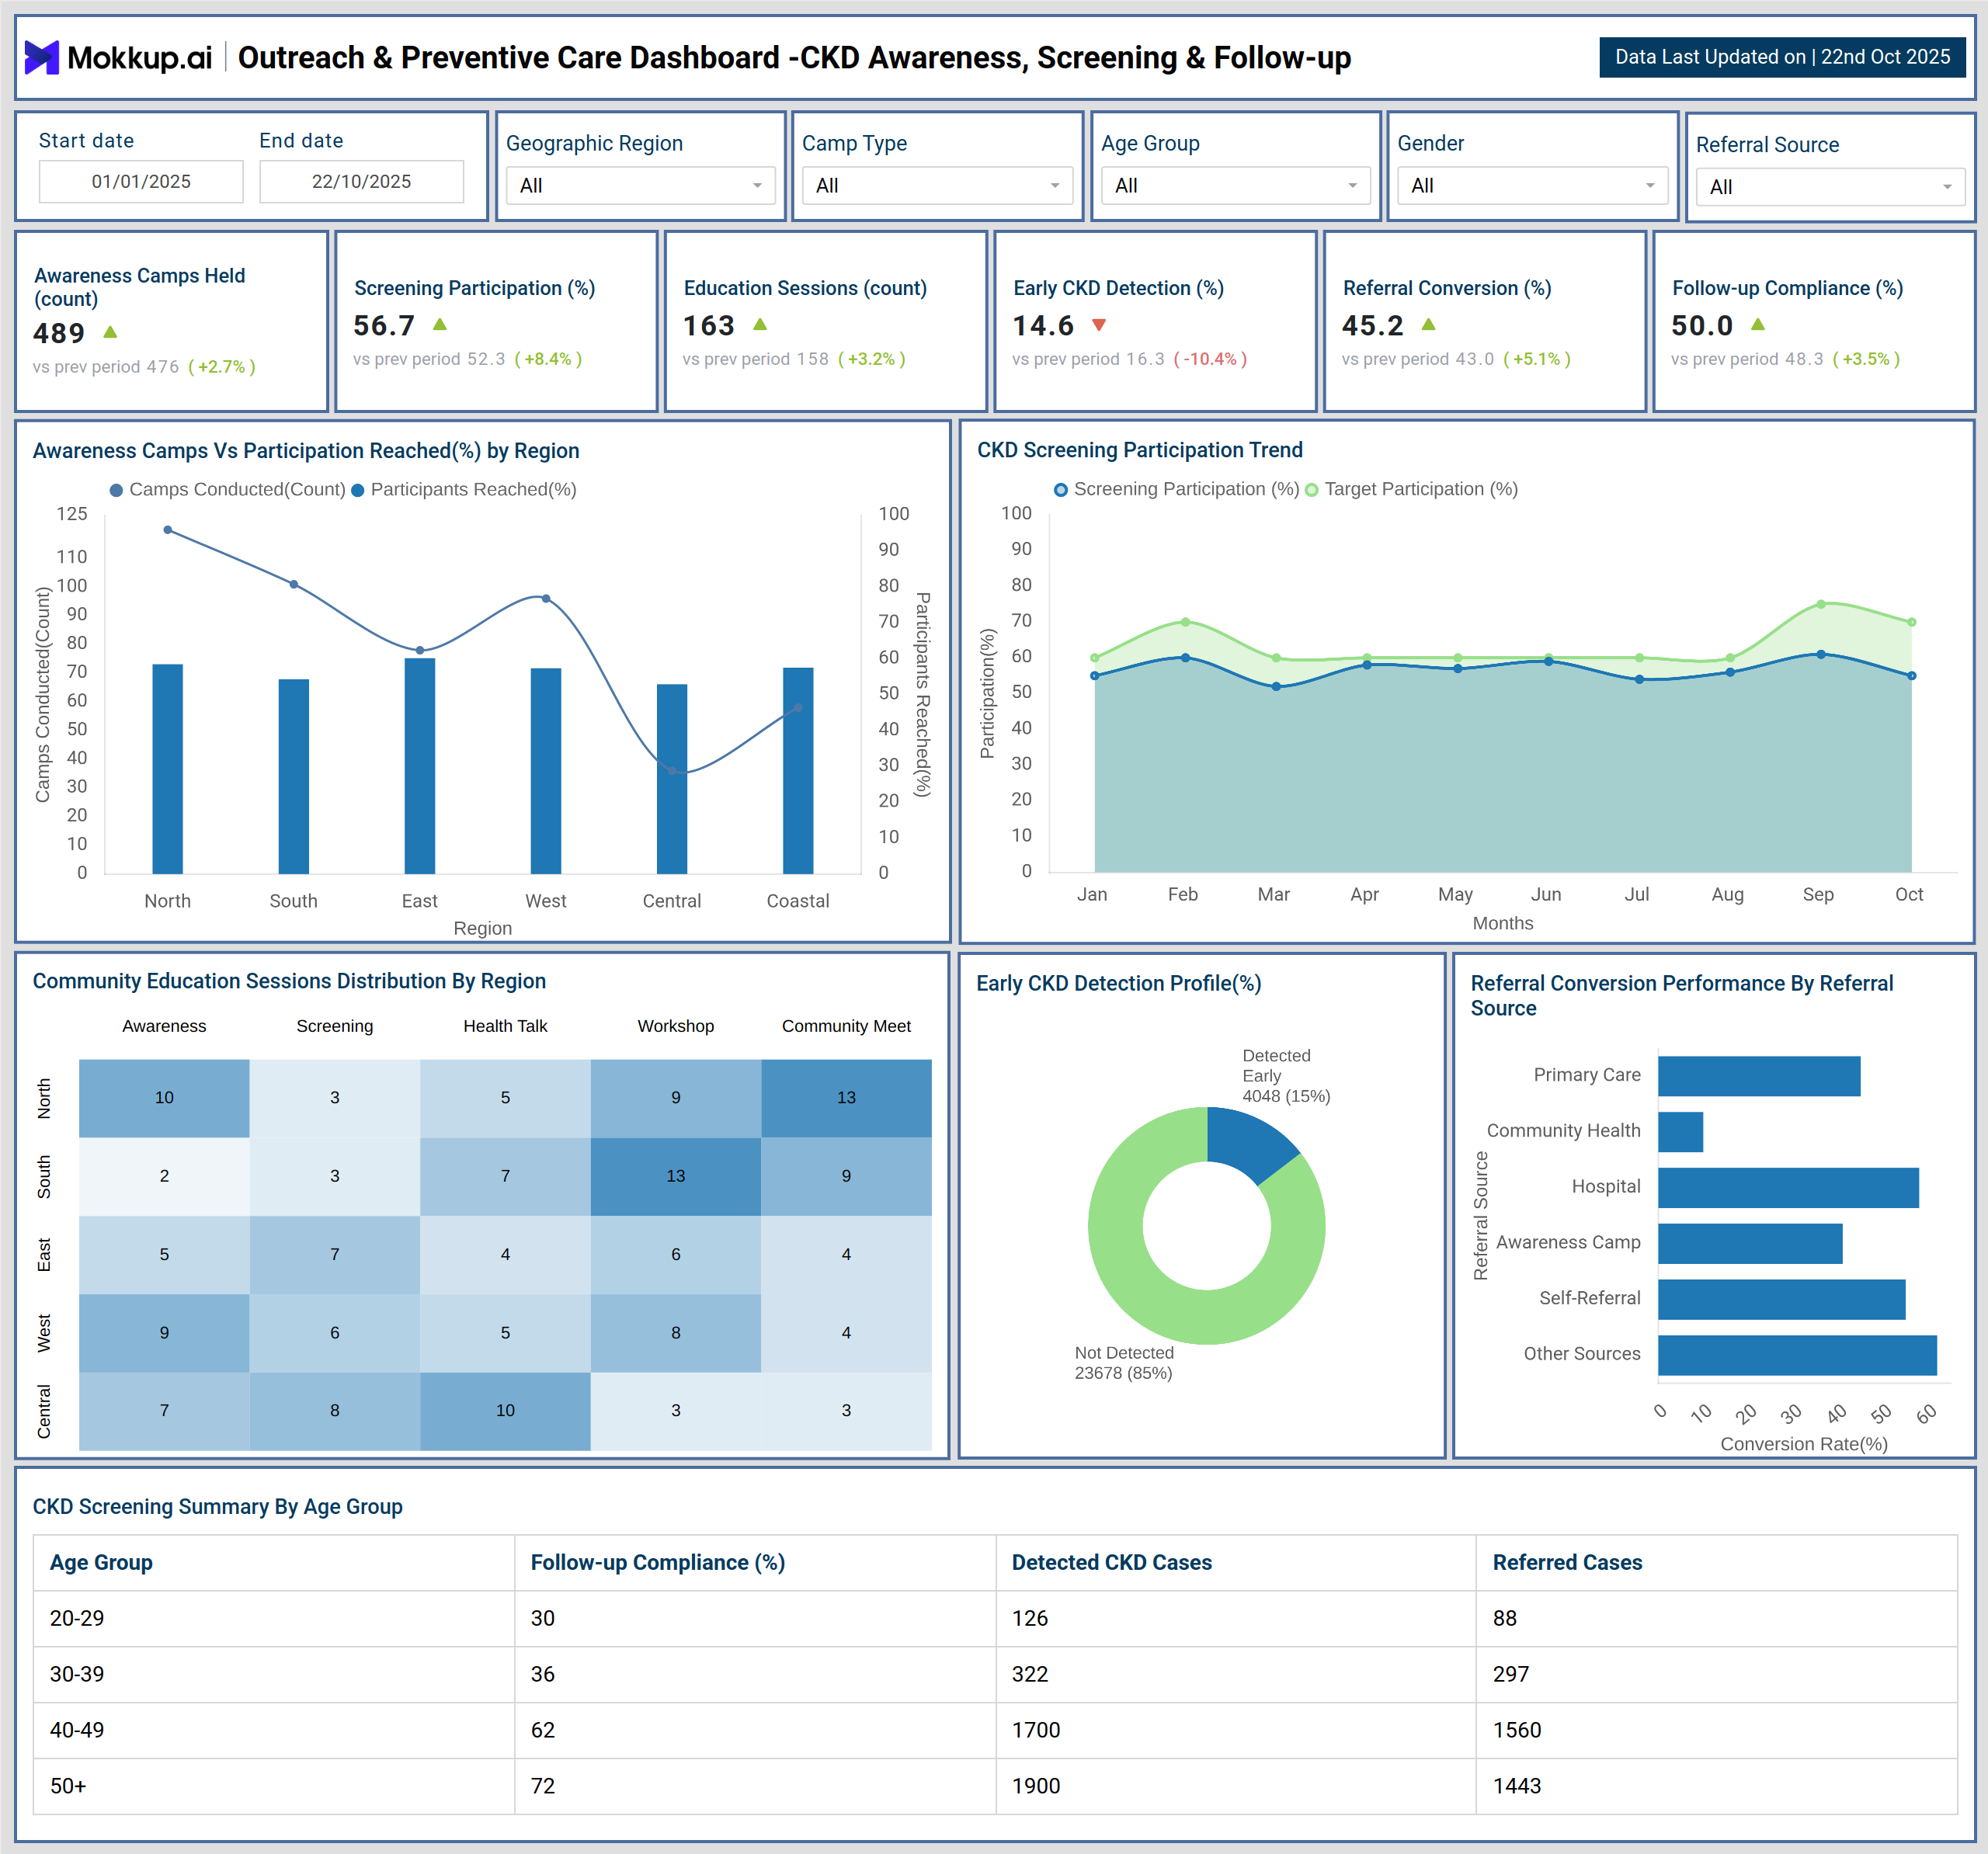
The Outreach & Preventive Care Dashboard template provides a comprehensive view of CKD awareness, screening, and follow-up performance across dialysis centers. For example, the dashboard displays preventive care program metrics such as the number of awareness camps conducted, CKD screening participation rate, community education sessions, early CKD detection percentage, referral conversion rate, and follow-up compliance. It highlights high-performing regions and outreach methods to help identify areas needing improvement and optimize program effectiveness. This dashboard also functions as a post-outreach follow-up compliance monitoring dashboard, providing detailed adherence metrics for patient follow-ups.
How to Analyze Data in an Outreach & Preventive Care Dashboard
Here’s how research centers can make the most of the data available on the Outreach & preventive care dashboard:
- Identify Program Trends – Evaluate awareness camp participation, CKD screening engagement, community education coverage, early detection rates, referral conversions, and follow-up compliance.
- Assess Outreach Efficiency – Compare campaign effectiveness across regions, age groups, and camp types to identify gaps and optimize resource allocation.
- Track Early Detection Trends – Monitor patients detected with early CKD to measure program effectiveness.
- Analyze Referral & Follow-up Performance – Track referral conversion rates and post-outreach follow-up adherence to identify high-impact campaigns.
- Detect Patterns & Anomalies – Apply filters by time period, region, camp type, age group, gender, or referral source to pinpoint underperforming segments and focus interventions.
Benefits of an Outreach & Preventive Care Dashboard
Here are the key benefits of an Outreach & Preventive Care Dashboard:
- Real-time insights: Provides real-time insights on outreach campaigns, CKD screening, and follow-up compliance
- Operational Efficiency: Enables fast data-driven decisions for improved preventive care program efficiency
- Campaign Performance Insights: Measures outreach impact and patient engagement for improved program execution.
- Targeted Preventive Care: Uses demographic and regional data to enhance CKD screening and community education strategies.
- Improved Follow-up Compliance: Improves transparency and accountability for stakeholders
KPIs to Track in Outreach & Preventive Care Dashboard
- Number of Awareness Camps Held - Shows overall outreach activity and campaign reach
- CKD Screening Participation Rate (%)- Tracks screening engagement per program
- Community Education Sessions Held- Measures patient education coverage
- Patients Detected with Early CKD (%) - Indicates program effectiveness in early CKD detection
- Referral Conversion Rate (%) -Tracks referrals generated from outreach campaigns
- Follow-up Compliance from Outreach (%) - Monitors adherence to post-outreach care
Frequently Asked Questions
What types of outreach and preventive care activities are tracked in this dashboard?
It tracks awareness campaigns, CKD screening participation, community education sessions, referral conversions, and follow-up compliance to give a complete view of program performance.
How does the dashboard help improve CKD screening participation?
By showing which campaigns drive the most engagement, you can optimize scheduling, target specific regions or demographics, and increase overall participation.
Why monitor referral conversion along with screening results?
Low conversions despite high screenings indicate gaps in patient follow-up or referral pathways, supporting program improvement. Referral conversion tracking in preventive care programs helps target these areas.