
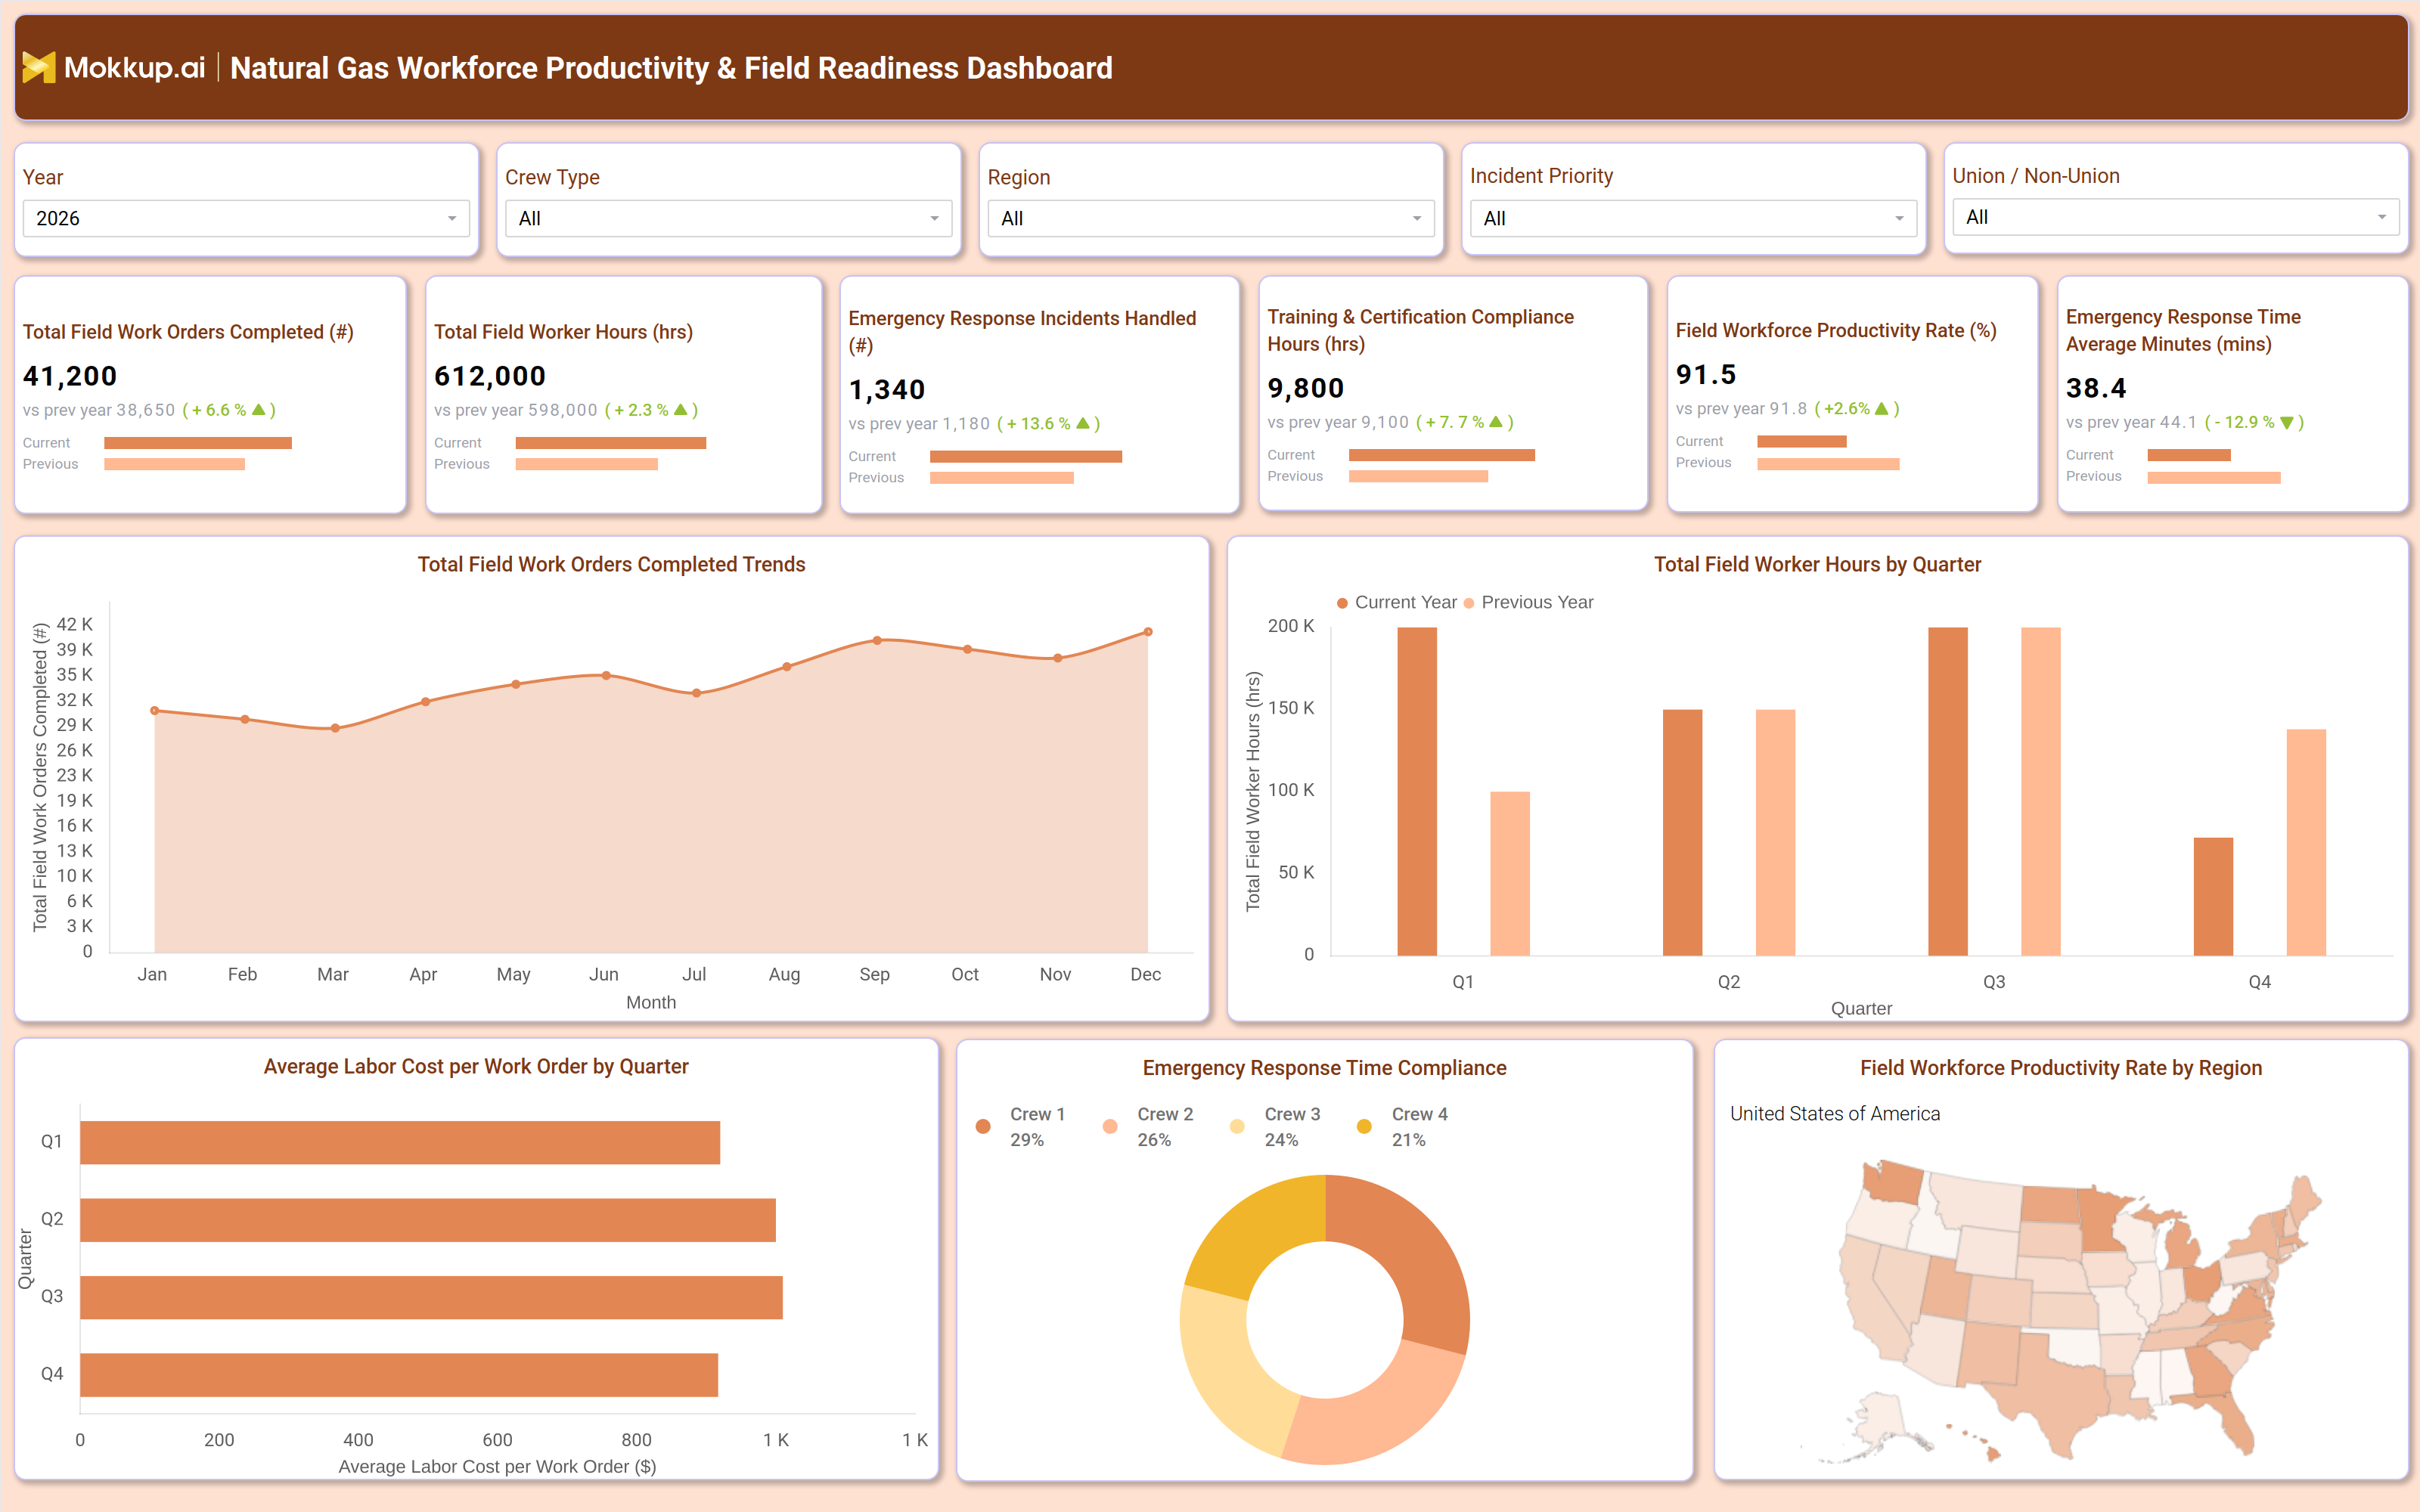
What is a Natural Gas Workforce Productivity & Field Readiness Dashboard?
A Natural Gas Workforce Productivity & Field Readiness Dashboard is a centralized analytical tool designed to help natural gas utilities and field operations teams monitor, measure, and improve the efficiency of their field workforce. It consolidates critical operational data from field work order volumes and labor hours to emergency response performance and training compliance into a single view that operations managers, field supervisors, and workforce planners can act on. By tracking natural gas field workforce metrics across regions, crew types, and time periods, the dashboard allows decision-makers to compare workforce productivity trends, identify bottlenecks in field readiness, and ensure that crews are trained, deployed, and responding to incidents efficiently. The dashboard also surfaces labor cost dynamics by quarter, helping finance and operations teams align workforce investments with service delivery goals. Whether a utility operates across multiple regions or manages a mix of union and non-union crews, this field workforce productivity dashboard provides the visibility needed to maintain high field productivity standards while keeping emergency response times within acceptable thresholds.
How to Create a Natural Gas Workforce Productivity & Field Readiness Dashboard
You don't need to build your report from scratch; just start with a ready-to-use dashboard template from Mokkup. Add in your data and export it however you like. Here's how to do it:
1. Create or Log in to Your Mokkup Account
Start by signing up on Mokkup.ai using your email. If you already have an account, just log in, and you'll be good to go.
2. Choose and Customize Your Dashboard Template
Find the Natural Gas Workforce Productivity & Field Readiness Dashboard template in the Templates section. Use the drag-and-drop editor to adjust KPIs, edit filters, or add elements based on your data.
3. Export to Your BI Tool
Once your dashboard wireframe is ready, use the BI Tool Export feature to send it directly to Power BI or Tableau for further analysis and enhancements. You can also download the dashboard as a PDF, PNG, or JPEG, embed it on a platform, or invite your team to collaborate.
Note: This is a Pro template. You'll need a Pro subscription on Mokkup to use and customize this dashboard wireframe. Upgrade anytime to unlock full access.
Natural Gas Workforce Productivity & Field Readiness Dashboard Example
A regional natural gas utility adopted a field workforce productivity dashboard to gain clear visibility into field crew performance. Operations managers tracked work order completion trends and crew type filters to spot underperforming crews, comparing current- and prior-year hours to measure whether workforce expansion improved output. As the utility expanded territories, planners used regional productivity maps alongside natural gas field workforce metrics on training and certification to confirm that higher training investment correlated with better outcomes, supporting natural gas crew performance tracking and budget decisions.
Emergency response teams relied on emergency response compliance natural gas data by crew category, incident priority, and union status to guide scheduling and crew allocation. Finance monitored labor cost trends, while HR used the field worker training certification dashboard to align certification pace with expansion. Together, these tools helped sustain the utility's workforce productivity rate, natural gas utility benchmarks quarter after quarter.
How to Analyze Data in a Natural Gas Workforce Productivity & Field Readiness Dashboard
Here is how you can analyze data from this dashboard:
- Filter by Crew Type to compare productivity rates and work order completion volumes across different crew categories.
- Use the Region filter alongside the field workforce productivity rate map to prioritize resource deployment in lower-performing service areas.
- Track the monthly work order completion trend to identify seasonal dips and plan crew capacity accordingly.
- Compare current-year versus previous-year field worker hours by quarter to measure the impact of workforce changes.
- Analyze the emergency response time compliance chart by crew to identify teams needing scheduling or process adjustments.
- Review average labor cost per work order by quarter to detect cost inefficiencies even when productivity metrics appear strong.
- Cross-filter by Incident Priority to assess whether high-priority incidents are being handled within acceptable response timeframes.
- Monitor training and certification compliance hours alongside productivity rates to evaluate the return on workforce development investments.
- Use the Union/Non-Union filter to assess productivity and cost differences between workforce classifications.
- Track period-over-period changes in the KPI cards to identify early warning signals before they become operational issues.
Benefits of a Natural Gas Workforce Productivity & Field Readiness Dashboard
The following are the benefits of using this dashboard:
- Provides a single consolidated view of field workforce performance, eliminating the need to reconcile data from multiple systems.
- Enables faster identification of underperforming regions or crews before issues affect service delivery.
- Supports data-driven workforce planning by surfacing trends in labor hours, work order volumes, and productivity rates.
- Helps compliance teams track training certification progress and flag gaps before regulatory deadlines.
- Reduces emergency response risk by making crew-level compliance patterns visible and actionable.
- Allows finance and operations teams to monitor labor cost per work order trends and contain workforce spending.
- Gives HR and workforce planners a geographic view of productivity to inform hiring and deployment strategies.
- Improves accountability in field operations by standardizing natural gas field workforce metrics across regions and crew types.
- Shortens monthly operations review cycles by providing pre-built, filterable visualizations.
- Scales across multi-region utilities, managing diverse crew structures and union classifications.
KPIs to Track in a Natural Gas Workforce Productivity & Field Readiness Dashboard
The following key KPIs can be tracked by using this dashboard:
- Total Field Work Orders Completed (count) : the total number of field work orders successfully closed in a given period, reflecting overall crew output and operational throughput.
- Total Field Worker Hours (hrs): the aggregate hours logged by all field workers, used to assess labor utilization and capacity relative to work order volumes.
- Emergency Response Incidents Handled(count): the count of emergency incidents managed by field crews, indicating demand on emergency response resources.
- Training & Certification Compliance Hours (hrs): the total hours invested in crew training and certification, reflecting readiness levels and regulatory compliance status a core metric in any field worker training certification dashboard.
- Field Workforce Productivity Rate (%) : a percentage measure of how efficiently field workers complete assigned tasks relative to available capacity, the central metric for natural gas crew performance tracking.
- Emergency Response Time Average (mins): the average time taken to respond to emergency incidents, a critical indicator of field readiness and service reliability used to assess emergency response compliance with natural gas standards.
- Average Labor Cost per Work Order ($): Finance leads use this chart to track labor cost efficiency trends, identify cost spikes, and investigate overtime usage, crew mix, or regional wage variations across quarters.
Frequently Asked Questions
1. Who should use a Natural Gas Workforce Productivity & Field Readiness Dashboard?
This dashboard is built for operations managers, field supervisors, workforce planners, and HR leaders in natural gas utilities. It is also useful for finance teams that need to track labor costs alongside field productivity metrics to ensure workforce investments are delivering results.
2. Can this dashboard help track natural gas field workforce metrics across multiple regions?
Yes. The field workforce productivity rate by region map allows teams to compare natural gas field workforce metrics across different service territories simultaneously. Combined with crew type and union/non-union filters, it provides a granular view of regional workforce performance.
3. How does the dashboard support emergency response monitoring in field operations?
The emergency response time compliance chart breaks down response performance by crew, making it straightforward to identify which teams meet targets and which fall short. Filtering by incident priority and region adds further context to support operational adjustments and field readiness planning aligned with emergency response compliance natural gas requirements.