
What is a Natural Gas Transmission Revenue, Tariff Recovery & Cost Efficiency Dashboard?
A Natural Gas Transmission Revenue, Tariff Recovery & Cost Efficiency Dashboard is a data-driven analytics platform designed to monitor financial performance, regulatory compliance, and operational efficiency in natural gas pipeline networks. It consolidates key metrics such as transported gas volume, tariff revenue, operations and maintenance (O&M) expenses, regulatory credits, and cost efficiency ratios into a single interface. This dashboard helps pipeline operators, utility companies, and energy regulators track revenue trends, optimize tariff recovery rates, and identify cost-saving opportunities. By integrating financial, operational, and regulatory data, the dashboard provides actionable insights for improving pipeline profitability while ensuring compliance with Federal Energy Regulatory Commission (FERC) and other regulatory standards. It enables stakeholders to assess pipeline segment performance, compare regional efficiency, and make data-backed decisions for long-term financial sustainability.
How to Create a Natural Gas Transmission Revenue, Tariff Recovery & Cost Efficiency Dashboard
You don't need to build your report from scratch, just start with a ready-to-use dashboard template from Mokkup. Add in your data and export it however you like. Here's how to do it:
1. Create or Log in to Your Mokkup Account
Start by signing up on Mokkup.ai using your email. If you already have an account, just log in, and you'll be good to go.
2. Choose and Customize Your Dashboard Template
Find the Natural Gas Transmission Revenue, Tariff Recovery & Cost Efficiency Dashboard template in the Templates section. Use the drag-and-drop editor to adjust KPIs, edit filters, or add elements based on your data.
3. Export to Your BI Tool
Once your dashboard wireframe is ready, use the BI Tool Export feature to send it directly to Power BI or Tableau for further analysis and enhancements. You can also download the dashboard as a PDF, PNG, or JPEG, embed it on a platform, or invite your team to collaborate.
Note: This is a Pro template. You'll need a Pro subscription on Mokkup to use and customize this dashboard wireframe. Upgrade anytime to unlock full access.
Natural Gas Transmission Revenue, Tariff Recovery & Cost Efficiency Dashboard Example
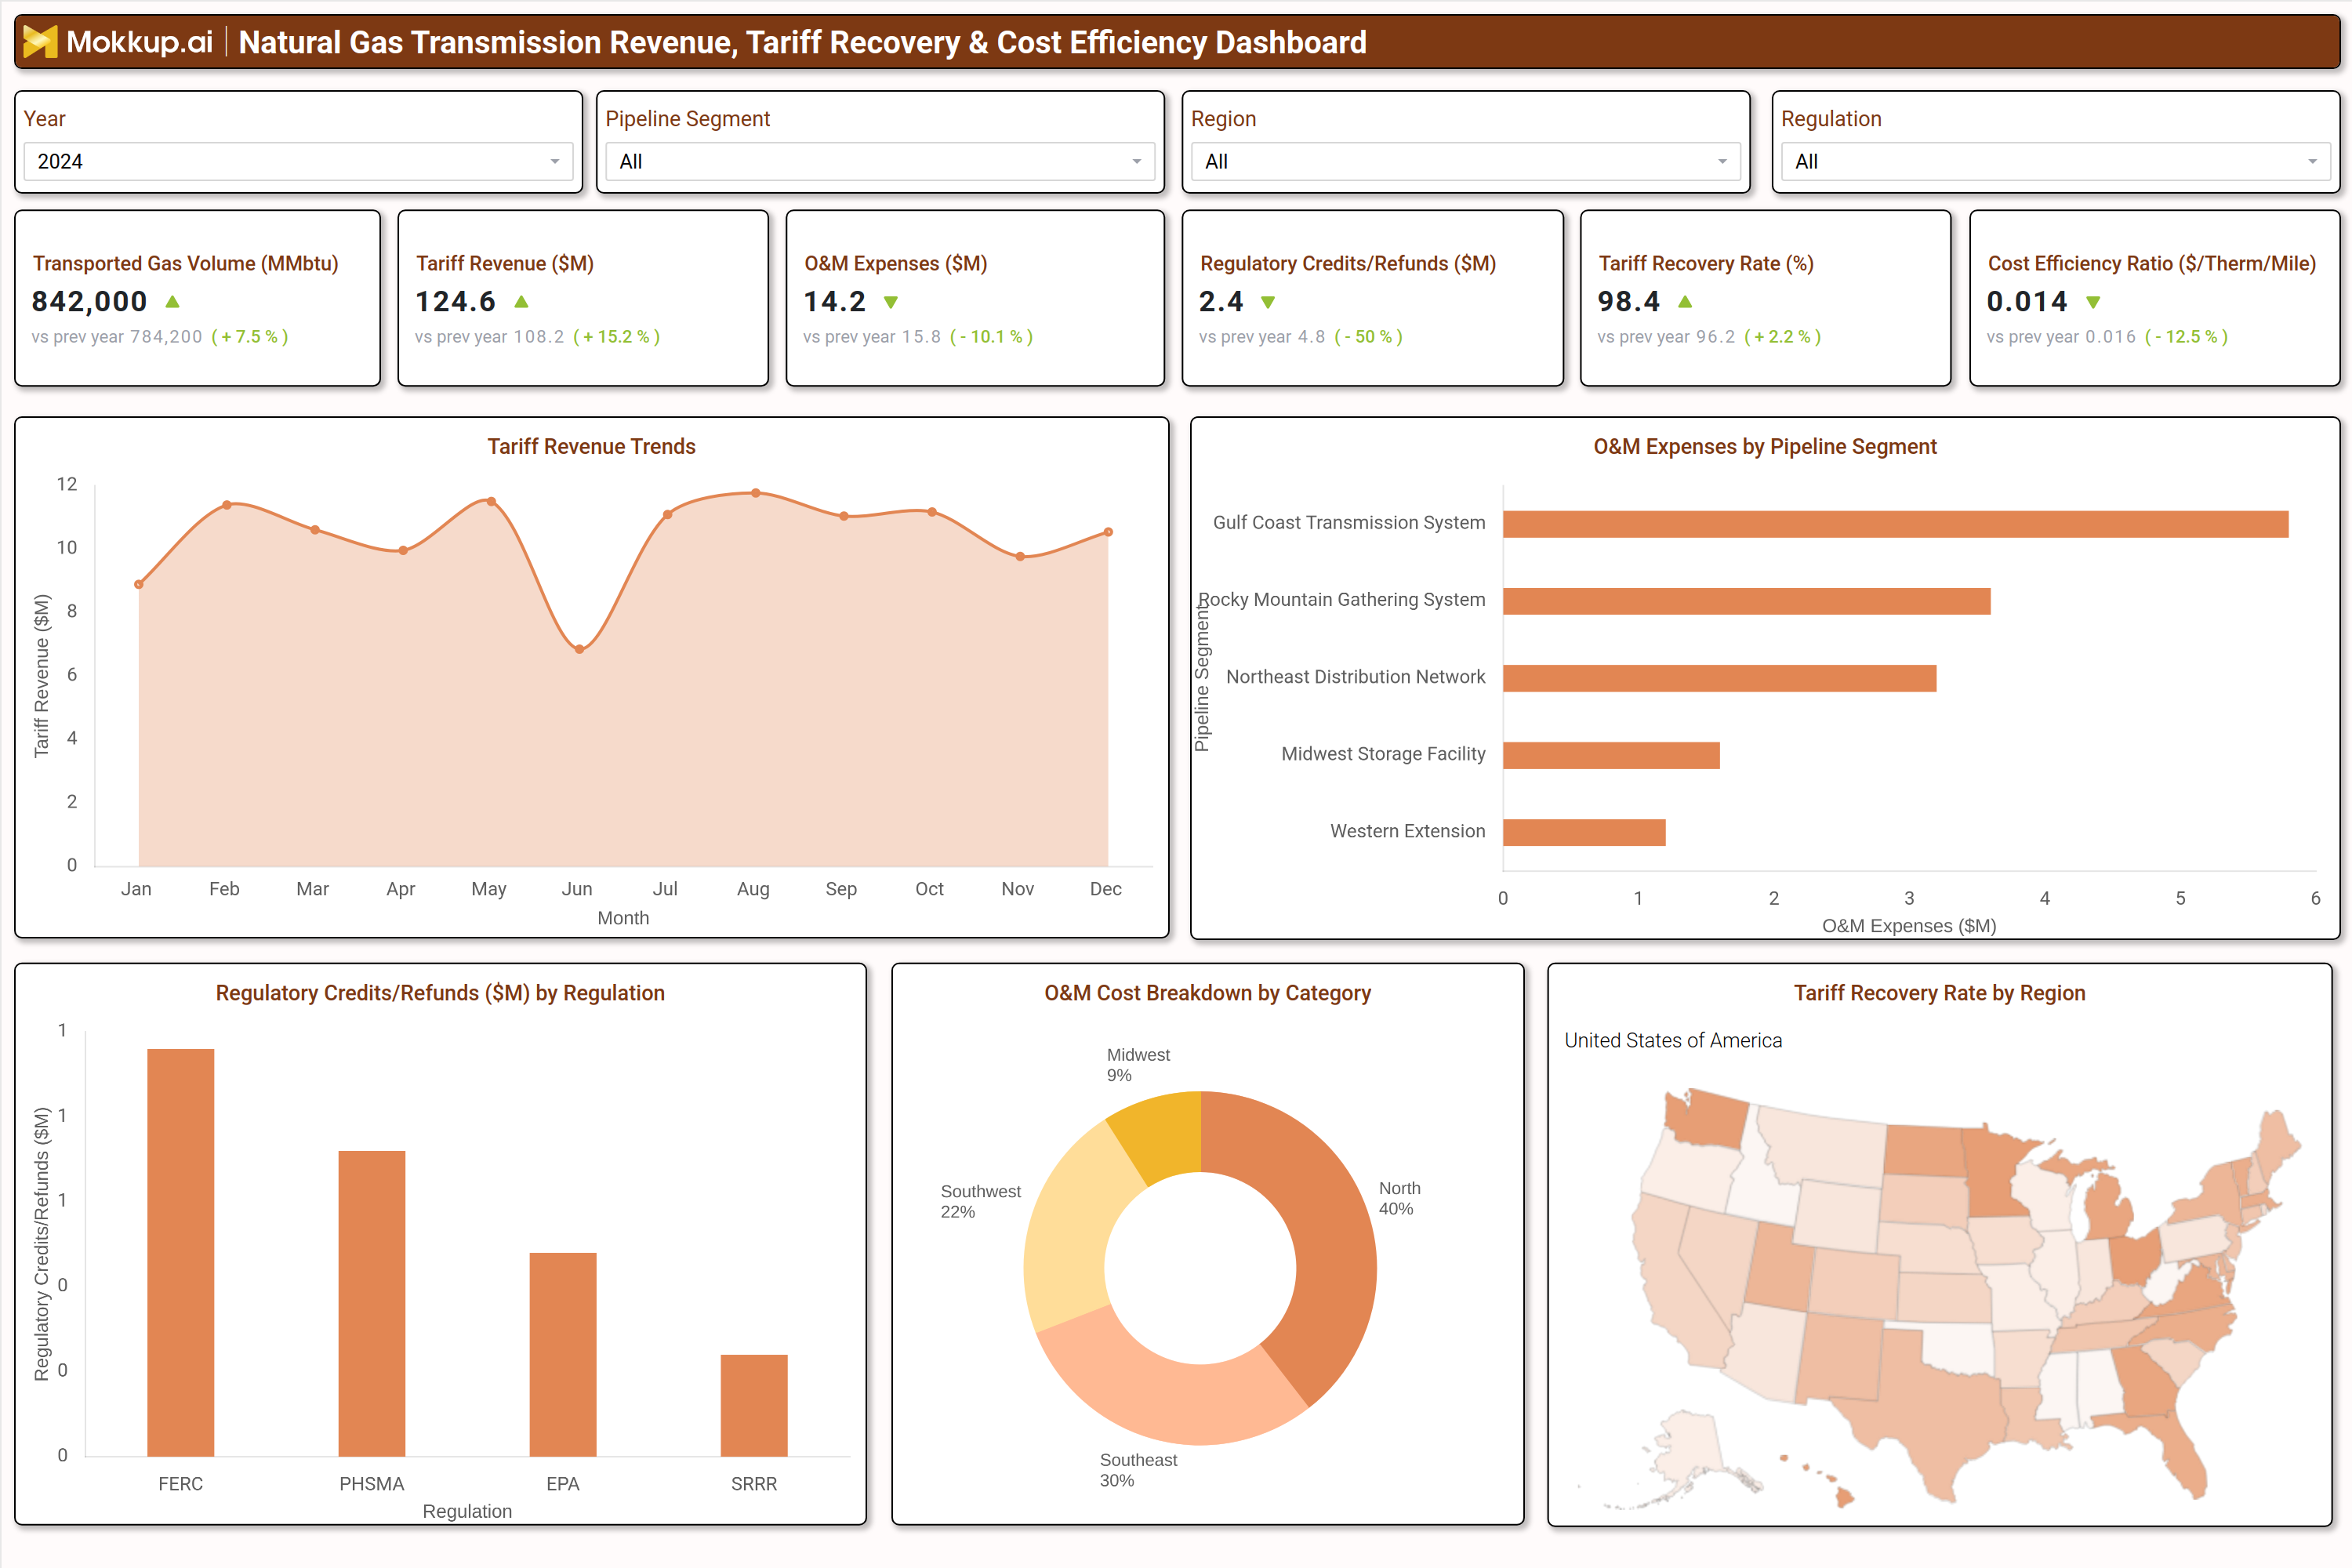
A well-structured Natural Gas Transmission Revenue, Tariff Recovery & Cost Efficiency Dashboard includes interactive filters for year, pipeline segment, region, and regulation type. Key performance tiles display transported gas volume (MMBtu), tariff revenue ($M), O&M expenses ($M), regulatory credits/refunds ($M), tariff recovery rate (%), and cost efficiency ratio ($/Therm/Mile). Trend charts show monthly or yearly revenue fluctuations, while bar graphs break down O&M expenses by pipeline segment. A regulatory credits breakdown highlights compliance with FERC, PHMSA, EPA, and other agencies. A cost efficiency pie chart categorizes O&M expenses into compression, integrity management, maintenance, fuel/loss, and other operational costs. A geographic heatmap visualizes tariff recovery rates by region, helping operators identify underperforming areas. Together, these components create a comprehensive financial monitoring system for natural gas transmission networks.
How to Analyze Data in a Natural Gas Transmission Revenue, Tariff Recovery & Cost Efficiency Dashboard
Here is how you can analyze data from this gas utility regulatory dashboard:
- Transported Gas Volume Trends: Track gas transportation volumes over time to assess pipeline utilization, identify demand fluctuations, and support capacity planning.
- Tariff Revenue Growth: Monitor tariff revenue against previous periods to evaluate financial performance, measure growth trends, and identify revenue improvement opportunities.
- O&M Expenses by Pipeline Segment: Compare operations and maintenance expenses across pipeline segments to identify high-cost areas and optimize resource allocation.
- Regulatory Credits and Refunds: Review regulatory credits and refunds to ensure compliance with regulations, maximize financial incentives, and maintain accurate reporting.
- Tariff Recovery Rates: Analyze tariff recovery rates to measure revenue collection efficiency, monitor payment performance, and ensure regulatory adherence.
- Cost Efficiency Ratios: Assess operational spending per therm per mile to benchmark cost efficiency and identify opportunities to improve financial performance.
- O&M Cost Breakdown by Category: Break down expenses across compression, integrity management, maintenance, and other categories to prioritize cost-reduction initiatives and improve budget control.
- Regional Revenue and Efficiency Comparison: Compare revenue generation and operational efficiency across regions to identify geographic disparities, share best practices, and drive performance improvements.
Benefits of a Natural Gas Transmission Revenue, Tariff Recovery & Cost Efficiency Dashboard
The following are the benefits of using this compression cost tracking dashboard:
- Enhanced Financial Visibility: Track revenue, operating expenses, and regulatory metrics in a unified view to gain comprehensive insight into pipeline financial performance.
- Optimized Tariff Recovery Rates: Monitor and improve tariff recovery to maximize revenue collection while ensuring adherence to regulatory requirements.
- Reduced Operational Costs: Identify inefficiencies in operations and maintenance (O&M) spending to lower costs and improve overall operational efficiency.
- Improved Regulatory Compliance: Track compliance with regulatory requirements and reporting obligations to ensure adherence to industry standards and minimize compliance risks.
- Data-Driven Decision Making: Provide actionable insights to support informed decisions related to pipeline investments, budgeting, and long-term financial planning.
- Performance Benchmarking Across Segments and Regions: Compare the performance of pipeline segments and geographic regions to identify improvement opportunities and promote best practices.
- Streamlined Stakeholder Reporting: Simplify reporting processes by providing accurate and timely information for stakeholders, regulators, and investors in a centralized format.
KPIs to Track in a Natural Gas Transmission Revenue, Tariff Recovery & Cost Efficiency Dashboard
The following key KPIs can be tracked by using this energy infrastructure cost efficiency monitoring dashboard:
- Transported Gas Volume (MMBtu): Measures total natural gas transported through pipelines.
- Tariff Revenue ($M): Tracks revenue generated from pipeline tariffs.
- O&M Expenses ($M): Monitors operations and maintenance costs.
- Regulatory Credits/Refunds ($M): Tracks financial incentives or penalties from regulatory bodies.
- Tariff Recovery Rate (%): Indicates the percentage of billed tariffs successfully collected.
- Cost Efficiency Ratio ($/Therm/Mile): Evaluates operational spending efficiency per unit of gas transported.
Frequently Asked Questions
1. What is a natural gas transmission financial performance dashboard?
A natural gas transmission revenue tracking dashboard monitors pipeline financial performance, including tariff revenue, O&M expenses, and regulatory compliance.
2. What data sources feed this natural gas transmission revenue tracking dashboard?
Pipeline SCADA systems, financial ERP software, regulatory filings, and operational expense reports.
3. Who should use a natural gas transmission financial performance dashboard?
Pipeline operators, utility executives, financial analysts, and regulatory compliance teams.