What is a Hydrogen Blend Gas Pipeline Integrity and Degradation Risk Dashboard?
The Hydrogen Blend Gas Pipeline Integrity and Degradation Risk Dashboard is a structured monitoring tool designed for pipeline operators, asset integrity engineers, and maintenance teams managing hydrogen-blended gas infrastructure. It consolidates critical inspection, degradation, and operational data into a single view covering metrics from wall loss rates and leak incidents to inspection compliance and maintenance backlog. The dashboard includes filters for pipeline class, material type, inspection method, and date range, giving teams precise control over the data they analyze. By tracking hydrogen-blend pipeline degradation risk indicators over time, this dashboard supports informed maintenance scheduling, regulatory compliance, and failure-prevention decisions.
How to Create a Hydrogen Blend Gas Pipeline Integrity and Degradation Risk Dashboard
You don't need to build your report from scratch—just start with a ready-to-use dashboard template from Mokkup. Add in your data and export it however you like. Here's how to do it:
1. Create or Log in to Your Mokkup Account
Start by signing up on Mokkup.ai using your email. If you already have an account, just log in, and you'll be good to go.
2. Choose and Customize Your Dashboard Template
Find the Hydrogen Blend Gas Pipeline Integrity and Degradation Risk Dashboard template in the Templates section. Use the drag-and-drop editor to adjust KPIs, edit filters, or add elements based on your data.
3. Export to Your BI Tool
Once your dashboard wireframe is ready, use the BI Tool Export feature to send it directly to Power BI or Tableau for further analysis and enhancements. You can also download the dashboard as a PDF, PNG, or JPEG, embed it on a platform, or invite your team to collaborate.
Note: This is a Pro template. You'll need a Pro subscription on Mokkup to use and customize this dashboard wireframe. Upgrade anytime to unlock full access.
Hydrogen Blend Gas Pipeline Integrity and Degradation Risk Dashboard Example
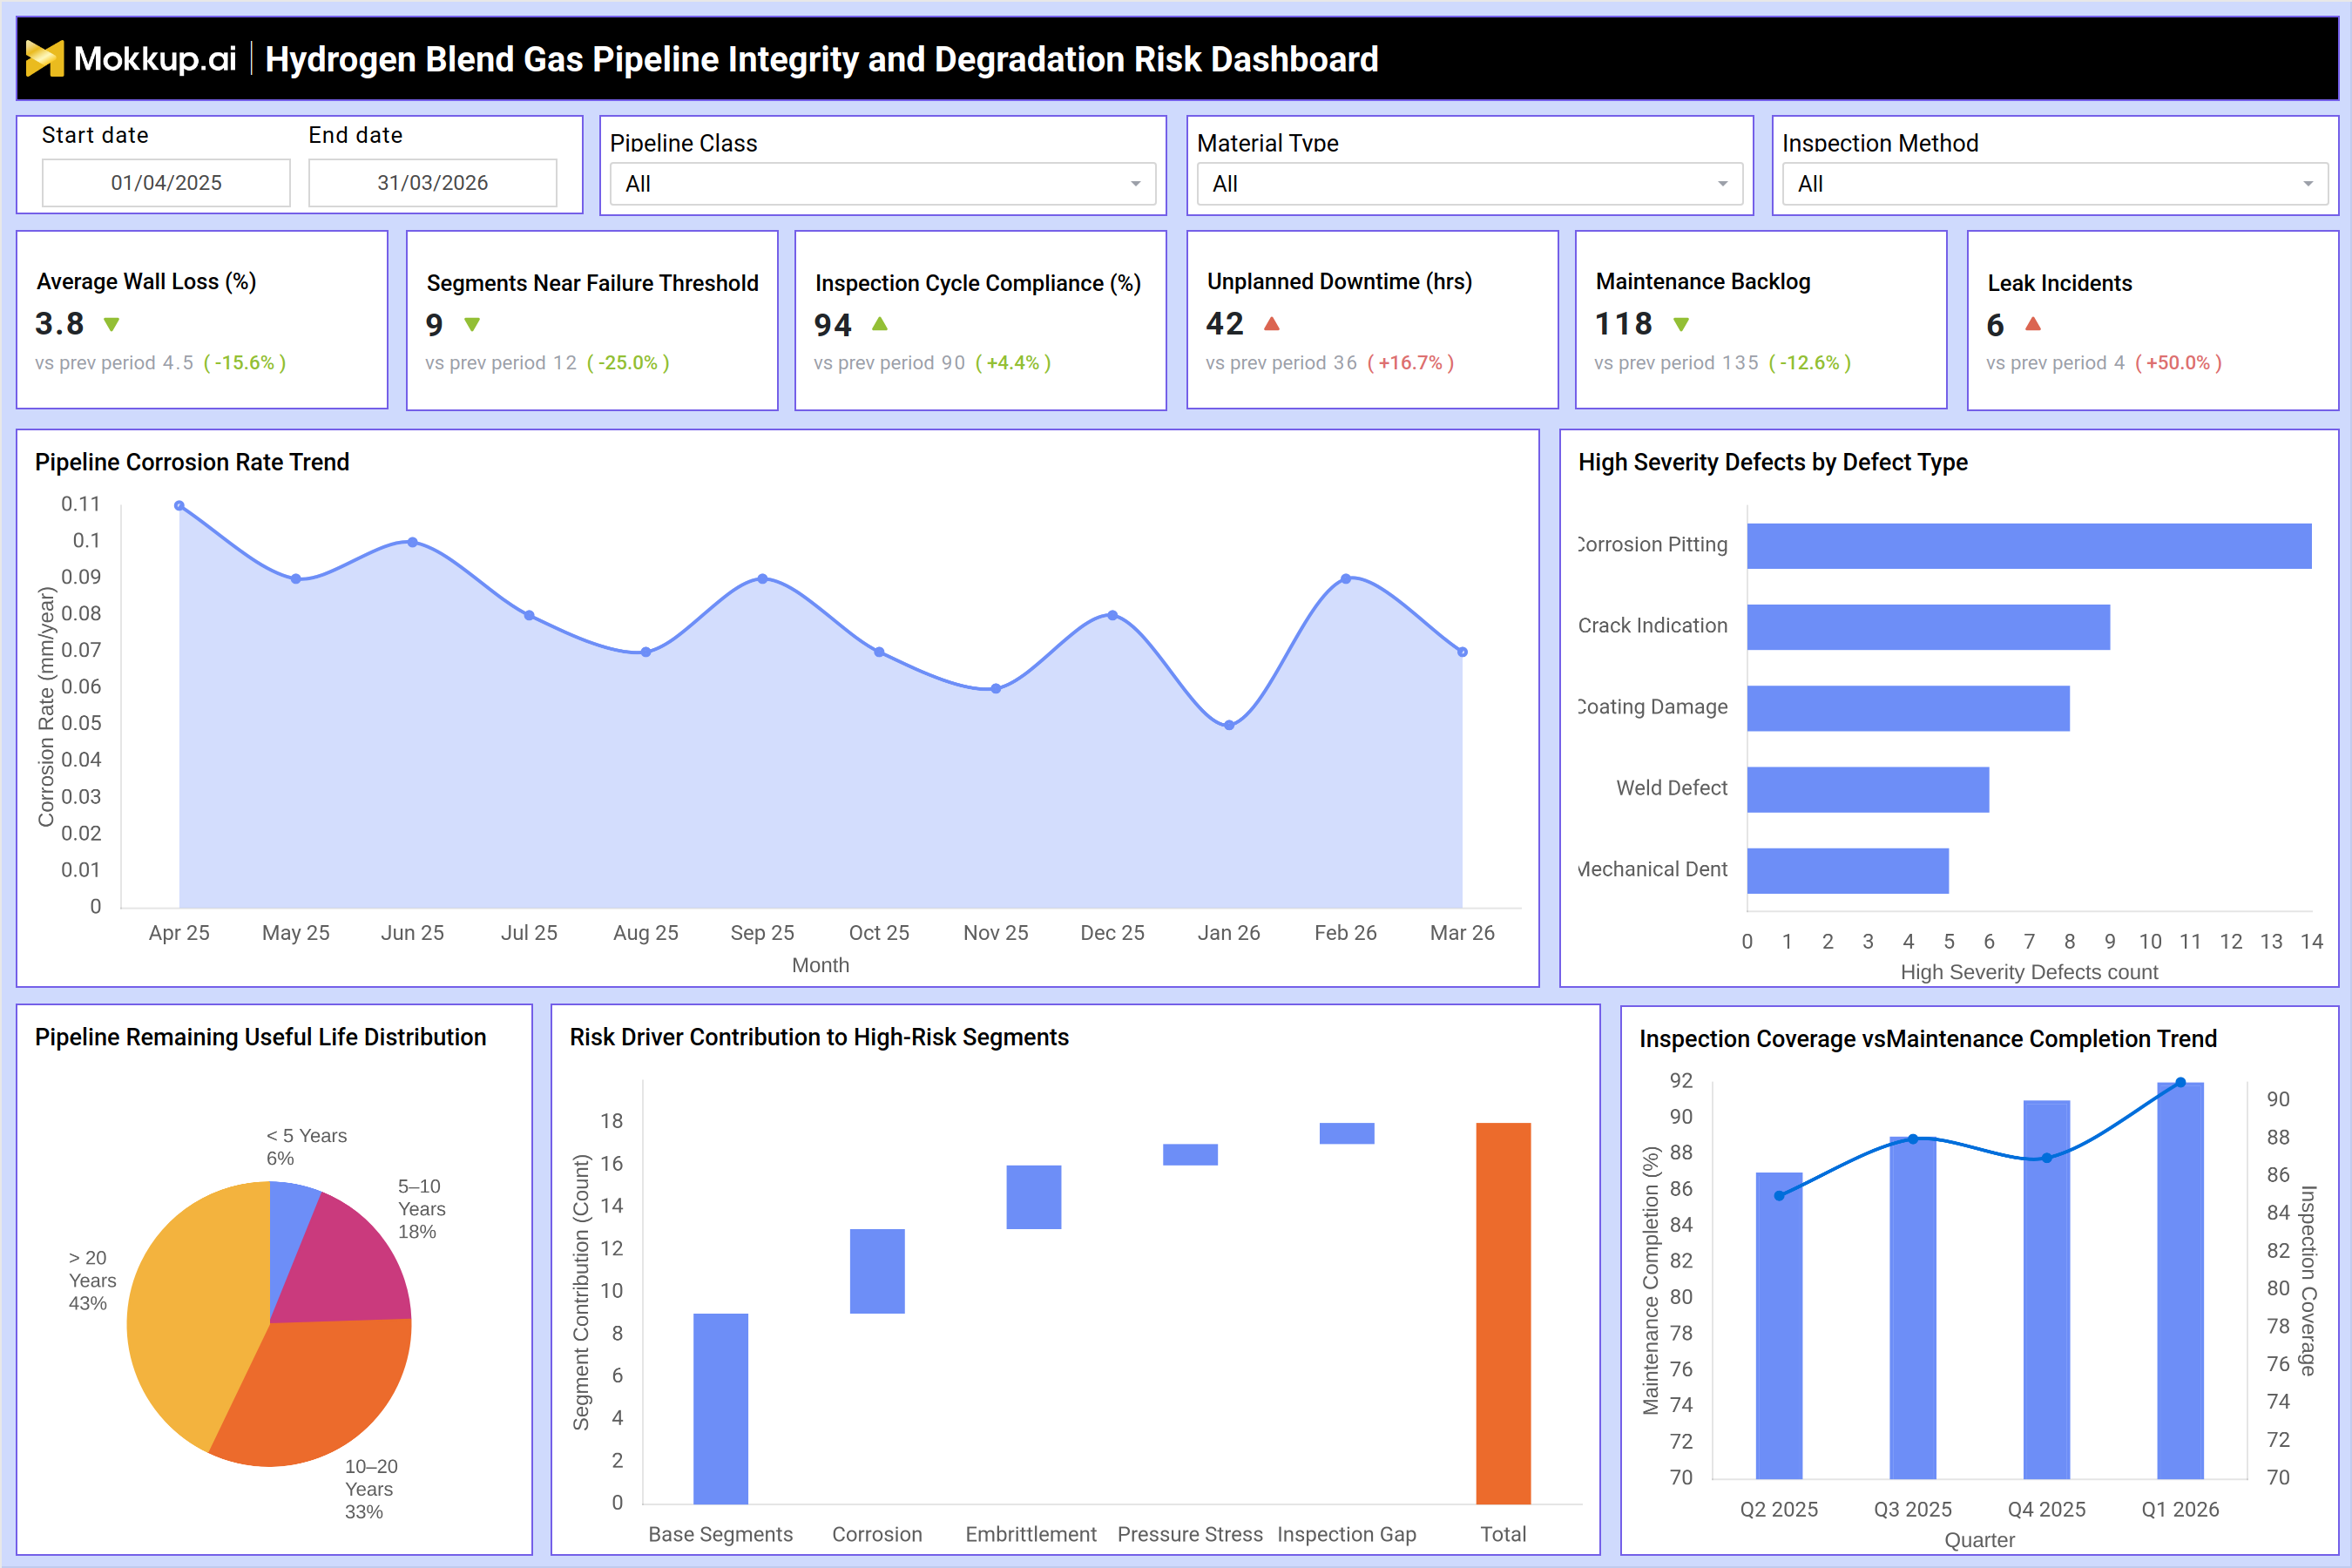
A pipeline integrity team at an energy utility uses this dashboard to manage its hydrogen blend gas pipeline degradation risk across an aging network. At the start of each week, the team filters by pipeline class and inspection method to narrow down high-priority segments, then reviews the six KPI tiles at the top. If the Segments Near Failure Threshold count has risen or inspection cycle compliance has dropped, the team escalates those routes for immediate inspection scheduling. The average wall loss percentage and leak incident figures together provide a quick read on whether corrosion-related degradation is accelerating or stabilizing across the monitored network.
Mid-month, the team consults the Pipeline Corrosion Rate Trend chart to identify whether monthly corrosion rates are following a predictable seasonal pattern or spiking unexpectedly. They cross-reference this against the High Severity Defects by Defect Type bar chart, which categorizes defects such as corrosion pitting, crack indication, coating damage, weld defects, and mechanical dents. This combination helps prioritize which defect categories need immediate remediation versus those that can be scheduled into the next maintenance cycle. For longer-term asset planning, the team uses the gas pipeline remaining useful life distribution view to understand how many pipeline segments fall into critical life ranges, particularly those under five years of remaining life. The Risk Driver Contribution to High-Risk Segments chart adds context by showing which risk factors — such as base segment conditions, corrosion, embrittlement, pressure stress, or inspection gaps, contribute most to segment risk. Finally, the Inspection Coverage vs Maintenance Completion Trend chart tracks quarter-over-quarter alignment between inspection activity and maintenance execution, ensuring hydrogen blend gas pipeline inspection monitoring stays in sync with field operations.
How to Analyze Data in a Hydrogen Blend Gas Pipeline Integrity and Degradation Risk Dashboard
Here is how you can analyze data from this dashboard:
- Use the date range, pipeline class, material type, and inspection method filters to scope data to specific segments or time periods before concluding.
- Monitor Average Wall Loss (%) alongside Segments Near Failure Threshold to assess whether degradation is approaching critical thresholds across the network.
- Review the Pipeline Corrosion Rate Trend to identify months where corrosion rates deviate from the baseline and align those spikes with field events or environmental factors.
- Use the High Severity Defects by Defect Type chart to rank defect categories and prioritize pipeline integrity assessment for high-risk segments by severity.
- Analyze the Risk Driver Contribution to High-Risk Segments chart to determine whether inspection gaps or material-related risks, such as embrittlement and pressure stress, are the primary drivers.
- Track Inspection Coverage vs Maintenance Completion Trend quarterly to ensure inspection rates are not outpacing maintenance follow-through.
- Use the Pipeline Remaining Useful Life Distribution to flag segments in the under-five-year remaining life bracket for accelerated inspection or replacement planning.
Benefits of a Hydrogen Blend Gas Pipeline Integrity and Degradation Risk Dashboard
The following are the benefits of using this dashboard:
- Consolidates degradation, inspection, and maintenance data into one structured view, reducing time spent aggregating reports from multiple sources.
- Supports pipeline integrity assessment for high-risk segments, surfacing failure-threshold segments and high-severity defect categories before they escalate.
- Enables data-driven maintenance scheduling by linking corrosion trend data with backlog counts and downtime hours.
- Tracks hydrogen blend pipeline degradation risk tracking indicators systematically, giving operators early warning signals without manual monitoring.
- Improves regulatory reporting readiness by maintaining a consistent record of inspection cycle compliance and maintenance completion rates.
- Provides an audit-ready view of inspection coverage and defect history for pipeline class and material type segments.
KPIs to Track in a Hydrogen Blend Gas Pipeline Integrity and Degradation Risk Dashboard
The following key KPIs can be tracked by using this dashboard:
- Average Wall Loss (%): Measures the percentage reduction in pipeline wall thickness due to corrosion or mechanical wear — a core indicator of structural degradation severity.
- Segments Near Failure Threshold: Counts pipeline segments whose degradation metrics have reached or are approaching the defined failure boundary, flagging those requiring immediate attention.
- Inspection Cycle Compliance (%): Tracks the percentage of scheduled inspection cycles completed on time — a key metric for hydrogen blend gas pipeline inspection monitoring and regulatory adherence.
- Unplanned Downtime (hrs): Records total hours of unscheduled pipeline outages, reflecting the operational impact of integrity failures or emergency maintenance actions.
- Maintenance Backlog: Tracks the number of maintenance tasks that are overdue or pending, part of the pipeline maintenance backlog and downtime KPI dashboard view that keeps field teams accountable.
- Leak Incidents: Counts detected pipeline leaks within the monitoring period — a direct indicator of pipeline failure risk and safety exposure.
Frequently Asked Questions
1. What types of pipeline defects does this dashboard track?
The dashboard tracks five defect categories visible in the High Severity Defects by Defect Type chart: corrosion pitting, crack indication, coating damage, weld defects, and mechanical dents. These cover the primary failure modes associated with hydrogen blend gas infrastructure.
2. Can this dashboard support hydrogen blend pipeline degradation risk tracking over multiple quarters?
Yes. The Inspection Coverage vs Maintenance Completion trend chart covers multiple quarters, and the pipeline corrosion rate trend analysis dashboard provides monthly granularity. Teams can use the date range filter to extend or narrow the analysis window as needed.
3. How does this dashboard help with pipeline integrity assessment for high-risk segments?
The Risk Driver Contribution to High-Risk Segments chart breaks down which factors — such as corrosion, embrittlement, pressure stress, inspection gaps, or base segment conditions — push segments into high-risk categories. Combined with segments near the failure threshold and average wall loss data, teams can prioritize segment-level interventions with supporting evidence.