What is a Natural Gas Transmission Pipeline Safety & Emergency Response Dashboard?
A Natural Gas Transmission Pipeline Safety & Emergency Response Dashboard is a centralized analytics platform designed to monitor, analyze, and respond to safety incidents in gas transmission and distribution networks. It consolidates data from leak detection systems, emergency drills, third-party damage reports, and regulatory compliance metrics into a single interface. This dashboard helps gas utilities, pipeline operators, and emergency response teams assess risks, track incident trends, and improve response strategies. By integrating pipeline leak detection and incident management software, the dashboard provides actionable insights into safety performance, enabling operators to detect anomalies early, reduce downtime, and ensure regulatory compliance. It also supports gas utility safety compliance and reporting by automating data collection and visualization, making it easier to identify high-risk areas and optimize emergency preparedness.
How to Create a Natural Gas Transmission Pipeline Safety & Emergency Response Dashboard
You don’t need to build your report from scratch, just start with a ready-to-use dashboard template from Mokkup. Add in your data and export it however you like. Here’s how to do it:
1. Create or Log in to Your Mokkup Account
Start by signing up on Mokkup.ai using your email. If you already have an account, just log in, and you’ll be good to go.
2. Choose and Customize Your Dashboard Template
Find the Natural Gas Pipeline Safety & Emergency Response Dashboard template in the Templates section. Use the drag-and-drop editor to adjust KPIs, edit filters, or add elements based on your data.
3. Export to Your BI Tool
Once your dashboard wireframe is ready, use the BI Tool Export feature to send it directly to Power BI or Tableau for further analysis and enhancements. You can also download the dashboard as a PDF, PNG, or JPEG, embed it on a platform, or invite your team to collaborate.
Note: This is a Pro template. You’ll need a Pro subscription on Mokkup to use and customize this dashboard wireframe. Upgrade anytime to unlock full access.
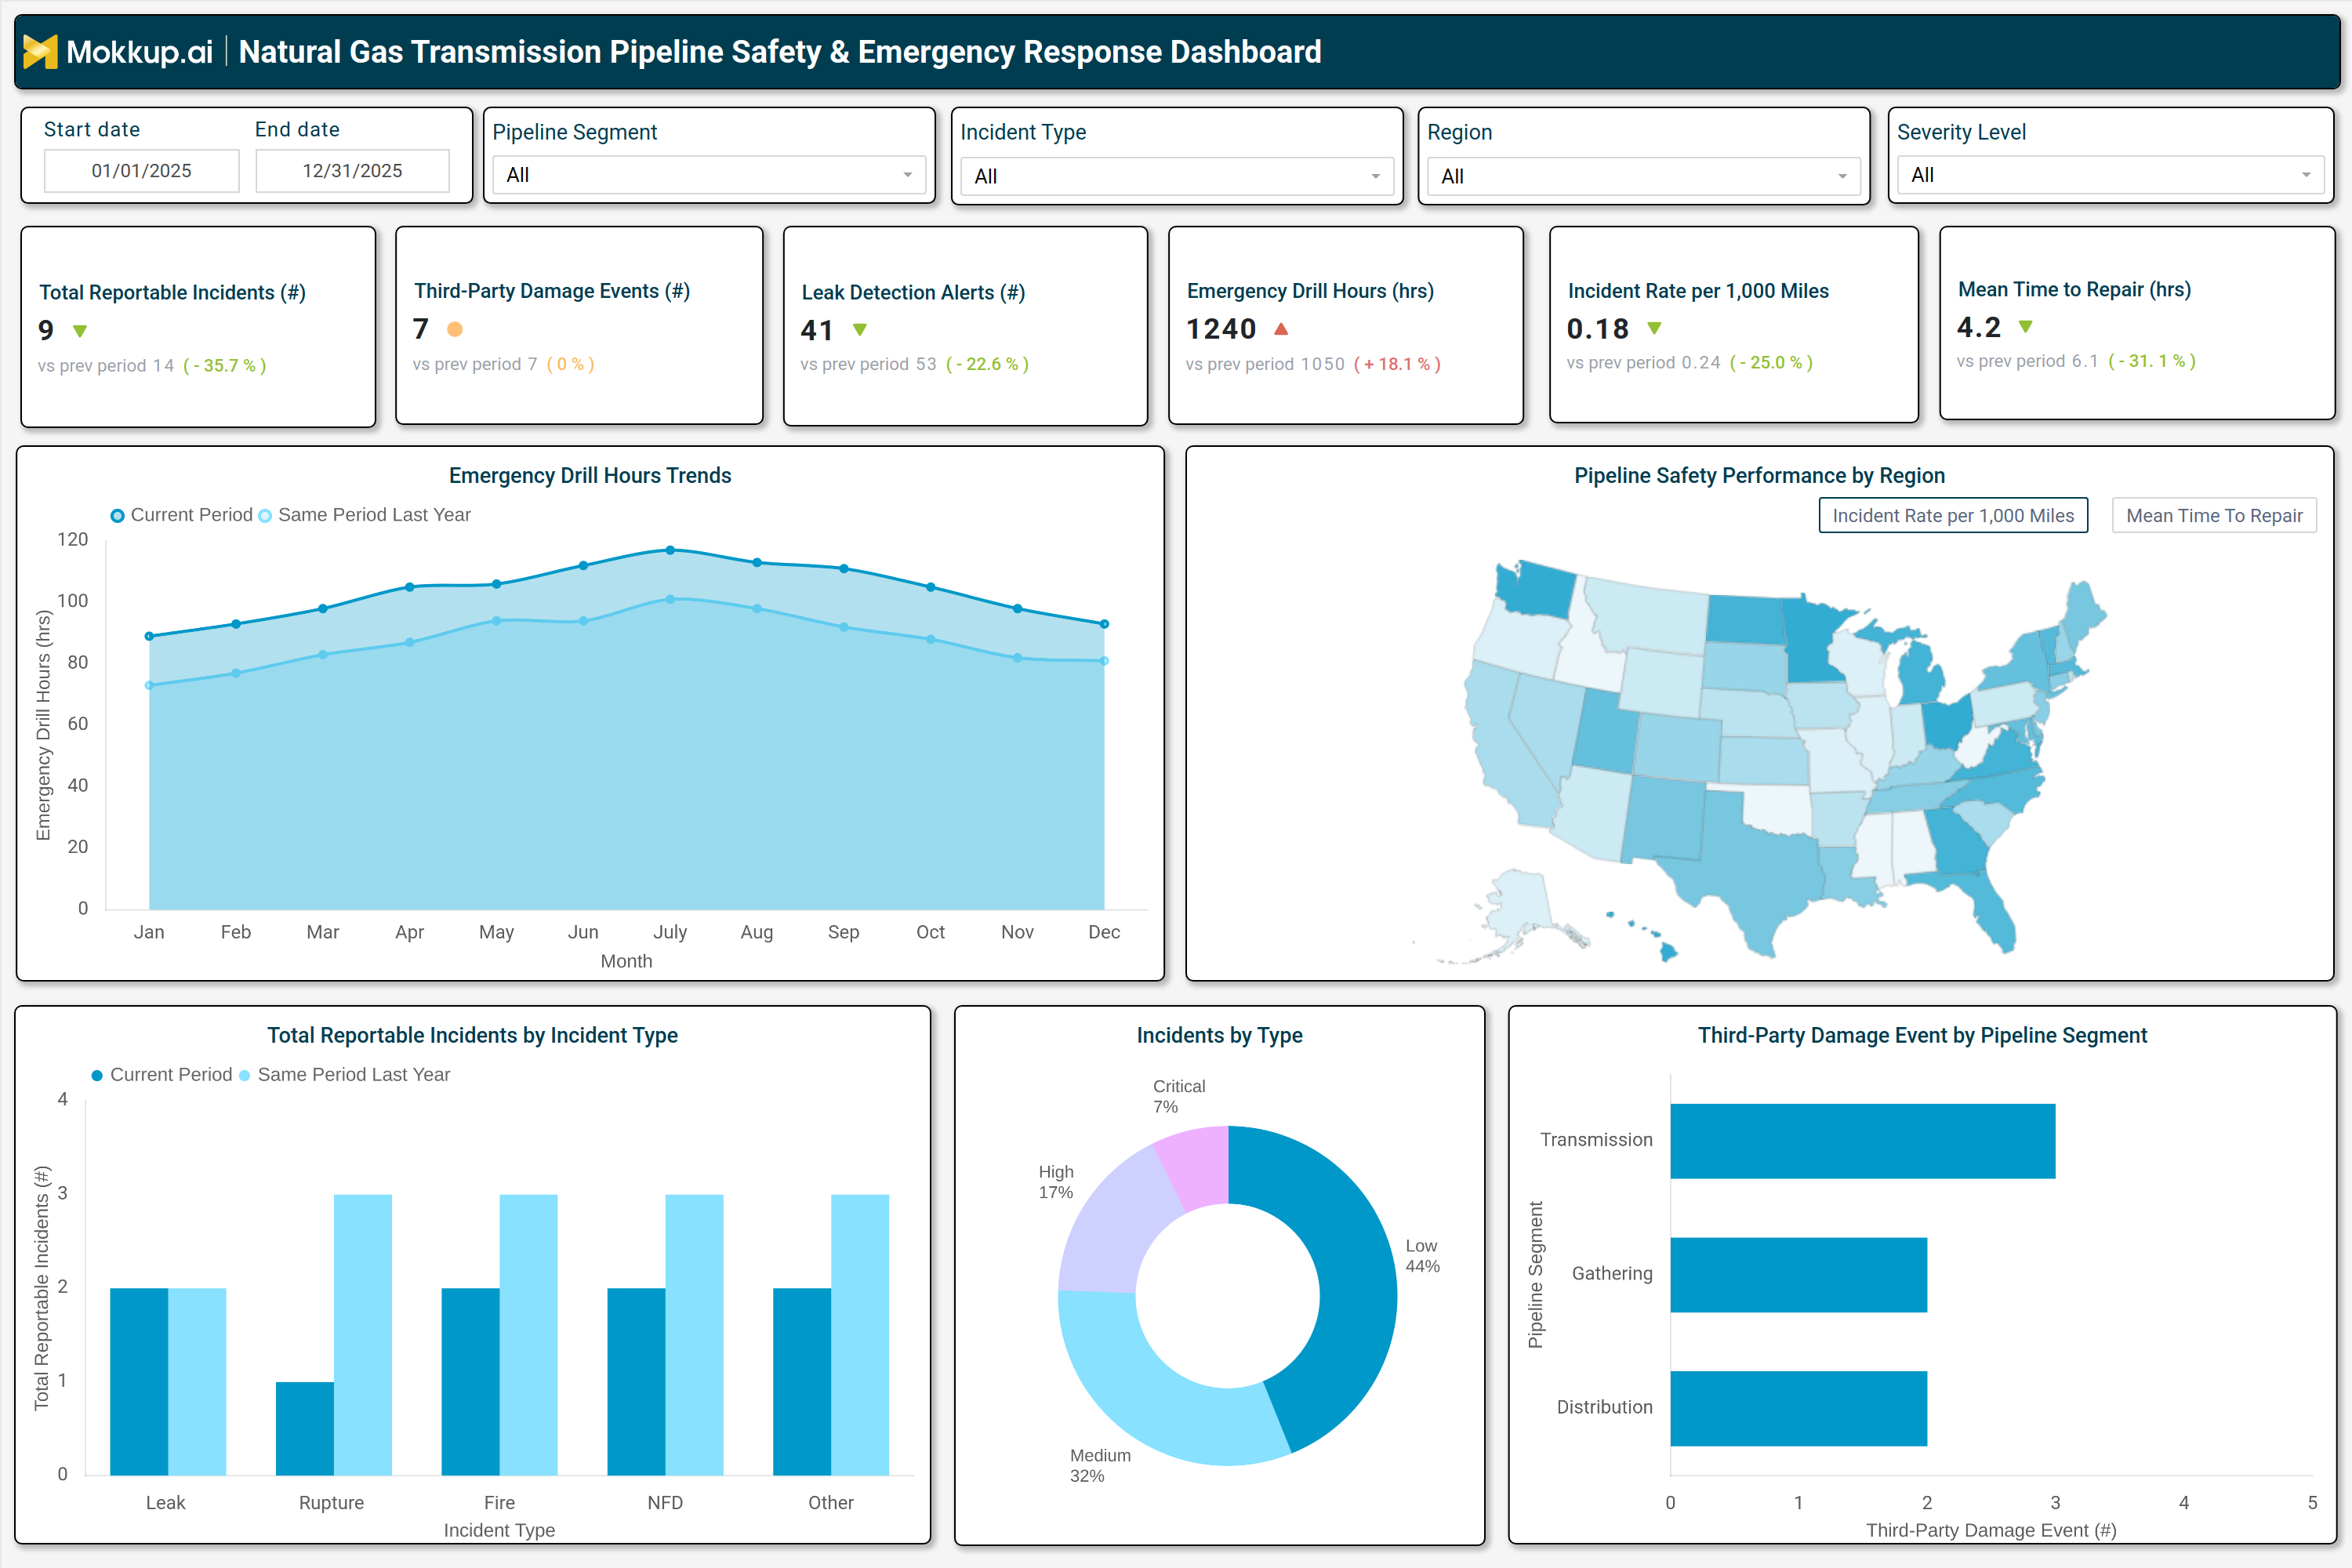
Natural Gas Transmission Pipeline Safety & Emergency Response Dashboard Example
A typical Natural Gas Pipeline Safety & Emergency Response Dashboard includes interactive filters for date ranges, pipeline segments, incident types, regions, and severity levels. Key performance tiles display metrics such as total reportable incidents, third-party damage events, leak detection alerts, emergency drill hours, incident rate per 1,000 miles, and mean time to repair. Trend charts compare current performance against historical data, helping operators track improvements or declines in safety metrics. A pipeline safety performance map visualizes incident rates and repair times by region, allowing for quick identification of high-risk areas. Additional breakdowns, such as incidents by type (leaks, ruptures, fires, near-failures) and third-party damage events by pipeline segment (transmission, gathering, distribution), provide deeper operational insights. Together, these components create a data-driven emergency response tool for gas transmission networks, enabling utilities to proactively manage risks, streamline incident resolution, and enhance overall pipeline safety.
How to Analyze Data in a Natural Gas Transmission Pipeline Safety & Emergency Response Dashboard
Here is how you can analyze data from this dashboard:
- Review Total Reportable Incidents: Tracks the number of reported incidents to evaluate overall safety performance and identify recurring patterns.
- Monitor Leak Detection Alerts: Identifies early warning signs of pipeline leaks to address integrity issues before they escalate.
- Track Third-Party Damage Events: Monitors damage caused by external activities such as excavation or construction near pipelines.
- Analyze Emergency Drill Hours: Measures training and drill participation to ensure teams are prepared for emergency situations.
- Compare Incident Rates per 1,000 Miles: Benchmark incident frequency against industry standards to evaluate operational safety.
- Evaluate Mean Time to Repair (MTTR): Assesses how quickly incidents are resolved to improve response time and operational efficiency.
- Use Regional Performance Maps: Identifies high-risk geographic areas that require increased monitoring and preventive measures.
- Break Down Incidents by Type: Categorizes incidents by hazard type to help prioritize targeted safety improvements.
Benefits of a Natural Gas Transmission Pipeline Safety & Emergency Response Dashboard
The following are the benefits of using this pipeline incident management dashboard:
- Enhances Pipeline Safety Monitoring: Provides automated alerts for leaks and potential hazards, enabling quicker detection and response.
- Improves Emergency Response: Tracks incidents and emergency drill performance to ensure teams are prepared for real-world situations.
- Reduces Regulatory Compliance Risks: Automates reporting and visualizes safety data to help organizations meet regulatory requirements.
- Optimizes Incident Resolution: Identifies high-risk pipeline segments and recurring incident patterns to improve response strategies.
- Supports Data-Driven Decision-Making: Provides insights that help organizations plan safety investments and workforce training effectively.
- Increases Operational Efficiency: Streamlines incident management processes to improve coordination and response times.
- Strengthens Stakeholder Communication: Delivers clear visual reports that help communicate safety performance to regulators and stakeholders.
KPIs to Track in a Natural Gas Transmission Pipeline Safety & Emergency Response Dashboard
The following key KPIs can be tracked by using this pipeline integrity monitoring dashboard:
- Total Reportable Incidents (count): Measures the number of safety incidents requiring regulatory reporting.
- Third-Party Damage Events (count): Tracks incidents caused by external activities (e.g., construction, excavation).
- Leak Detection Alerts (count): Counts automated alerts from pipeline monitoring systems.
- Emergency Drill Hours (hrs): Monitors training and preparedness for emergency scenarios.
- Incident Rate per 1,000 Miles: Calculates safety performance relative to pipeline length.
- Mean Time to Repair (hrs): Measures average response time for incident resolution.
Frequently Asked Questions
1. How does a gas leak detection analytics dashboard improve emergency response?
It provides automated alerts for natural gas pipeline hazards, tracks incident trends, and helps teams respond faster to leaks and damage.
2. What data sources feed this natural gas pipeline safety dashboard?
Leak detection systems, emergency drill logs, third-party damage reports, and regulatory compliance databases.
3. Who should use an emergency response dashboard for gas utilities?
Pipeline operators, gas utilities, emergency response teams, and regulatory compliance officers.