What is a Natural Gas-Fired Power Generation HSE Performance Dashboard?
A Natural Gas Fired Power Generation HSE Performance Dashboard is a centralized management tool designed for HSE leaders, plant managers, and operational heads to monitor and enhance Health, Safety, and Environmental (HSE) standards. This HSE performance dashboard for natural gas power plants provides a clear, visual overview of critical safety metrics, compliance rates, incident trends, and audit statuses. It enables proactive safety management, reduces operational risks, and ensures adherence to regulatory standards, serving as an essential natural gas power plant HSE reporting and compliance dashboard for governance and performance review.
How to Create a Natural Gas-Fired Power Generation HSE Performance Dashboard
You don’t need to build your dashboard from scratch—just start with a ready-to-use Dashboard template from Mokkup. Customize it with your data and export it with ease. Here’s how:
1. Create or Log in to Your Mokkup Account
Sign up on Mokkup.ai using your email address. Existing users can log in directly to get started.
2. Choose and Customize Your Dashboard Template
Locate the Natural Gas-Fired Power Generation HSE Performance Dashboard Template in the Templates gallery. Use the drag-and-drop editor to modify KPIs, adjust filters, or add new visual elements based on your plant’s data.
3. Export to Your BI Tool
Once your dashboard wireframe is finalized, use the BI Tool Export feature to transfer it to Power BI or Tableau for deeper analysis. You can also download the dashboard as a PDF, PNG, or JPEG, embed it on your platform, or invite team members to collaborate.
Note: This is a Pro template. A Mokkup Pro subscription is required to access and customize this dashboard wireframe.
Natural Gas-Fired Power Generation HSE Performance Dashboard Example
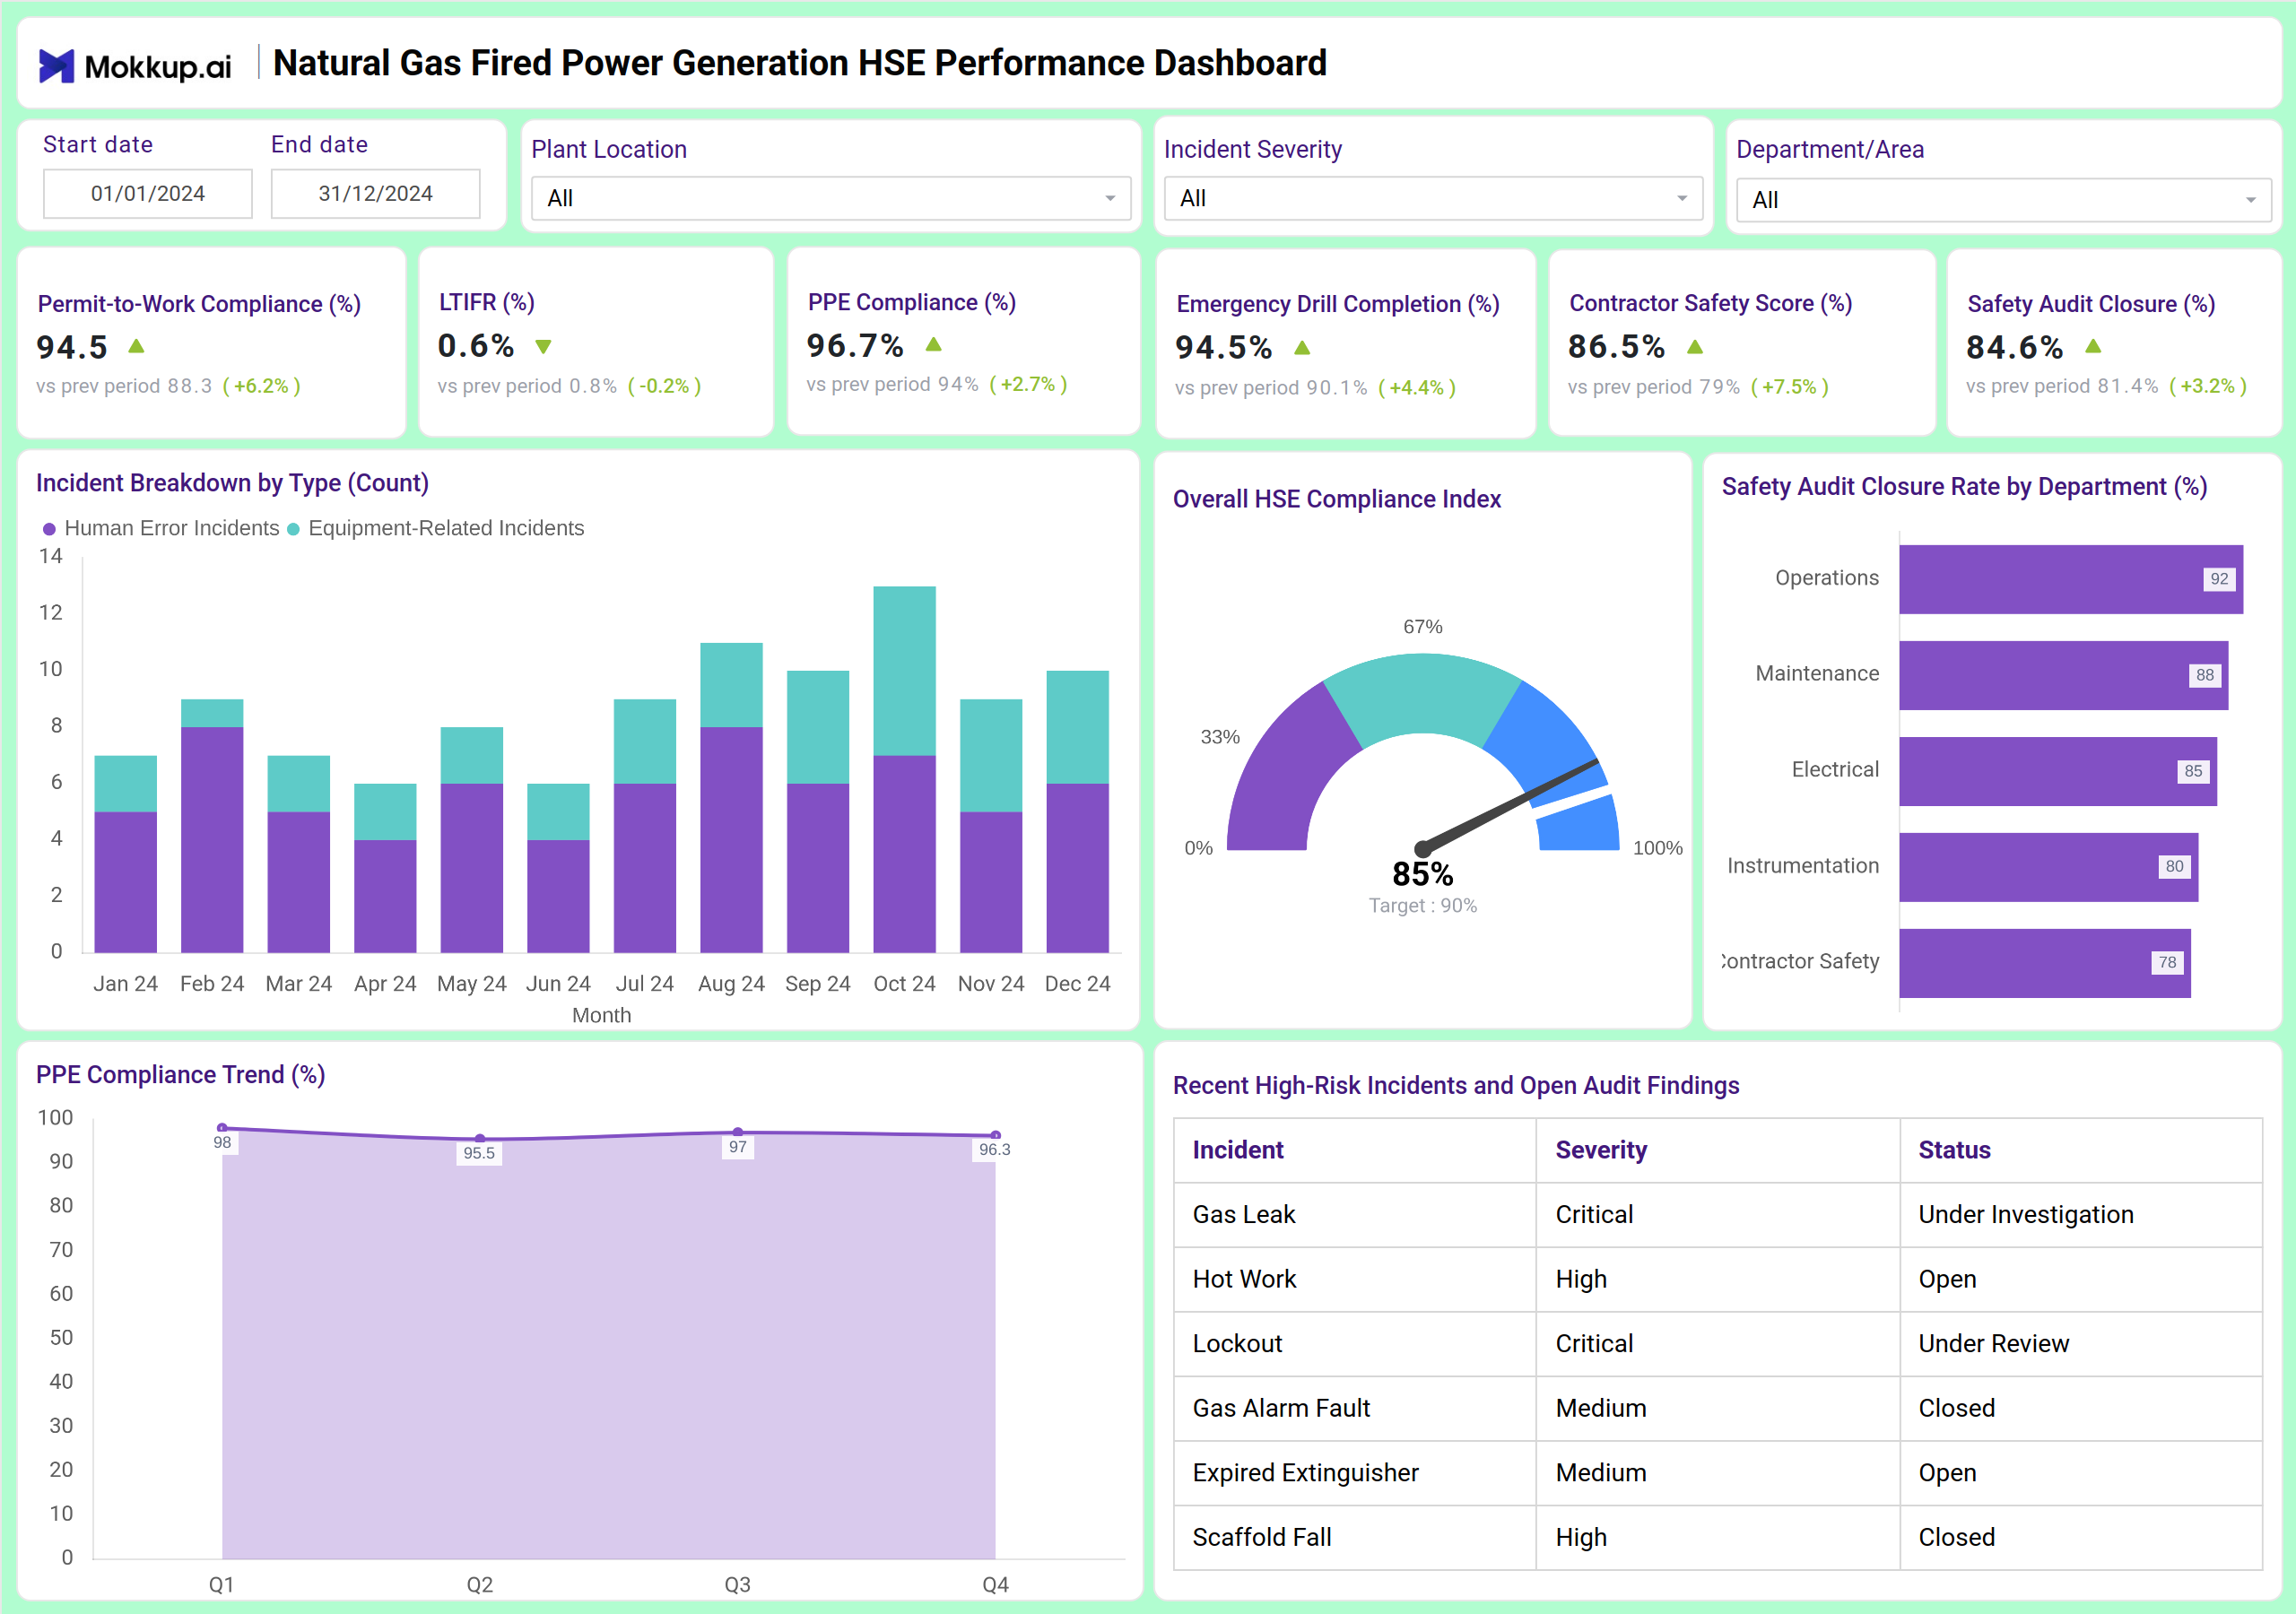
An effective HSE performance dashboard for natural gas power plants combines key metric tiles with trend visualizations. At the top, KPI cards display vital signs like Permit-to-Work Compliance, Lost Time Injury Rate (LITR), and PPE Compliance. Mid-section charts break down incidents by type and plot the monthly Lost Time Injury Frequency Rate trend. A detailed table lists recent high-risk incidents and open audit findings. This structured approach makes it the best HSE dashboard for natural gas power plants, offering leaders a comprehensive view of both safety performance and compliance status.
How to Analyze Data in Natural Gas-Fired Power Generation HSE Performance Dashboard
Here’s how safety teams can leverage this HSE dashboard for natural gas power plant safety tracking:
- Monitor Procedural Adherence: Track Permit-to-Work and PPE Compliance percentages to ensure strict following of safety protocols.
- Analyze Incident Trends: Review the monthly Lost Time Injury Frequency Rate (LTIFR) trend to identify patterns and prevent future occurrences.
- Evaluate Contractor Safety: Use the Contractor Safety Score to hold external partners accountable and drive improvement.
- Track Audit Resolution: Monitor the Safety Audit Closure rate to ensure findings are addressed promptly, reinforcing its role as a natural gas power plant HSE reporting and compliance dashboard.
- Assess Emergency Preparedness: Measure Emergency Drill Completion rates to validate team readiness for potential incidents.
- Prioritize High-Risk Issues: Review the list of recent incidents and audit findings to focus resources on the most critical areas.
Benefits of Natural Gas-Fired Power Generation HSE Performance Dashboard
- Centralized Safety Visibility: Gain a unified view of all critical HSE metrics, making it the ideal HSE dashboard for natural gas power plants to support leadership reviews.
- Proactive Risk Mitigation: Identify both leading and lagging indicators to address issues before they escalate into incidents.
- Improved Compliance Posture: Streamline audit preparation and reporting, functioning as an essential natural gas power plant HSE reporting and compliance dashboard.
- Enhanced Contractor Management: Maintain apparent oversight of third-party safety performance.
- Informed Decision-Making: Use data-driven insights to justify safety investments and procedural changes.
- Strengthened Safety Culture: Transparently sharing dashboard metrics promotes accountability and awareness across the organization.
KPIs to Track in Natural Gas-Fired Power Generation HSE Performance Dashboard
- Permit-to-Work Compliance (%): Measures adherence to formal authorizations for hazardous tasks.
- Lost Time Injury Rate (LITR %): Tracks the frequency of injuries that result in an employee being unable to work.
- PPE Compliance (%): Monitors the rate of proper Personal Protective Equipment usage among staff.
- Emergency Drill Completion Rate (%): Indicates the percentage of scheduled emergency response drills that were successfully executed.
- Contractor Safety Score (%): Evaluates the safety performance and compliance of contracted personnel.
- Safety Audit Closure (%): Tracks the percentage of identified audit actions that have been completed.
- Incident Breakdown by Type: Categorizes incidents (e.g., Human Error vs. Equipment-Related) for root cause analysis.
- LTIFR Trend: Visualizes the monthly trend of Lost Time Injury Frequency Rate to monitor performance over time.
- High-Risk Incidents & Audit Status: Provides a status update on the investigation and resolution of significant incidents and findings.
Frequently Asked Questions
1. Who should use a Natural Gas-Fired Power Generation HSE Performance Dashboard?
HSE Managers, Plant Managers, Operations Directors, and Compliance Officers responsible for safety and environmental performance will find this dashboard essential.
2. Can this dashboard help reduce incident rates?
Yes. By providing clear visibility into trends and compliance gaps, this HSE performance dashboard for natural gas power plants enables proactive interventions to prevent incidents.
3. Is this dashboard suitable for compliance audits?
Absolutely. It is designed to function as a natural gas power plant HSE reporting and compliance dashboard, providing the structured data and trends needed for internal and external audits.
4. How does it support contractor safety management?
The dedicated Contractor Safety Score KPI allows plant management to monitor, benchmark, and drive improvements in third-party safety performance.