What is a Natural Gas Transmission Pipeline Integrity Innovation & Technology Dashboard?
Natural gas transmission pipelines form the backbone of energy infrastructure, ensuring safe and efficient delivery of fuel across vast distances. However, maintaining pipeline integrity requires continuous monitoring, advanced technology, and data-driven decision-making. A Natural Gas Transmission Pipeline Integrity Innovation & Technology Dashboard serves as a centralized analytics platform that tracks R&D investments, AI-driven anomaly detection, pipeline inspection efficiency, and regulatory compliance. This dashboard helps gas utilities, transmission operators, and regulators assess the effectiveness of smart pipeline inspection tools, predictive maintenance for natural gas transmission pipelines, and AI-driven pipeline integrity management systems. By consolidating key performance metrics, it enables proactive risk mitigation, cost optimization, and compliance with safety standards.
How to Create a Natural Gas Transmission Pipeline Integrity Innovation & Technology Dashboard
You don’t need to build your report from scratch, just start with a ready to use dashboard template from Mokkup. Add in your data and export it however you like. Here’s how to do it:
1. Create or Log in to Your Mokkup Account
Start by signing up on Mokkup.ai using your email. If you already have an account, just log in, and you’ll be good to go.
2. Choose and Customize Your Dashboard Template
Find the Natural Gas Transmission Pipeline Integrity Innovation & Technology Dashboard template in the Templates section. Use the drag and drop editor to adjust KPIs, edit filters, or add elements based on your data.
3. Export to Your BI Tool
Once your dashboard wireframe is ready, use the BI Tool Export feature to send it directly to Power BI or Tableau for further analysis and enhancements. You can also download the dashboard as a PDF, PNG, or JPEG, embed it on a platform, or invite your team to collaborate.
Note: This is a Pro template. You’ll need a Pro subscription on Mokkup to use and customize this dashboard wireframe. Upgrade anytime to unlock full access.
Natural Gas Transmission Pipeline Integrity Innovation & Technology Dashboard Example
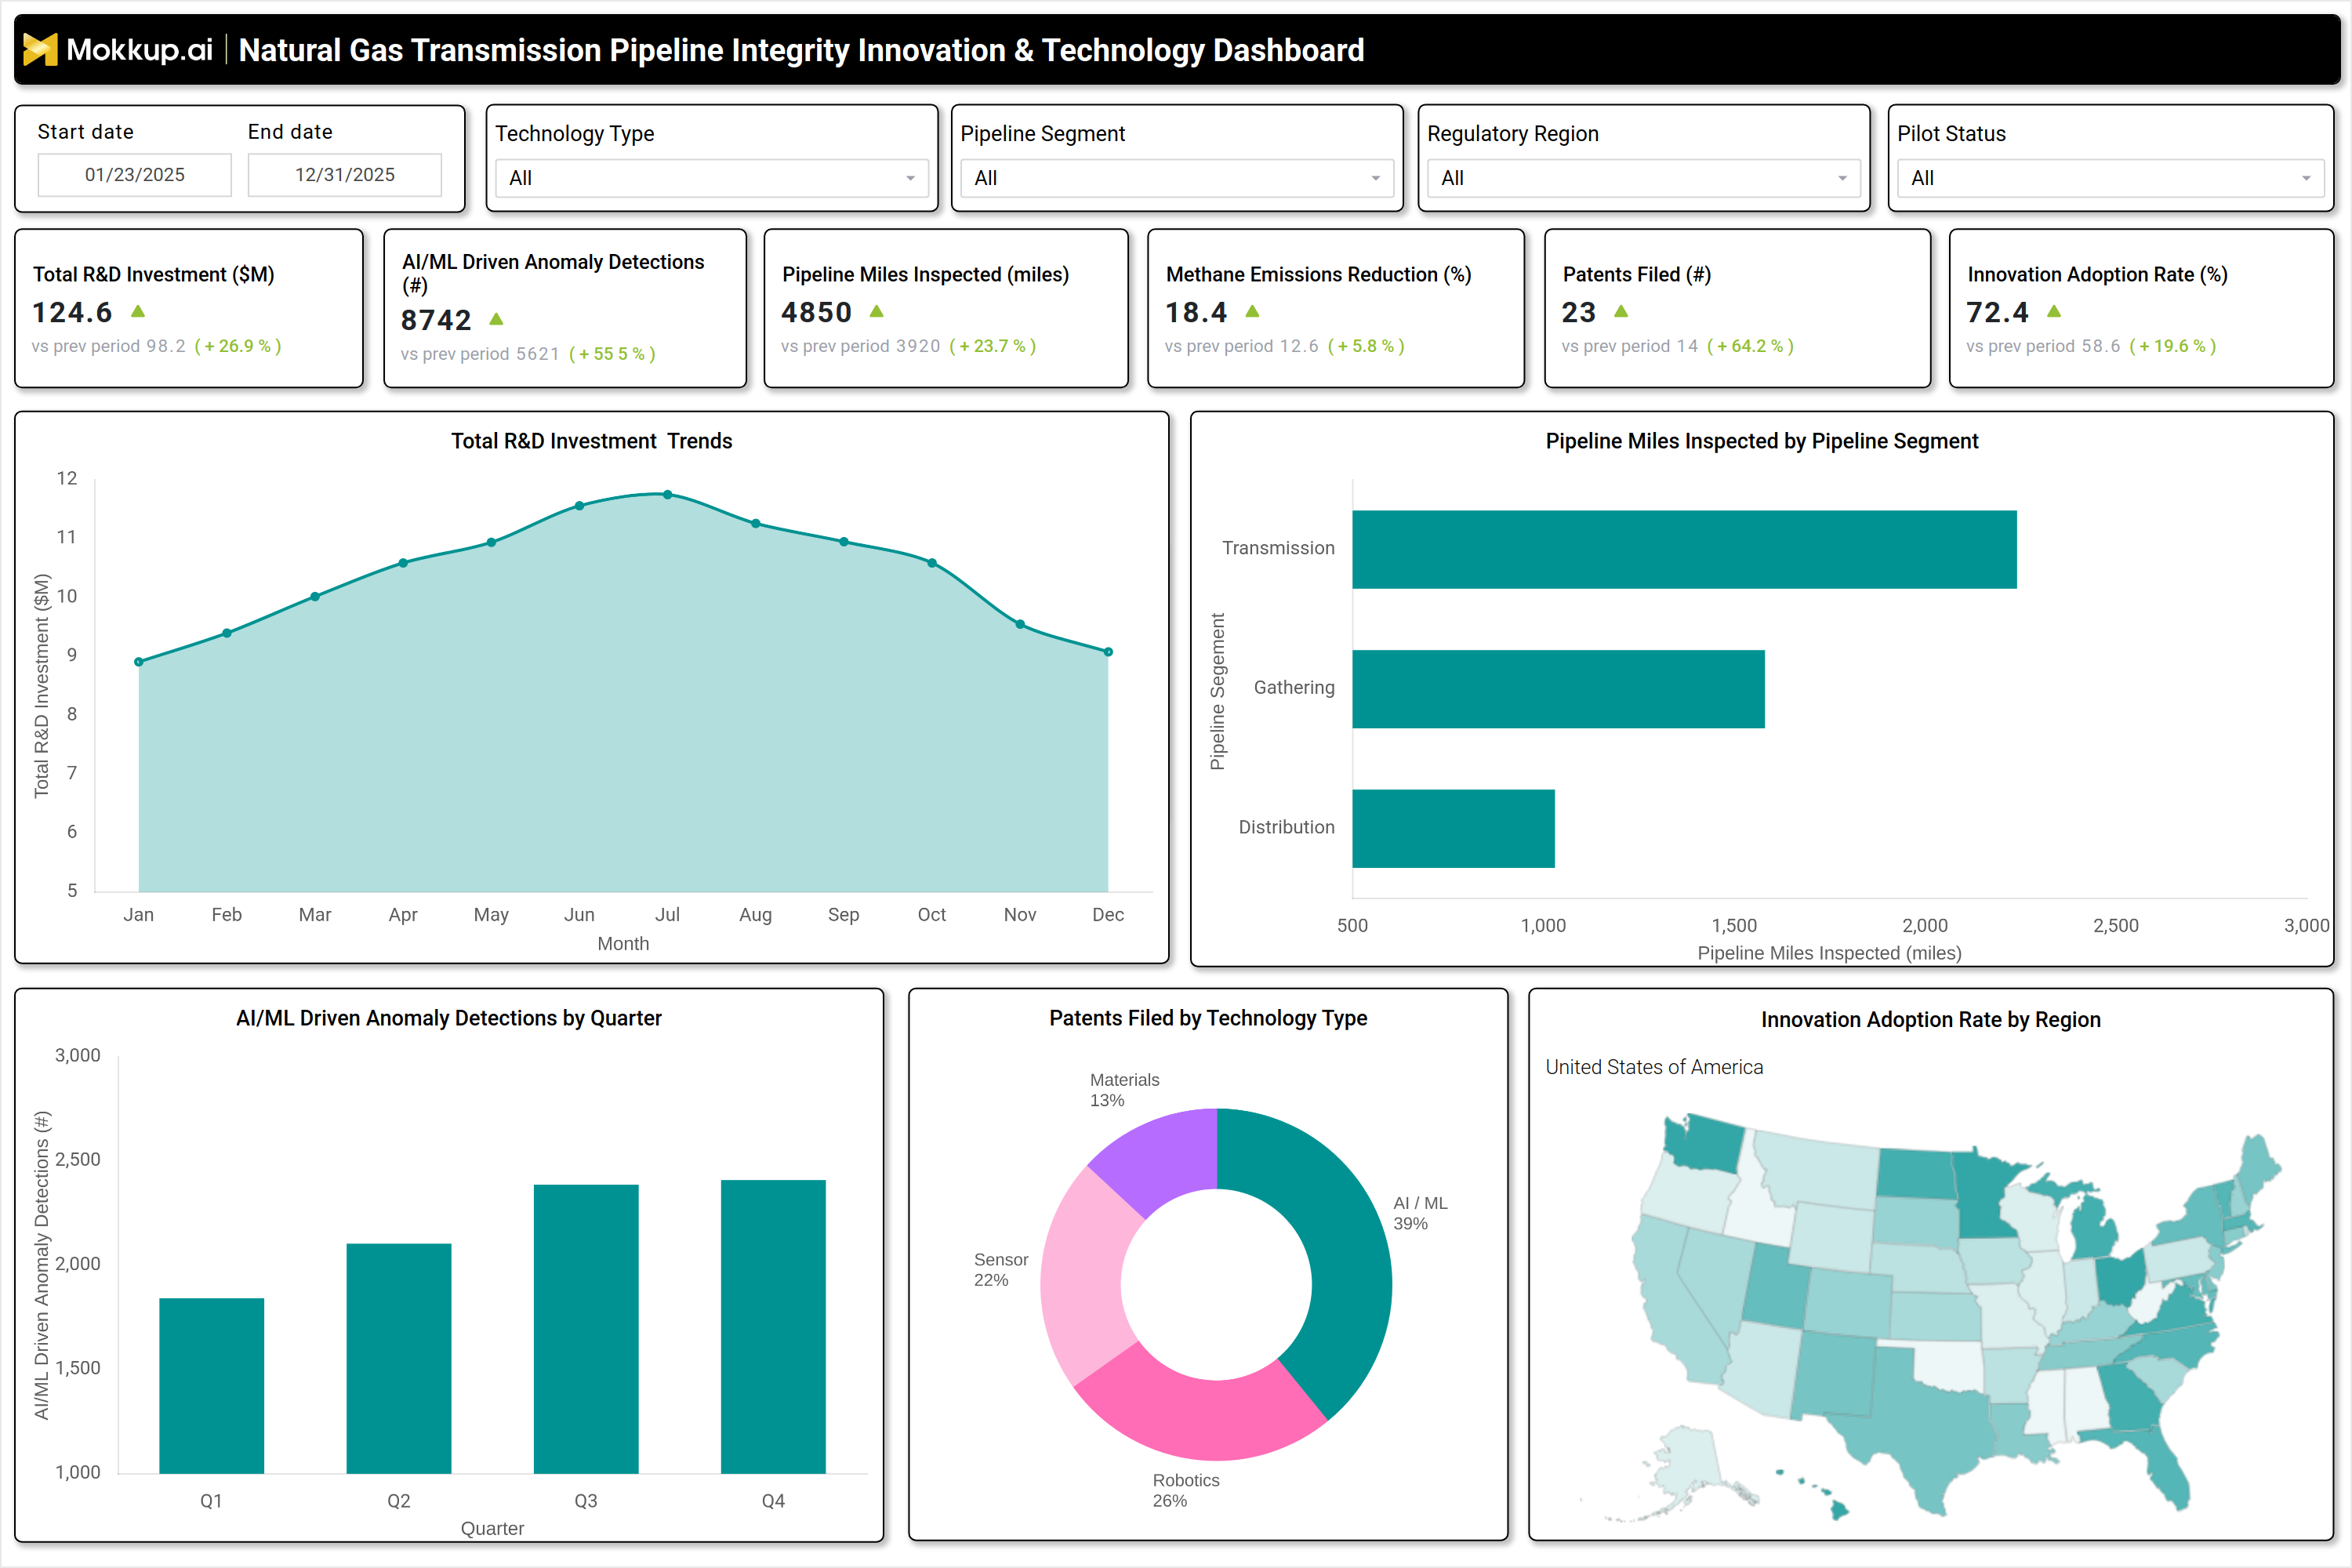
A well designed Natural Gas Transmission Pipeline Integrity Innovation & Technology Dashboard provides a comprehensive view of pipeline health, technology adoption, and R&D performance. A typical dashboard includes interactive filters for date ranges, technology types, pipeline segments, and regulatory regions. Key performance tiles display total R&D investment, AI/MLdriven anomaly detections, pipeline miles inspected, methane emissions reduction, patents filed, and innovation adoption rates. Trend charts track quarterly advancements in AI/MLdriven anomaly detection, while bar graphs compare pipeline inspection volumes across transmission, gathering, and distribution segments.
A pie chart breaks down patents by technology type such as AI/ML, robotics, sensors, and materials highlighting innovation focus areas. Additionally, a geographic heatmap visualizes innovation adoption rates by region, helping operators identify high performing and lagging areas. Together, these components create a data driven pipeline safety solution that supports operational efficiency, regulatory compliance, and sustainability goals.
How to Analyze Data in a Natural Gas Transmission Pipeline Integrity Innovation & Technology Dashboard
Here is how you can analyze data from this dashboard:
- Monitor R&D investment trends to assess funding allocation for advanced pipeline integrity monitoring solutions.
- Track AI/MLdriven anomaly detections to measure the effectiveness of innovative technologies for natural gas pipeline leak detection.
- Compare pipeline miles inspected across transmission, gathering, and distribution segments to identify inspection gaps.
- Evaluate methane emissions reduction percentages to gauge the impact of nextgen corrosion detection in natural gas pipelines.
- Review patents filed by technology type to determine innovation focus areas (AI, robotics, sensors, materials).
- Assess innovation adoption rates by region to identify high performing and underperforming areas.
- Analyze quarterly trends in anomaly detections to detect improvements or declines in pipeline integrity.
- Benchmark current performance against previous periods to measure progress in predictive maintenance for natural gas transmission pipelines.
Benefits of a Natural Gas Transmission Pipeline Integrity Innovation & Technology Dashboard
The following are the benefits of using this Smart Pipeline Safety Technology Dashboard:
- Enhances pipeline safety with AI driven pipeline integrity management systems that detect anomalies early.
- Reduces methane emissions by identifying and repairing leaks using smart pipeline inspection tools.
- Optimizes R&D spending by tracking investment trends and innovation adoption rates.
- Improves regulatory compliance with monitoring of inspection and maintenance activities.
- Supports predictive maintenance by analyzing historical and current pipeline integrity data.
- Increases operational efficiency by automating anomaly detection and reducing manual inspections.
- Drives innovation adoption by benchmarking technology performance across regions and segments.
- Enables data driven decisionmaking for pipeline upgrades, repairs, and expansions.
KPIs to Track in a Natural Gas Transmission Pipeline Integrity Innovation & Technology Dashboard
The following key KPIs can be tracked by using this R&D and Patent Filing Dashboard:
- Total R&D Investment ($M): Measures annual spending on advanced pipeline integrity monitoring solutions and innovation.
- AI/MLDriven Anomaly Detections (count): Tracks the number of pipeline defects identified using AIdriven pipeline integrity management systems.
- Pipeline Miles Inspected (miles): Monitors the total distance of pipelines inspected using smart pipeline inspection tools.
- Methane Emissions Reduction (%): Measures the percentage decrease in methane leaks due to innovative technologies for natural gas pipeline leak detection.
- Patents Filed (count): Tracks the number of new patents filed for nextgen corrosion detection in natural gas pipelines and related technologies.
- Innovation Adoption Rate (%): Evaluates the percentage of pipeline operators adopting data driven pipeline safety solutions.
Frequently Asked Questions
1. What is a Pipeline Inspection and Innovation Dashboard?
It is an analytics platform that tracks R&D investments, AIdriven anomaly detection, pipeline inspections, and innovation adoption for natural gas transmission systems.
2. How does this Gas Transmission Pipeline Integrity Dashboard improve pipeline safety?
By monitoring AI/MLdriven anomaly detections and methane emissions reduction, it enables early leak detection and preventive maintenance.
3. Who should use this AI/ML Anomaly Detection Analytics Dashboard?
Pipeline operators, gas utilities, regulators, R&D teams, and safety compliance officers.