
What is a Natural Gas Transmission PHMSA Compliance, Audit & Tariff Dashboard?
A Natural Gas Transmission PHMSA Compliance, Audit & Tariff Dashboard is a centralized analytics platform designed to help gas utilities and transmission operators monitor regulatory compliance, audit performance, and manage tariffs in one place. This dashboard consolidates critical data points such as PHMSA compliance violations, audit findings, tariff adherence rates, unaccounted for gas (UFG) percentages, and revenue collection trends into a single view. By integrating PHMSA compliance tracking, audit status updates, and tariff optimization metrics, the dashboard enables operators to proactively identify risks, streamline reporting, and ensure financial efficiency. It also provides actionable insights into pipeline safety, regulatory penalties, and capacity utilization, helping utilities maintain operational reliability while minimizing compliance-related disruptions.
How to Create a Natural Gas Transmission PHMSA Compliance, Audit & Tariff Dashboard
You don’t need to build your report from scratch, just start with a ready-to-use dashboard template from Mokkup. Add in your data and export it however you like. Here’s how to do it:
1. Create or Log in to Your Mokkup Account
Start by signing up on Mokkup.ai using your email. If you already have an account, just log in, and you’ll be good to go.
2. Choose and Customize Your Dashboard Template
Find the Natural Gas Transmission PHMSA Compliance, Audit & Tariff Dashboard template in the Templates section. Use the drag-and-drop editor to adjust KPIs, edit filters, or add elements based on your data.
3. Export to Your BI Tool
Once your dashboard wireframe is ready, use the BI Tool Export feature to send it directly to Power BI or Tableau for further analysis and enhancements. You can also download the dashboard as a PDF, PNG, or JPEG, embed it on a platform, or invite your team to collaborate.
Note: This is a Pro template. You’ll need a Pro subscription on Mokkup to use and customize this dashboard wireframe. Upgrade anytime to unlock full access.
Natural Gas Transmission PHMSA Compliance, Audit & Tariff Dashboard Example
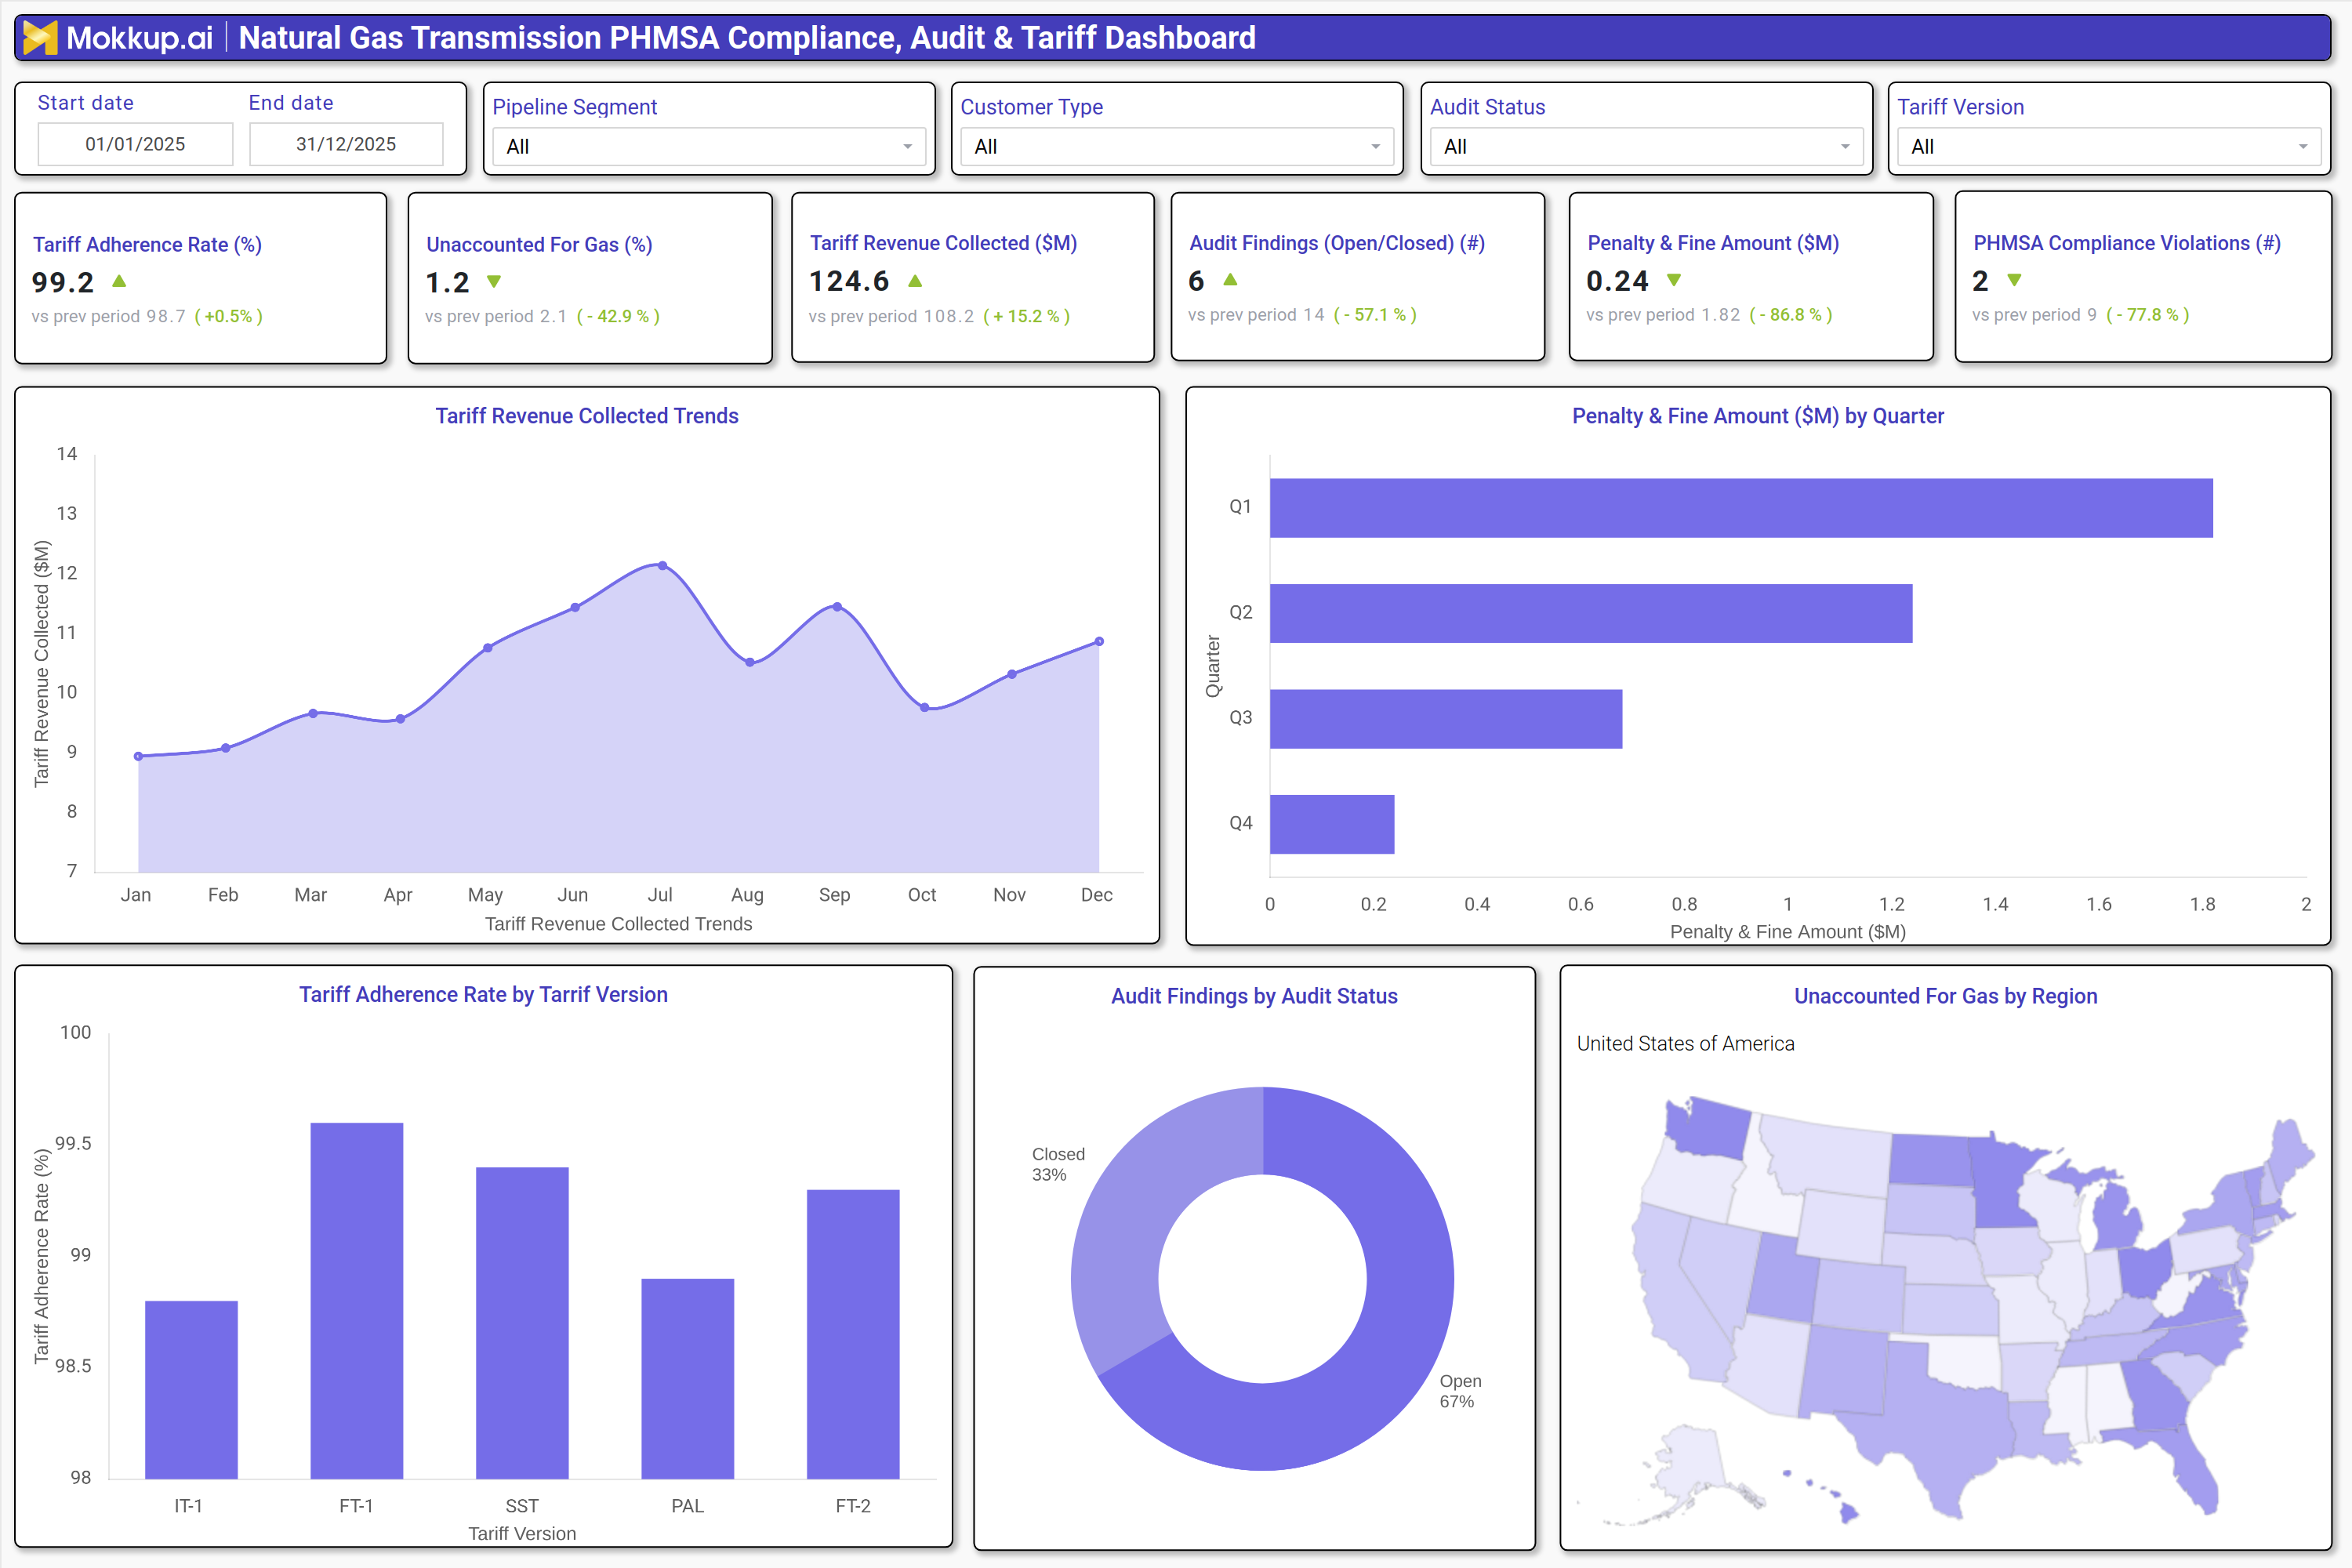
A well-structured Natural Gas Transmission PHMSA Compliance, Audit & Tariff Dashboard includes interactive filters for date ranges, pipeline segments, customer types, audit statuses, and tariff versions, allowing users to drill down into specific operational areas. Key performance tiles display tariff adherence rates, unaccounted for gas percentages, tariff revenue collected, open audit findings, penalty amounts, and PHMSA compliance violations, with comparisons against previous periods. Trend charts track monthly revenue collection patterns, while bar graphs break down capacity utilization by quarter to highlight seasonal demand fluctuations. A geographic heatmap visualizes unaccounted-for gas by region, helping operators pinpoint inefficiencies. Additionally, the dashboard provides audit findings by status (open/closed) and tariff adherence rates by version, ensuring compliance teams can quickly assess regulatory performance and take corrective actions.
How to Analyze Data in a Natural Gas Transmission PHMSA Compliance, Audit & Tariff Dashboard
Here is how you can analyze data from this DOT pipeline compliance dashboard:
- Monitor Tariff Adherence Rates: Track tariff adherence to ensure billing accuracy and compliance with approved tariff structures.
- Track Unaccounted-for Gas (UFG): Measure UFG percentages to identify pipeline inefficiencies or potential leaks in the system.
- Review Tariff Revenue Trends: Analyze tariff revenue collection trends to assess financial performance and detect anomalies.
- Analyze Audit Findings: Review open and closed audit findings to prioritize corrective actions and reduce compliance risks.
- Evaluate Penalties and Fines: Monitor penalties and fine amounts to understand the financial impact of regulatory noncompliance.
- Assess PHMSA Compliance Violations: Track PHMSA compliance violations to evaluate regulatory performance and strengthen safety protocols.
- Compare Quarterly Capacity Utilization: Analyze pipeline capacity utilization by quarter to optimize operations and meet demand fluctuations.
- Examine Regional UFG Patterns: Review unaccounted-for gas by region to detect operational inefficiencies in specific pipeline segments.
Benefits of a Natural Gas Transmission PHMSA Compliance, Audit & Tariff Dashboard
The following are the benefits of using this pipeline integrity management dashboard:
- Enhance PHMSA Compliance Tracking: Monitor regulatory violations and generate reports to ensure consistent compliance with PHMSA standards.
- Reduce Audit Risks: Provide visibility into open audit findings and track corrective actions to minimize compliance risks.
- Improve Tariff Management: Ensure accurate billing and consistent revenue collection by monitoring tariff implementation.
- Minimize Financial Losses: Identify unaccounted-for gas and pipeline inefficiencies to prevent revenue leakage and operational losses.
- Streamline Regulatory Reporting: Automate compliance documentation and reporting processes to simplify regulatory submissions.
- Optimize Pipeline Capacity Utilization: Use data-driven demand forecasting to improve pipeline capacity planning and operational efficiency.
- Support Proactive Risk Management: Detect compliance gaps early to address potential issues before regulatory audits occur.
- Enable Data-Driven Decision-Making: Provide actionable insights for tariff adjustments and operational improvements.
KPIs to Track in a Natural Gas Transmission PHMSA Compliance, Audit & Tariff Dashboard
The following key KPIs can be tracked by using this natural gas safety compliance dashboard:
- Tariff Adherence Rate (%) – Measures compliance with approved tariff structures to prevent billing discrepancies.
- UnaccountedFor Gas (UFG) (%) – Tracks gas losses due to leaks, measurement errors, or theft, indicating pipeline efficiency.
- Tariff Revenue Collected ($M) – Monitors financial performance by tracking revenue generated from tariff applications.
- Audit Findings (Open/Closed) (count) – Tracks unresolved compliance issues to prioritize corrective actions.
- Penalty & Fine Amount ($M) – Measures financial impact from regulatory violations and noncompliance.
- PHMSA Compliance Violations (count) – Counts regulatory breaches to assess safety and compliance performance.
Frequently Asked Questions
1. What is a Natural Gas Transmission PHMSA Compliance, Audit & Tariff Dashboard?
It is an analytics platform that tracks PHMSA compliance, audit findings, tariff adherence, and revenue collection for gas transmission operators.
2. How does this gas pipeline regulatory reporting dashboard help with PHMSA compliance?
It provides violation tracking, audit status updates, and penalty monitoring to ensure regulatory adherence.
3. What data sources feed this PHMSA compliance monitoring dashboard?
Pipeline operational data, PHMSA compliance reports, audit logs, tariff management systems, and financial records.