What is an Electric Power Retail Tariff Innovation Overview Dashboard?
An Electric Power Retail Tariff Innovation Overview Dashboard is a management and analytics layer used by power retailers to track how new tariff products are designed, approved, launched, adopted, and monetized. It helps retail utilities monitor innovation performance across tariff portfolio size, approval cycle time, enablement cost, and realized margin outcomes.
This dashboard connects tariff strategy with operational readiness across billing systems, regulatory workflows, and customer education. It acts as both an electric utility tariff strategy dashboard and a decision tool for scaling the right tariff innovations while discontinuing low-performing designs. In short, it provides a data-backed view of tariff innovation execution, customer uptake, and value realization.
How to Create an Electric Power Retail Tariff Innovation Overview Dashboard
You don’t need to build your report from scratch, just start with a ready-to-use dashboard template from Mokkup. Add in your data and export it however you like. Here’s how to do it:
1. Create or Log in to Your Mokkup Account
Start by signing up on Mokkup.ai using your email. If you already have an account, just log in, and you’ll be good to go.
2. Choose and Customize Your Dashboard Template
Find the Electric Power Retail Tariff Innovation Overview Dashboard template in the Templates section. Use the drag-and-drop editor to adjust KPIs, edit filters, or add elements based on your data.
3. Export to Your BI Tool
Once your dashboard wireframe is ready, use the BI Tool Export feature to send it directly to Power BI or Tableau for further analysis and enhancements. You can also download the dashboard as a PDF, PNG, or JPEG, embed it on a platform, or invite your team to collaborate.
Note: This is a Pro template. You’ll need a Pro subscription on Mokkup to use and customize this dashboard wireframe. Upgrade anytime to unlock full access.
Electric Power Retail Tariff Innovation Overview Dashboard Example
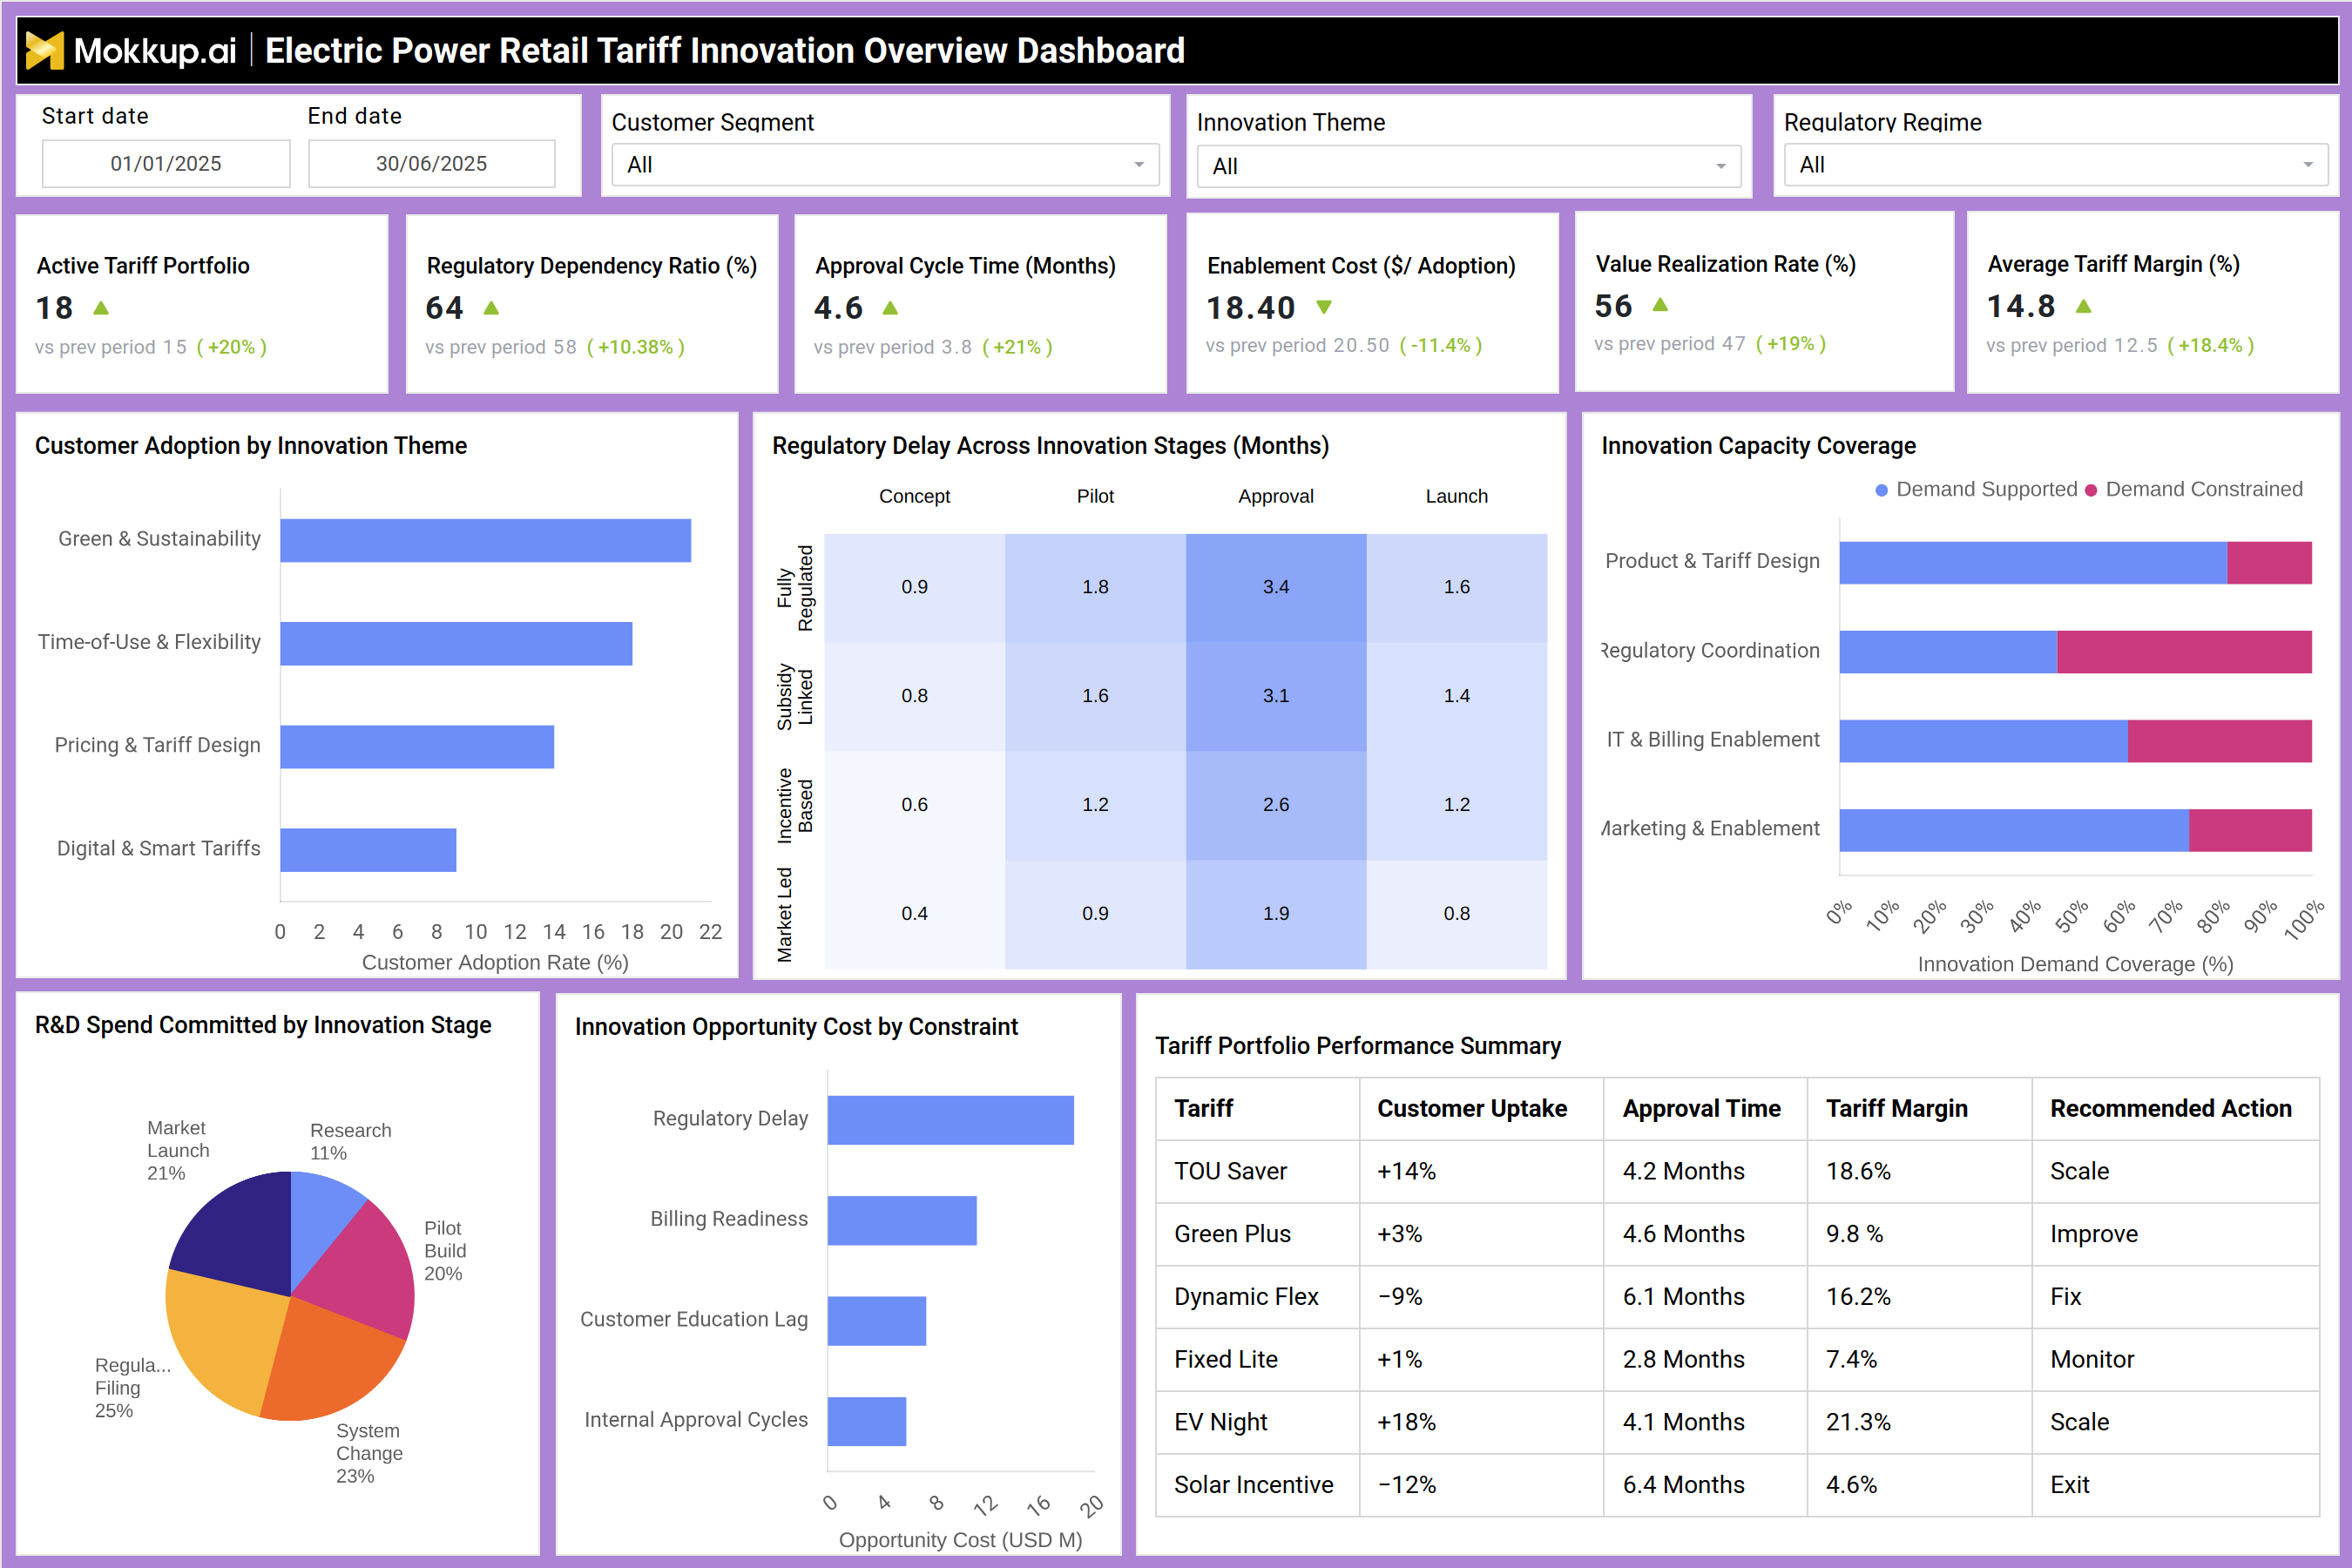
In the dashboard example, leadership can view the Active Tariff Portfolio (18) and the overall Value Realization Rate (56%), along with Average Tariff Margin (14.8%) to assess whether innovations are delivering financial impact. It tracks governance bottlenecks using metrics like Regulatory Dependency Ratio (64%) and Approval Cycle Time (4.6 months). Adoption is broken down by themes such as Green & Sustainability, Time-of-Use & Flexibility, and Digital & Smart Tariffs, supporting a retail tariff adoption performance tracker approach. The regulatory delay heatmap highlights delay patterns across Concept → Pilot → Approval → Launch stages, giving actionable insights on where execution slows. It also adds a portfolio summary table showing uptake, approval time, tariff margin, and the recommended decision such as Scale, Improve, Fix, Monitor, or Exit.
How to Analyze Data in Electric Power Retail Tariff Innovation Overview Dashboard
Here is how you can analyze data from this dashboard:
- Start with portfolio health: Review Active Tariff Portfolio growth and check if the portfolio is becoming too large to execute effectively.
- Track regulatory risk exposure: Use Regulatory Dependency Ratio and the delay heatmap to identify where approvals slow down tariff launches.
- Measure speed-to-market: Compare Approval Cycle Time across innovation types to detect repeated process inefficiencies.
- Validate cost vs benefit: Check Enablement Cost ($/Adoption) against customer uptake and value realization to confirm efficiency.
- Analyze adoption themes: Use Customer Adoption by Innovation Theme to see which tariff categories drive adoption fastest.
- Assess innovation capacity: Use Innovation Capacity Coverage to ensure product design, regulatory coordination, and billing enablement are not constrained.
- Evaluate opportunity losses: Use Innovation Opportunity Cost by Constraint to quantify how much value is being lost due to delays or readiness issues.
- Review investment balance: Track R&D spend by stage to confirm funding is not stuck in early phases (concept/pilot) without enough launch execution.
- Make portfolio actions: Use tariff-level performance table to decide which innovations to Scale, Fix, Improve, or Exit.
- Link to retail outcomes: Always connect insights back to pricing outcomes using this dynamic tariff pricing analytics tool perspective.
Benefits of Electric Power Retail Tariff Innovation Overview Dashboard
The following are the benefits of using this dashboard:
- Builds visibility into the full tariff innovation lifecycle—from design to adoption and margin realization.
- Improves tariff governance by tracking approval delays and regulatory dependency patterns.
- Enables faster decision-making on scaling or retiring tariff products using performance-based recommendations.
- Reduces cost overruns by monitoring enablement cost per adoption and execution constraints.
- Strengthens customer uptake through theme-level adoption insights and targeted enablement planning.
- Aligns innovation investments with measurable business outcomes using a power retail tariff performance overview.
- Enhances coordination between strategy, billing IT, regulatory teams, and marketing enablement.
KPIs to Track in Electric Power Retail Tariff Innovation Overview Dashboard
The following key KPIs can be tracked by using this dashboard:
- Active Tariff Portfolio (count): Tracks the number of tariff innovations currently active in the portfolio.
- Regulatory Dependency Ratio (%): Measures the share of tariff programs dependent on approvals or regulatory regime requirements.
- Approval Cycle Time (months): Tracks the average time taken for tariffs to move through approval and launch processes.
- Enablement Cost ($/Adoption): Measures the cost required to support adoption through billing enablement and rollout readiness.
- Regulatory Delay Across Stages (months): Identifies where most delay occurs across Concept, Pilot, Approval, and Launch stages
- R&D Spend by Innovation Stage (%): Tracks funding distribution across concept, pilot build, regulatory filing, system change, and launch.
- Innovation Opportunity Cost (USD): Quantifies the financial value lost due to constraints like regulatory delays and billing readiness gaps.
- Tariff Portfolio Action Status (Scale/Improve/Fix/Monitor/Exit): Indicates the recommended next action for each tariff based on performance.
Frequently Asked Questions
1. Who should use an Electric Power Retail Tariff Innovation Overview Dashboard?
This dashboard is ideal for tariff strategy teams, retail pricing managers, regulatory affairs, billing operations, and utility leadership.
2. How is this different from a normal tariff reporting dashboard?
A normal tariff report is retrospective, while this dashboard focuses on innovation lifecycle tracking, adoption performance, enablement readiness, and regulatory execution.
3. Why is regulatory dependency important in tariff innovation?
Higher dependency increases time-to-market risk. Tracking it helps retailers plan tariffs that are both compliant and executable.