What is an Electric Power Retail Compliance & Regulatory Overview Dashboard?
An Electric Power Retail Compliance & Regulatory Overview Dashboard template is a centralized reporting layer that helps retail electricity suppliers monitor regulatory adherence across billing, tariff implementation, submissions, and audit performance. It combines compliance scores, reporting timeliness, tariff deviation incidents, and penalty exposure into a single executive view.
This dashboard wireframe supports utilities in reducing non-compliance risk by tracking operational failures like incorrect tariff mapping and billing errors. It also works as a power retail regulatory monitoring tool by highlighting open findings, submission gaps, and compliance areas driving penalties. With structured insights for regulators and internal control teams, it becomes a complete retail electricity regulatory overview dashboard for supply and billing governance.
How to Create an Electric Power Retail Compliance & Regulatory Overview Dashboard
You don’t need to build your report from scratch, just start with a ready-to-use Electric Power Retail Compliance & Regulatory Overview dashboard template from Mokkup. Add in your data and export it however you like. Here’s how to do it:
1. Create or Log in to Your Mokkup Account
Start by signing up on Mokkup.ai using your email. If you already have an account, just log in, and you’ll be good to go.
2. Choose and Customize Your Dashboard Template
Find the Electric Power Retail Compliance & Regulatory Overview Dashboard template in the Templates section. Use the drag-and-drop editor to adjust KPIs, edit filters, or add elements based on your data.
3. Export to Your BI Tool
Once your dashboard wireframe is ready, use the BI Tool Export feature to send it directly to Power BI or Tableau for further analysis and enhancements. You can also download the dashboard as a PDF, PNG, or JPEG, embed it on a platform, or invite your team to collaborate.
Note: This is a Pro template. You’ll need a Pro subscription on Mokkup to use and customize this dashboard wireframe. Upgrade anytime to unlock full access.
Electric Power Retail Compliance & Regulatory Overview Dashboard Example
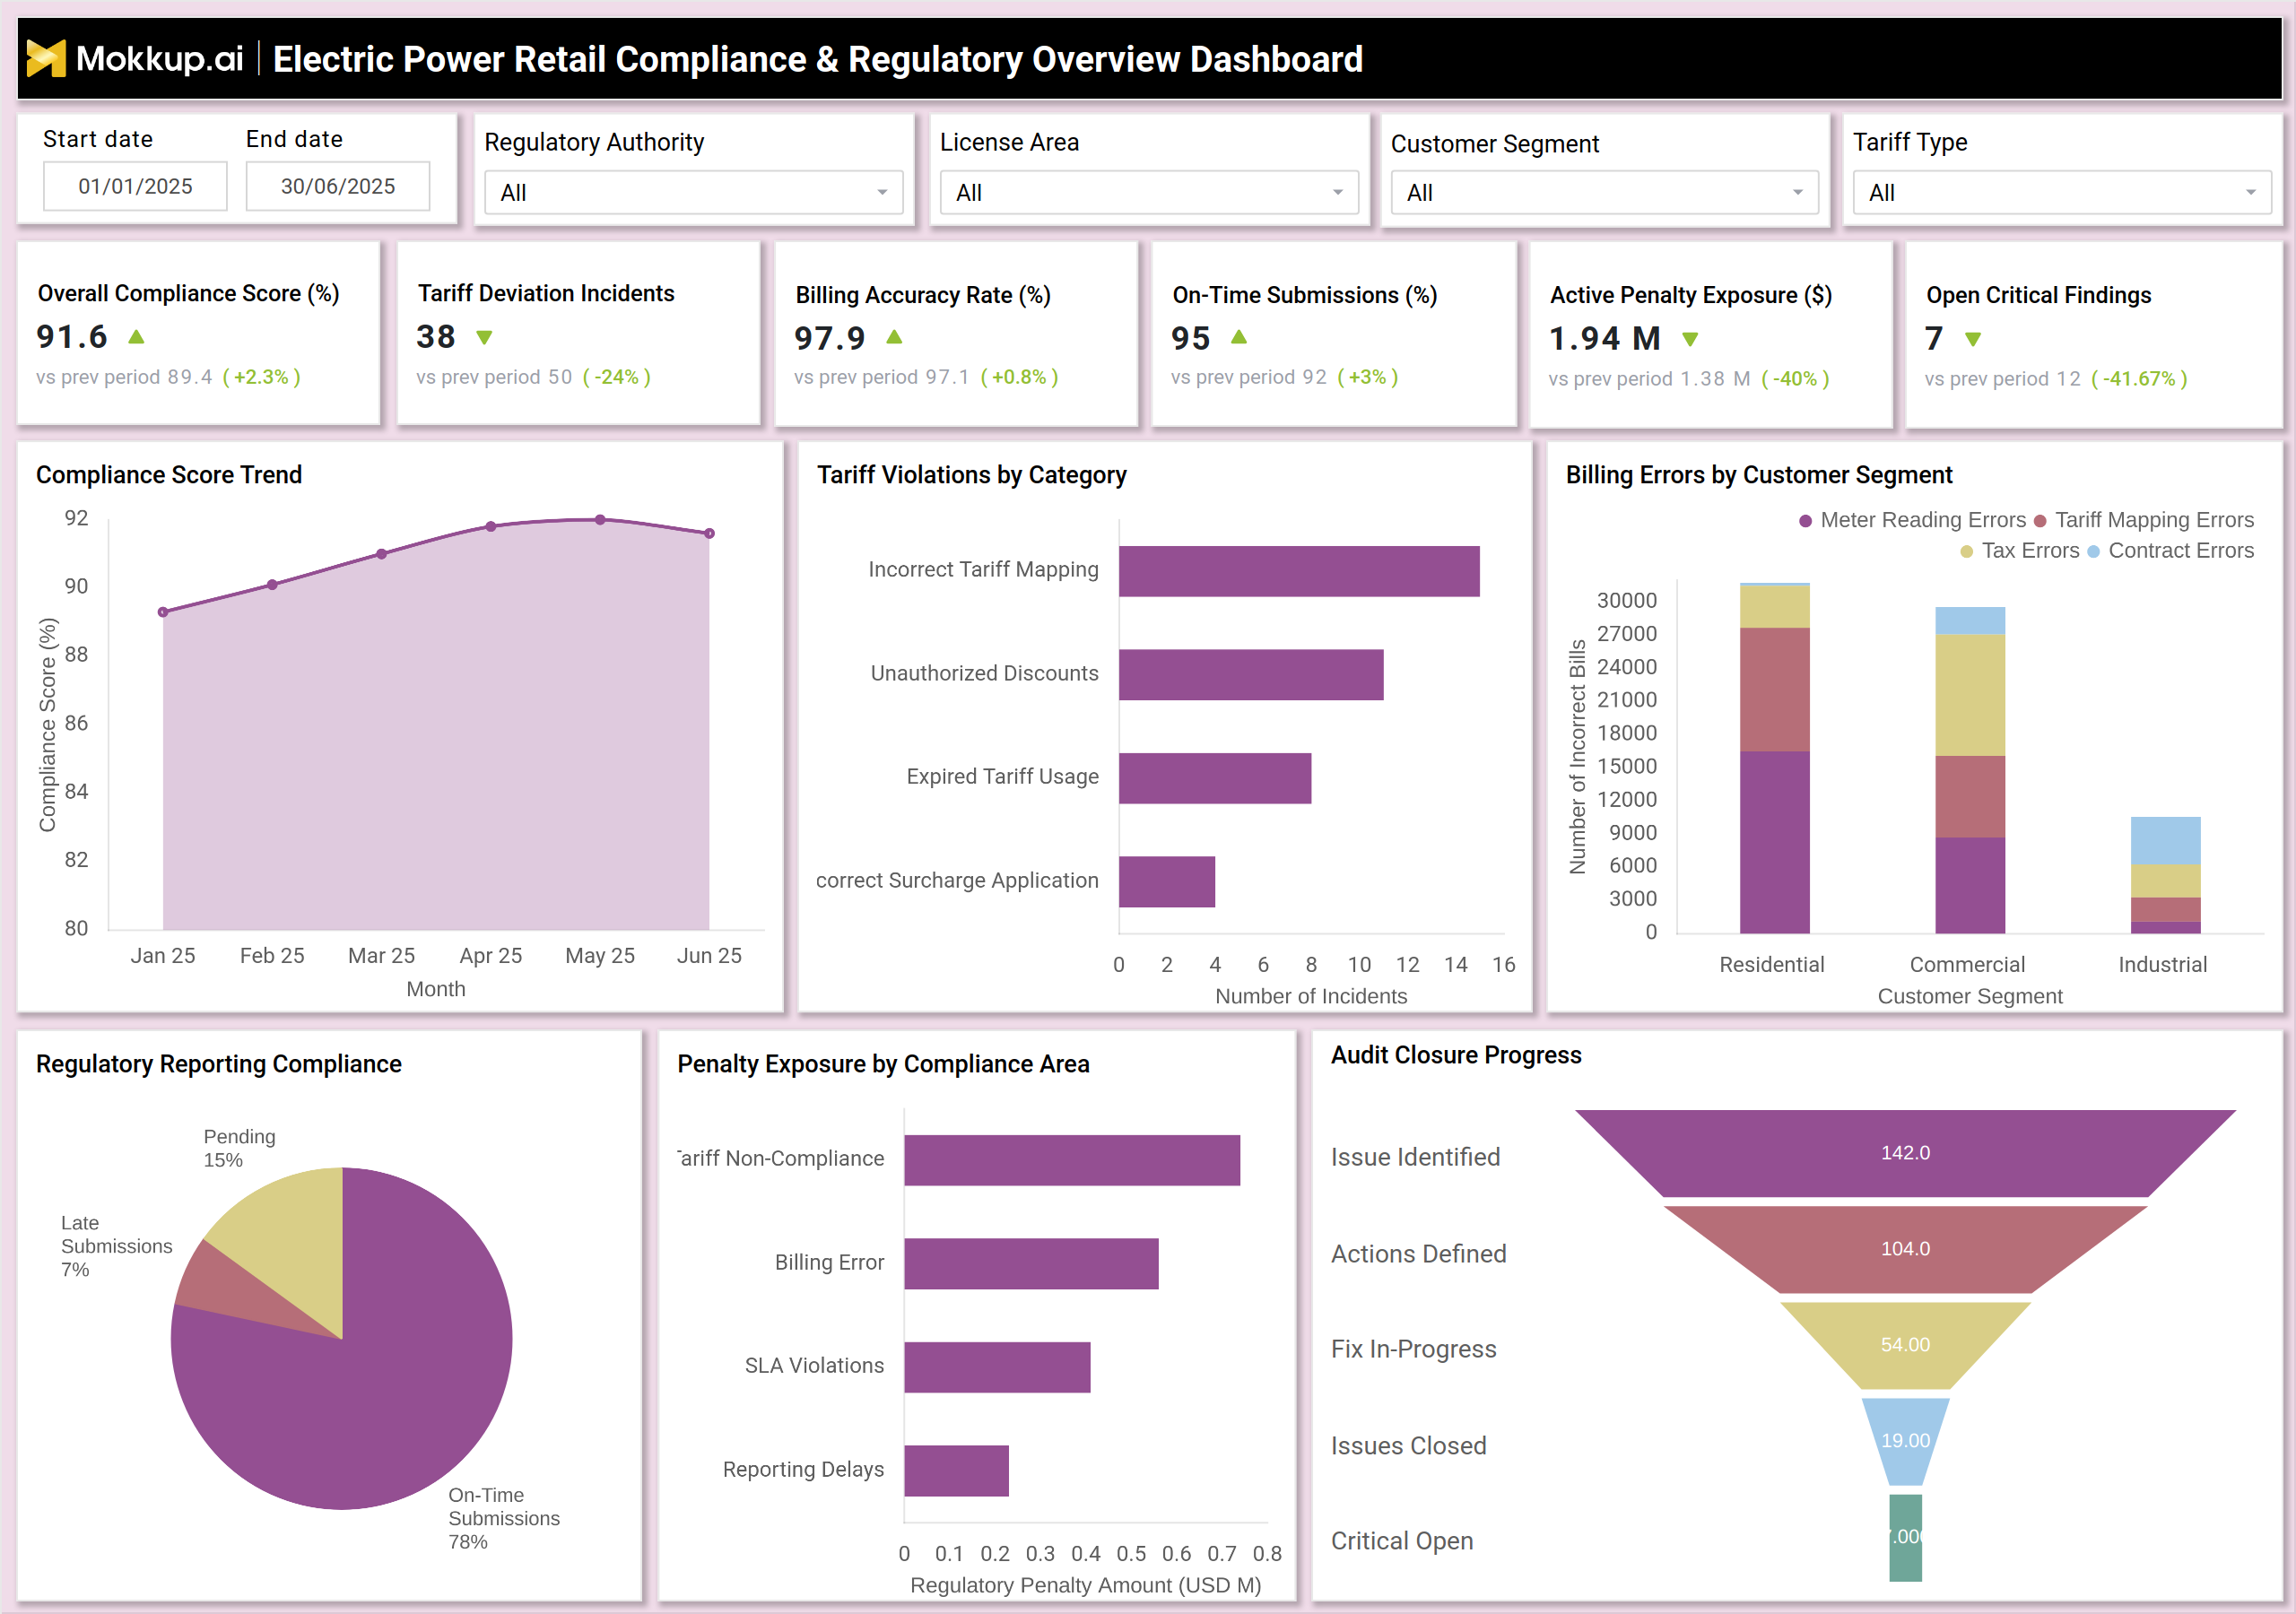
In this example dashboard, leadership can review the overall compliance score (91.6%), check the count of tariff deviation incidents (38), and validate billing accuracy rate (97.9%) for the period. The dashboard also shows on-time submissions (95%), active penalty exposure ($1.94M), and open critical findings (7) to quantify current compliance risk. A trend visual tracks how compliance performance is improving month over month. The dashboard also breaks down tariff violations by root cause (like incorrect mapping and unauthorized discounts), and highlights billing error distribution across customer segments. Finally, audit closure progress shows how quickly issues move from identification to closure, supporting audit governance and compliance improvement.
How to Analyze Data in Electric Power Retail Compliance & Regulatory Overview Dashboard
Here is how you can analyze data from this dashboard:
- Overall Compliance Trend: Start with the Overall Compliance Score Trend to confirm whether compliance performance is improving or declining over time.
- Tariff Governance Monitoring: Compare Tariff Deviation Incidents against the prior period to validate the effectiveness of tariff governance controls.
- Billing Accuracy Performance: Track Billing Accuracy Rate (%) and link any changes to billing error categories such as meter errors, mapping errors, and contract errors.
- Violation Category Analysis: Use Tariff Violations by Category to identify dominant compliance failures, including mapping issues, expired tariffs, discount errors, or surcharge miscalculations.
- Customer Segment Risk: Review Billing Errors by Customer Segment to identify high risk segments such as Residential, Commercial, or Industrial customers.
- Regulatory Filing Discipline: Monitor Regulatory Reporting Compliance to avoid late submission patterns and maintain reporting consistency.
- Penalty Risk Assessment: Analyze Penalty Exposure by Compliance Area to determine which failures are creating the highest financial liability.
- Audit Closure Tracking: Use the Audit Closure Progress Funnel to evaluate issue resolution speed from identification to final closure.
- Critical Findings Monitoring: Track Open Critical Findings as a direct indicator of audit readiness risk and regulatory vulnerability.
- Corrective Action Prioritization: Prioritize corrective actions based on a combination of high penalty exposure and high incident volume.
Benefits of Electric Power Retail Compliance & Regulatory Overview Dashboard
The following are the benefits of using this dashboard:
- Centralized Compliance View: Creates a single source of truth for regulatory compliance reporting and monitoring.
- Reduced Penalty Risk: Highlights deviation drivers early through structured utility compliance reporting analytics.
- Stronger Tariff Governance: Supports continuous retail tariff compliance tracking and control.
- Improved Billing Controls: Identifies billing error patterns at the customer segment level for faster correction.
- Audit Readiness: Enhances preparedness by tracking open findings and issue closure performance.
- Faster Management Decisions: Enables quicker action using compliance score trends and risk exposure indicators.
- Submission Discipline Monitoring: Helps leadership monitor on time regulatory filing performance.
- Clear Accountability: Maps penalty exposure directly to compliance areas to strengthen ownership and governance.
KPIs to Track in Electric Power Retail Compliance & Regulatory Overview Dashboard
The following key KPIs can be tracked by using this dashboard:
- Overall Compliance Score (%): Measures the overall compliance standing of the retail utility based on regulatory scorecards and internal controls.
- Tariff Deviation Incidents (count): Tracks the number of tariff-related deviations such as wrong tariffs applied or tariff misuse.
- Billing Accuracy Rate (%): Measures the percentage of bills generated correctly without tariff mapping errors, contract errors, or tax issues.
- On-Time Submissions (%): Tracks how consistently regulatory filings, reports, and compliance documents are submitted within due dates.
- Active Penalty Exposure ($): Measures the current value of penalties or regulatory financial exposure linked to compliance gaps.
- Open Critical Findings (count): Tracks unresolved critical audit issues that can trigger enforcement or compliance escalation.
- Late Submission Rate (%): Indicates proportion of filings delayed beyond regulatory timelines.
- Penalty Exposure by Compliance Area ($): Breaks penalty value across tariff non-compliance, billing error, SLA violations, and reporting delays.
- Tariff Violations by Category (count): Measures incident distribution across tariff mapping errors, expired tariff use, unauthorized discounts, and surcharge errors.
- Audit Closure Rate (%): Tracks the share of audit issues closed compared to total issues identified within the period.
Frequently Asked Questions
Q1. Who uses a retail electricity compliance dashboard?
Compliance teams, billing governance teams, internal audit teams, regulatory reporting officers, and retail business leadership.
Q2. Why is tariff compliance tracking critical for power retail utilities?
Tariffs directly impact billing and revenue realization. Incorrect mapping or unauthorized discounts can create penalties and regulatory escalation.
Q3. How does the dashboard help reduce penalties?
It identifies early warning indicators such as increasing violations, falling submission performance, or rising penalty exposure so teams can intervene quickly.