
What is a Natural Gas Shipper Service Quality & SLA Performance Dashboard?
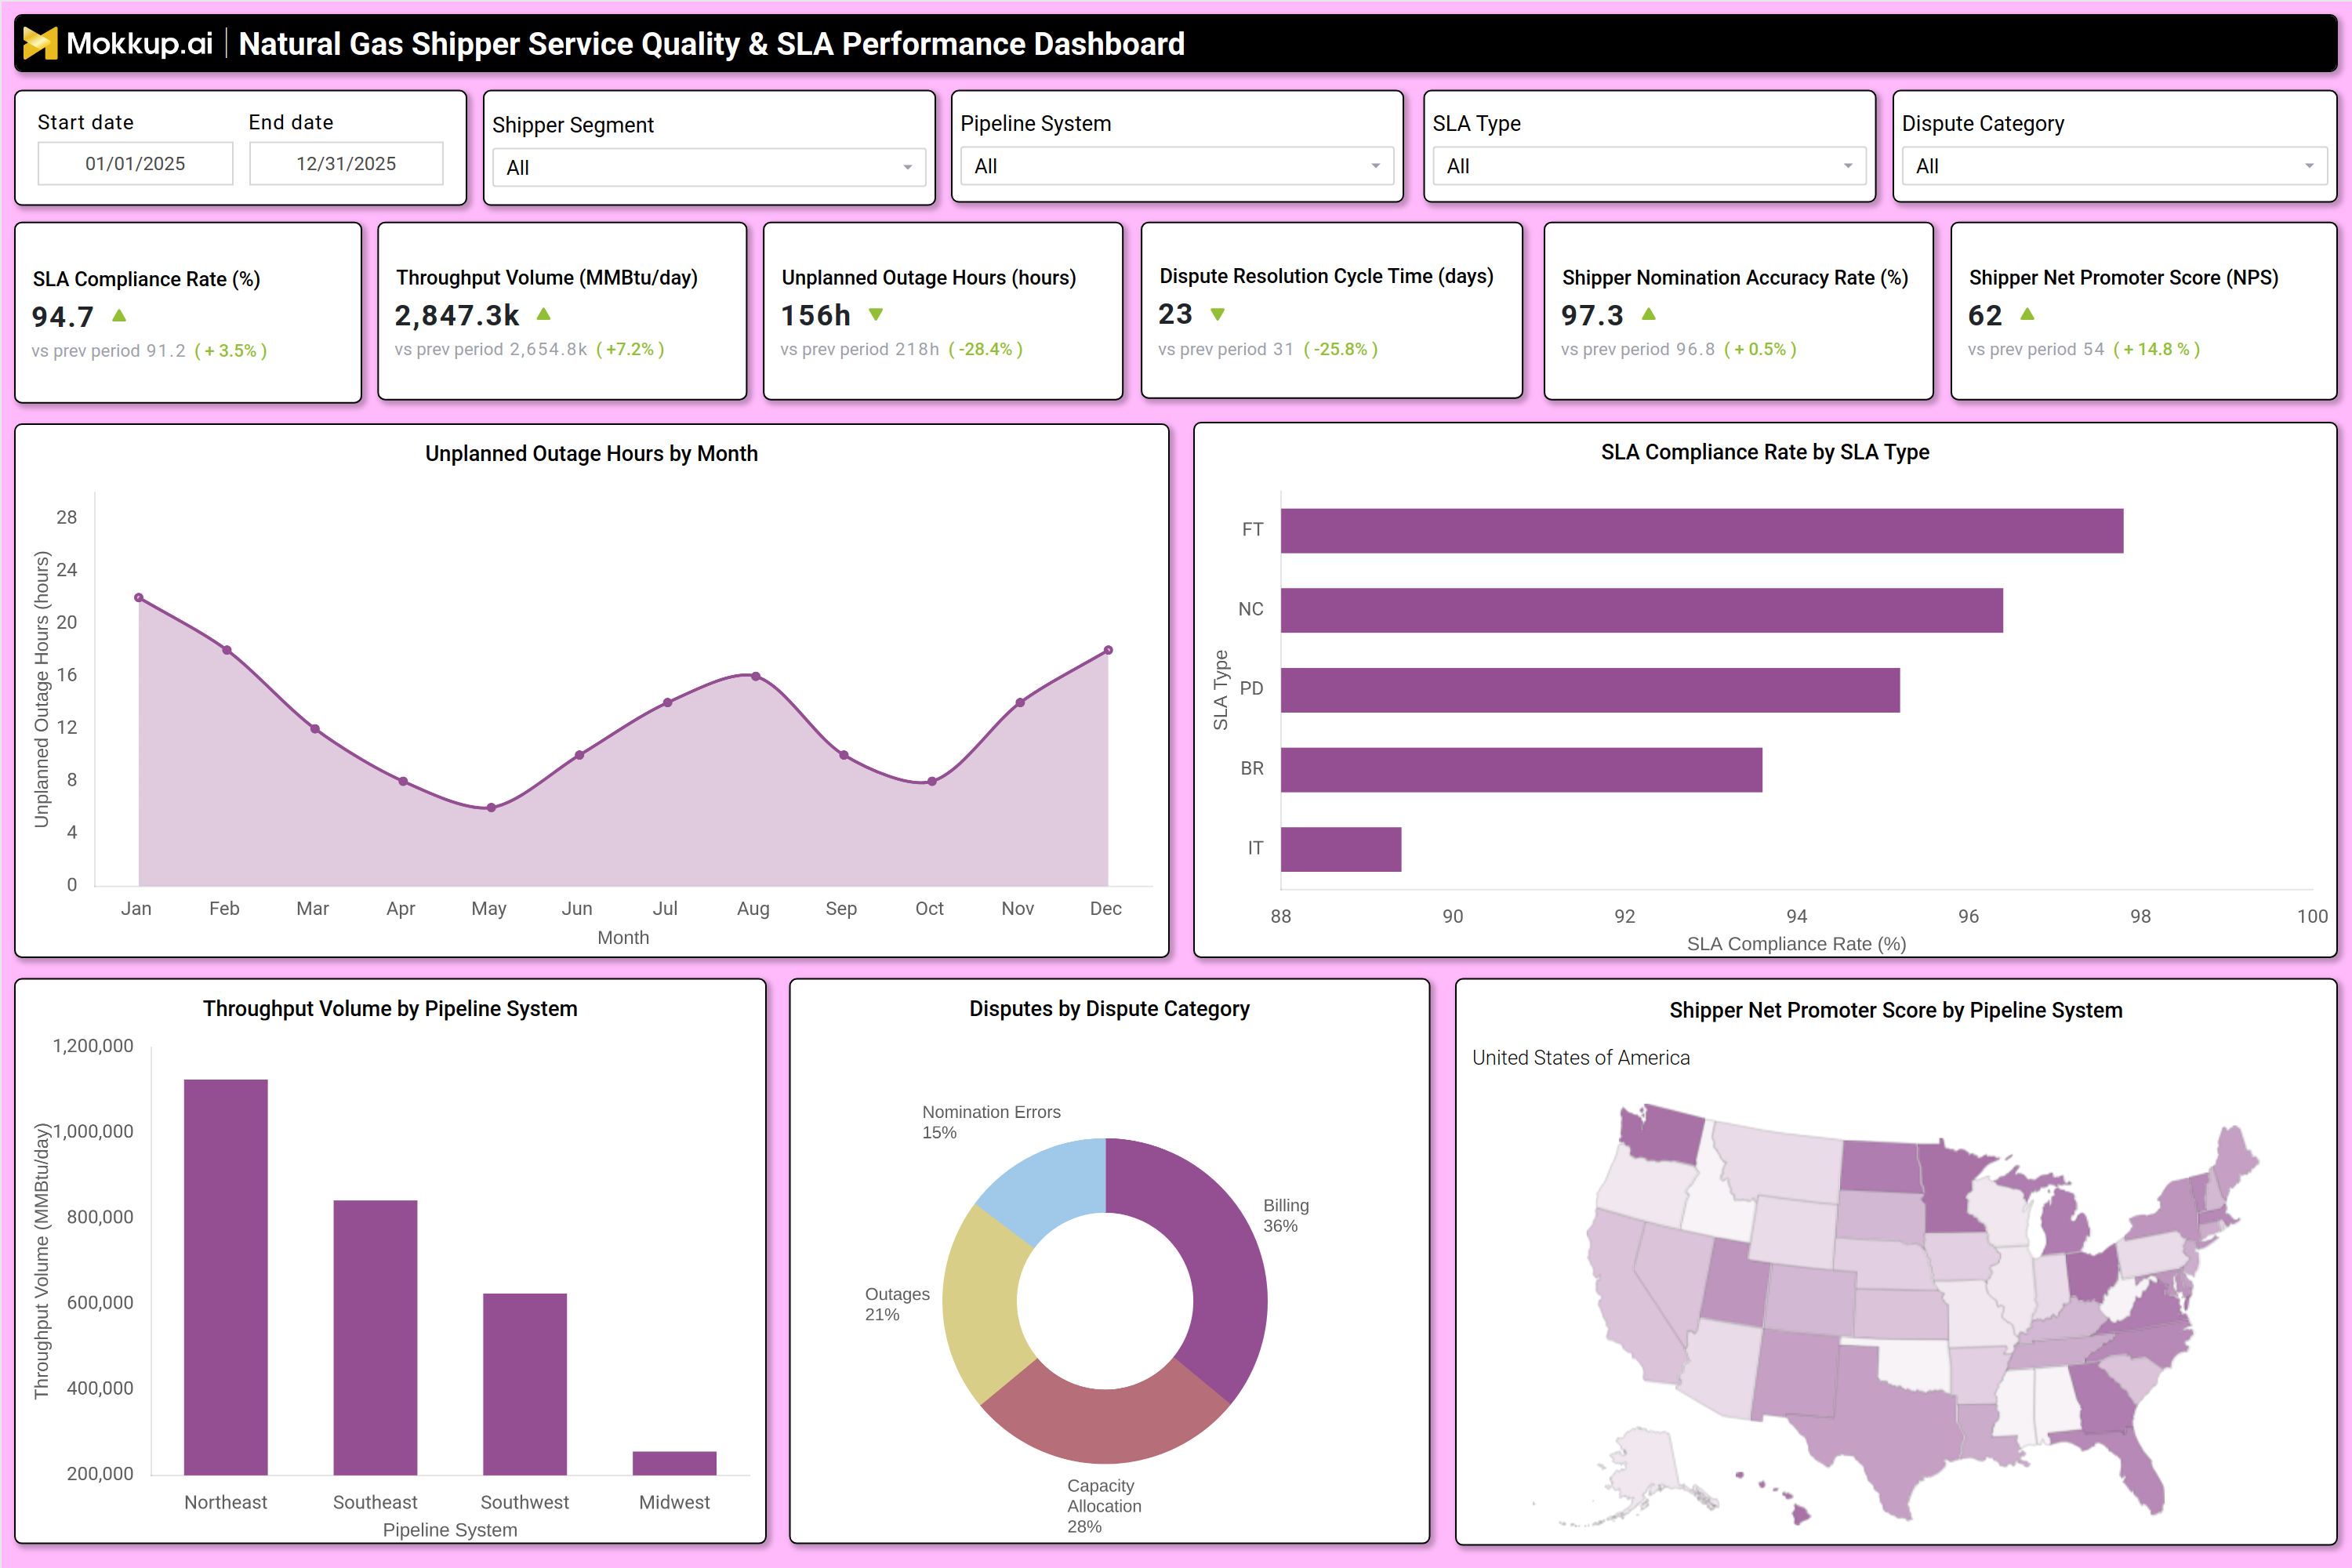
Natural gas pipelines move gas from producers to end users. A natural gas transmission shipper service quality & SLA performance dashboard provides pipeline operators, shippers, and regulators with a centralized platform to monitor service quality, track compliance with service level agreements (SLAs), and optimize transmission performance. This dashboard consolidates key metrics such as SLA compliance rates, throughput volumes, unplanned outage hours, dispute resolution times, and shipper satisfaction scores into a single view. By analyzing these metrics, stakeholders can identify inefficiencies, reduce operational risks, and ensure consistent service delivery across pipeline networks. The dashboard serves as a performance monitoring tool for gas transmission systems, enabling data-driven decision-making for capacity planning, dispute resolution, and regulatory reporting. It helps pipeline operators benchmark performance against industry standards, while shippers gain transparency into service reliability and compliance. With interactive filters for date ranges, shipper segments, pipeline systems, and SLA types, users can drill down into specific performance trends and take corrective actions where needed.
How to Create a Natural Gas Shipper Service Quality & SLA Performance Dashboard
You don't need to build your report from scratch, just start with a ready-to-use dashboard template from Mokkup. Add in your data and export it however you like. Here's how to do it:
1. Create or Log in to Your Mokkup Account
Start by signing up on Mokkup.ai using your email. If you already have an account, just log in, and you'll be good to go.
2. Choose and Customize Your Dashboard Template
Find the Natural Gas Transmission Shipper Service Quality & SLA Performance Dashboard template in the Templates section. Use the drag and drop editor to adjust KPIs, edit filters, or add elements based on your data.
3. Export to Your BI Tool
Once your dashboard wireframe is ready, use the BI Tool Export feature to send it directly to Power BI or Tableau for further analysis and enhancements. You can also download the dashboard as a PDF, PNG, or JPEG, embed it on a platform, or invite your team to collaborate.
Note: This is a Pro template. You'll need a Pro subscription on Mokkup to use and customize this dashboard wireframe. Upgrade anytime to unlock full access.
Natural Gas Shipper Service Quality & SLA Performance Dashboard Example
A well-designed Natural Gas Transmission Shipper Service Quality & SLA Performance Dashboard includes interactive filters and visualizations that provide a comprehensive view of transmission operations. For instance, the dashboard may feature SLA compliance rates, throughput volumes, unplanned outage hours, and dispute resolution cycle times as key performance tiles, with comparisons against previous periods to highlight improvements or declines. Trend charts track monthly unplanned outage hours, allowing operators to identify seasonal patterns or recurring issues. A bar chart breaks down throughput volumes by pipeline system, helping shippers assess capacity utilization across different regions. A pie chart categorizes disputes by type, such as nomination errors, billing issues, or capacity allocation conflicts, enabling targeted dispute resolution strategies. Additionally, a geographic heatmap displays shipper satisfaction scores by pipeline system, providing insights into regional performance variations. Together, these components create a shipper performance analytics platform that supports operational efficiency, regulatory compliance, and service quality improvements in natural gas transmission.
How to Analyze Data in a Natural Gas Shipper Service Quality & SLA Performance Dashboard
Here is how you can analyze data from this shipper satisfaction score dashboard:
- SLA Compliance Rates: Monitor compliance with service-level agreements (SLAs) to ensure contractual commitments are consistently met and identify areas requiring corrective action.
- Throughput Volumes: Track transmission throughput to evaluate pipeline capacity utilization, optimize operations, and identify potential bottlenecks affecting performance.
- Unplanned Outage Hours: Review the duration and frequency of unexpected outages to assess system reliability and reduce service disruptions.
- Dispute Resolution Cycle Times: Measure the time taken to resolve disputes to improve response efficiency, enhance stakeholder satisfaction, and minimize operational conflicts.
- Shipper Nomination Accuracy Rates: Analyze nomination accuracy to ensure efficient capacity allocation, reduce scheduling errors, and improve operational planning.
- Shipper Net Promoter Score (NPS): Evaluate customer satisfaction and loyalty levels to identify service improvement opportunities and strengthen shipper relationships.
- Disputes by Category: Categorize and analyze disputes to identify recurring issues, prioritize resolution efforts, and address high-impact problem areas.
- Performance Trends Over Time: Assess historical performance patterns to identify long-term improvements, emerging challenges, and overall service quality trends.
Benefits of a Natural Gas Shipper Service Quality & SLA Performance Dashboard
The following are the benefits of using this dispute resolution tracking dashboard:
- Enhanced Service Reliability: Track SLA compliance and monitor unplanned outages to improve service consistency, minimize disruptions, and ensure reliable pipeline operations.
- Improved Operational Transparency: Provide clear visibility into performance metrics for shippers, regulators, and pipeline operators, fostering accountability and informed decision-making.
- Optimized Pipeline Capacity Utilization: Leverage throughput analysis to identify capacity constraints, improve resource allocation, and maximize pipeline efficiency.
- Reduced Dispute Resolution Times: Use structured performance tracking to identify bottlenecks in dispute management and accelerate issue resolution.
- Stronger Regulatory Compliance: Support adherence to regulatory requirements through accurate performance monitoring, documentation, and reporting.
- Higher Shipper Satisfaction: Proactively address service quality concerns and operational issues to improve customer experience and strengthen stakeholder relationships.
- Continuous Performance Improvement: Benchmark operational performance against industry standards to identify improvement opportunities and drive ongoing optimization efforts.
KPIs to Track in a Natural Gas Shipper Service Quality & SLA Performance Dashboard
The following key KPIs can be tracked by using this dashboard:
- SLA Compliance Rate (%): Measures the percentage of service level agreements met within specified timeframes.
- Throughput Volume (MMBtu/day): Tracks daily gas transmission volumes to assess pipeline capacity utilization.
- Unplanned Outage Hours (hours): Monitors unexpected downtime to evaluate system reliability.
- Dispute Resolution Cycle Time (days): Measures the average time taken to resolve shipper disputes.
- Shipper Nomination Accuracy Rate (%): Evaluates the precision of capacity allocation requests from shippers.
- Shipper Net Promoter Score (NPS): Assesses customer satisfaction and loyalty based on shipper feedback.
Frequently Asked Questions
1. What is a pipeline performance monitoring dashboard used for?
It is an analytics platform that tracks service quality, SLA compliance, and operational performance for natural gas transmission systems.
2. What data sources feed into this shipper service quality dashboard?
Pipeline SCADA systems, nomination platforms, dispute management tools, and customer feedback systems.
3. Who should use a natural gas transmission SLA dashboard?
Pipeline operators, shippers, regulators, and energy traders use it to monitor transmission efficiency and service reliability.