
What is a Natural Gas Transmission Market Interface & Capacity Trading Dashboard?
A Natural Gas Transmission Market Interface & Capacity Trading Dashboard is a centralized analytics solution designed to monitor, analyze, and optimize pipeline capacity usage and trading activities across natural gas transmission networks. It combines commercial, operational, and regulatory data into a single view, enabling operators to track capacity bookings, nomination accuracy, gas trading volumes, and imbalance metrics. This type of natural gas transmission dashboard helps pipeline operators and utilities manage market interactions efficiently while ensuring compliance with tariff regulations and contractual obligations. The dashboard acts as a gas transmission market interface dashboard, connecting trading activities with operational performance. It provides visibility into capacity utilization, trading prices, and settlement risks. By integrating data from scheduling systems, trading platforms, and SCADA systems, it supports decision-making and improves coordination between shippers, operators, and regulators.
How to Create a Natural Gas Transmission Market Interface & Capacity Trading Dashboard
You don't need to build your report from scratch; just start with a ready-to-use dashboard template from Mokkup. Add in your data and export it however you like. Here's how to do it:
1. Create or Log in to Your Mokkup Account
Start by signing up on Mokkup.ai using your email. If you already have an account, just log in, and you'll be good to go.
2. Choose and Customize Your Dashboard Template
Find the Natural Gas Transmission Market Interface & Capacity Trading Dashboard template in the Templates section. Use the drag-and-drop editor to adjust KPIs, edit filters, or add elements based on your data.
3. Export to Your BI Tool
Once your dashboard wireframe is ready, use the BI Tool Export feature to send it directly to Power BI or Tableau for further analysis and enhancements. You can also download the dashboard as a PDF, PNG, or JPEG, embed it on a platform, or invite your team to collaborate.
Note: This is a Pro template. You'll need a Pro subscription on Mokkup to use and customize this dashboard wireframe. Upgrade anytime to unlock full access.
Natural Gas Transmission Market Interface & Capacity Trading Dashboard Example
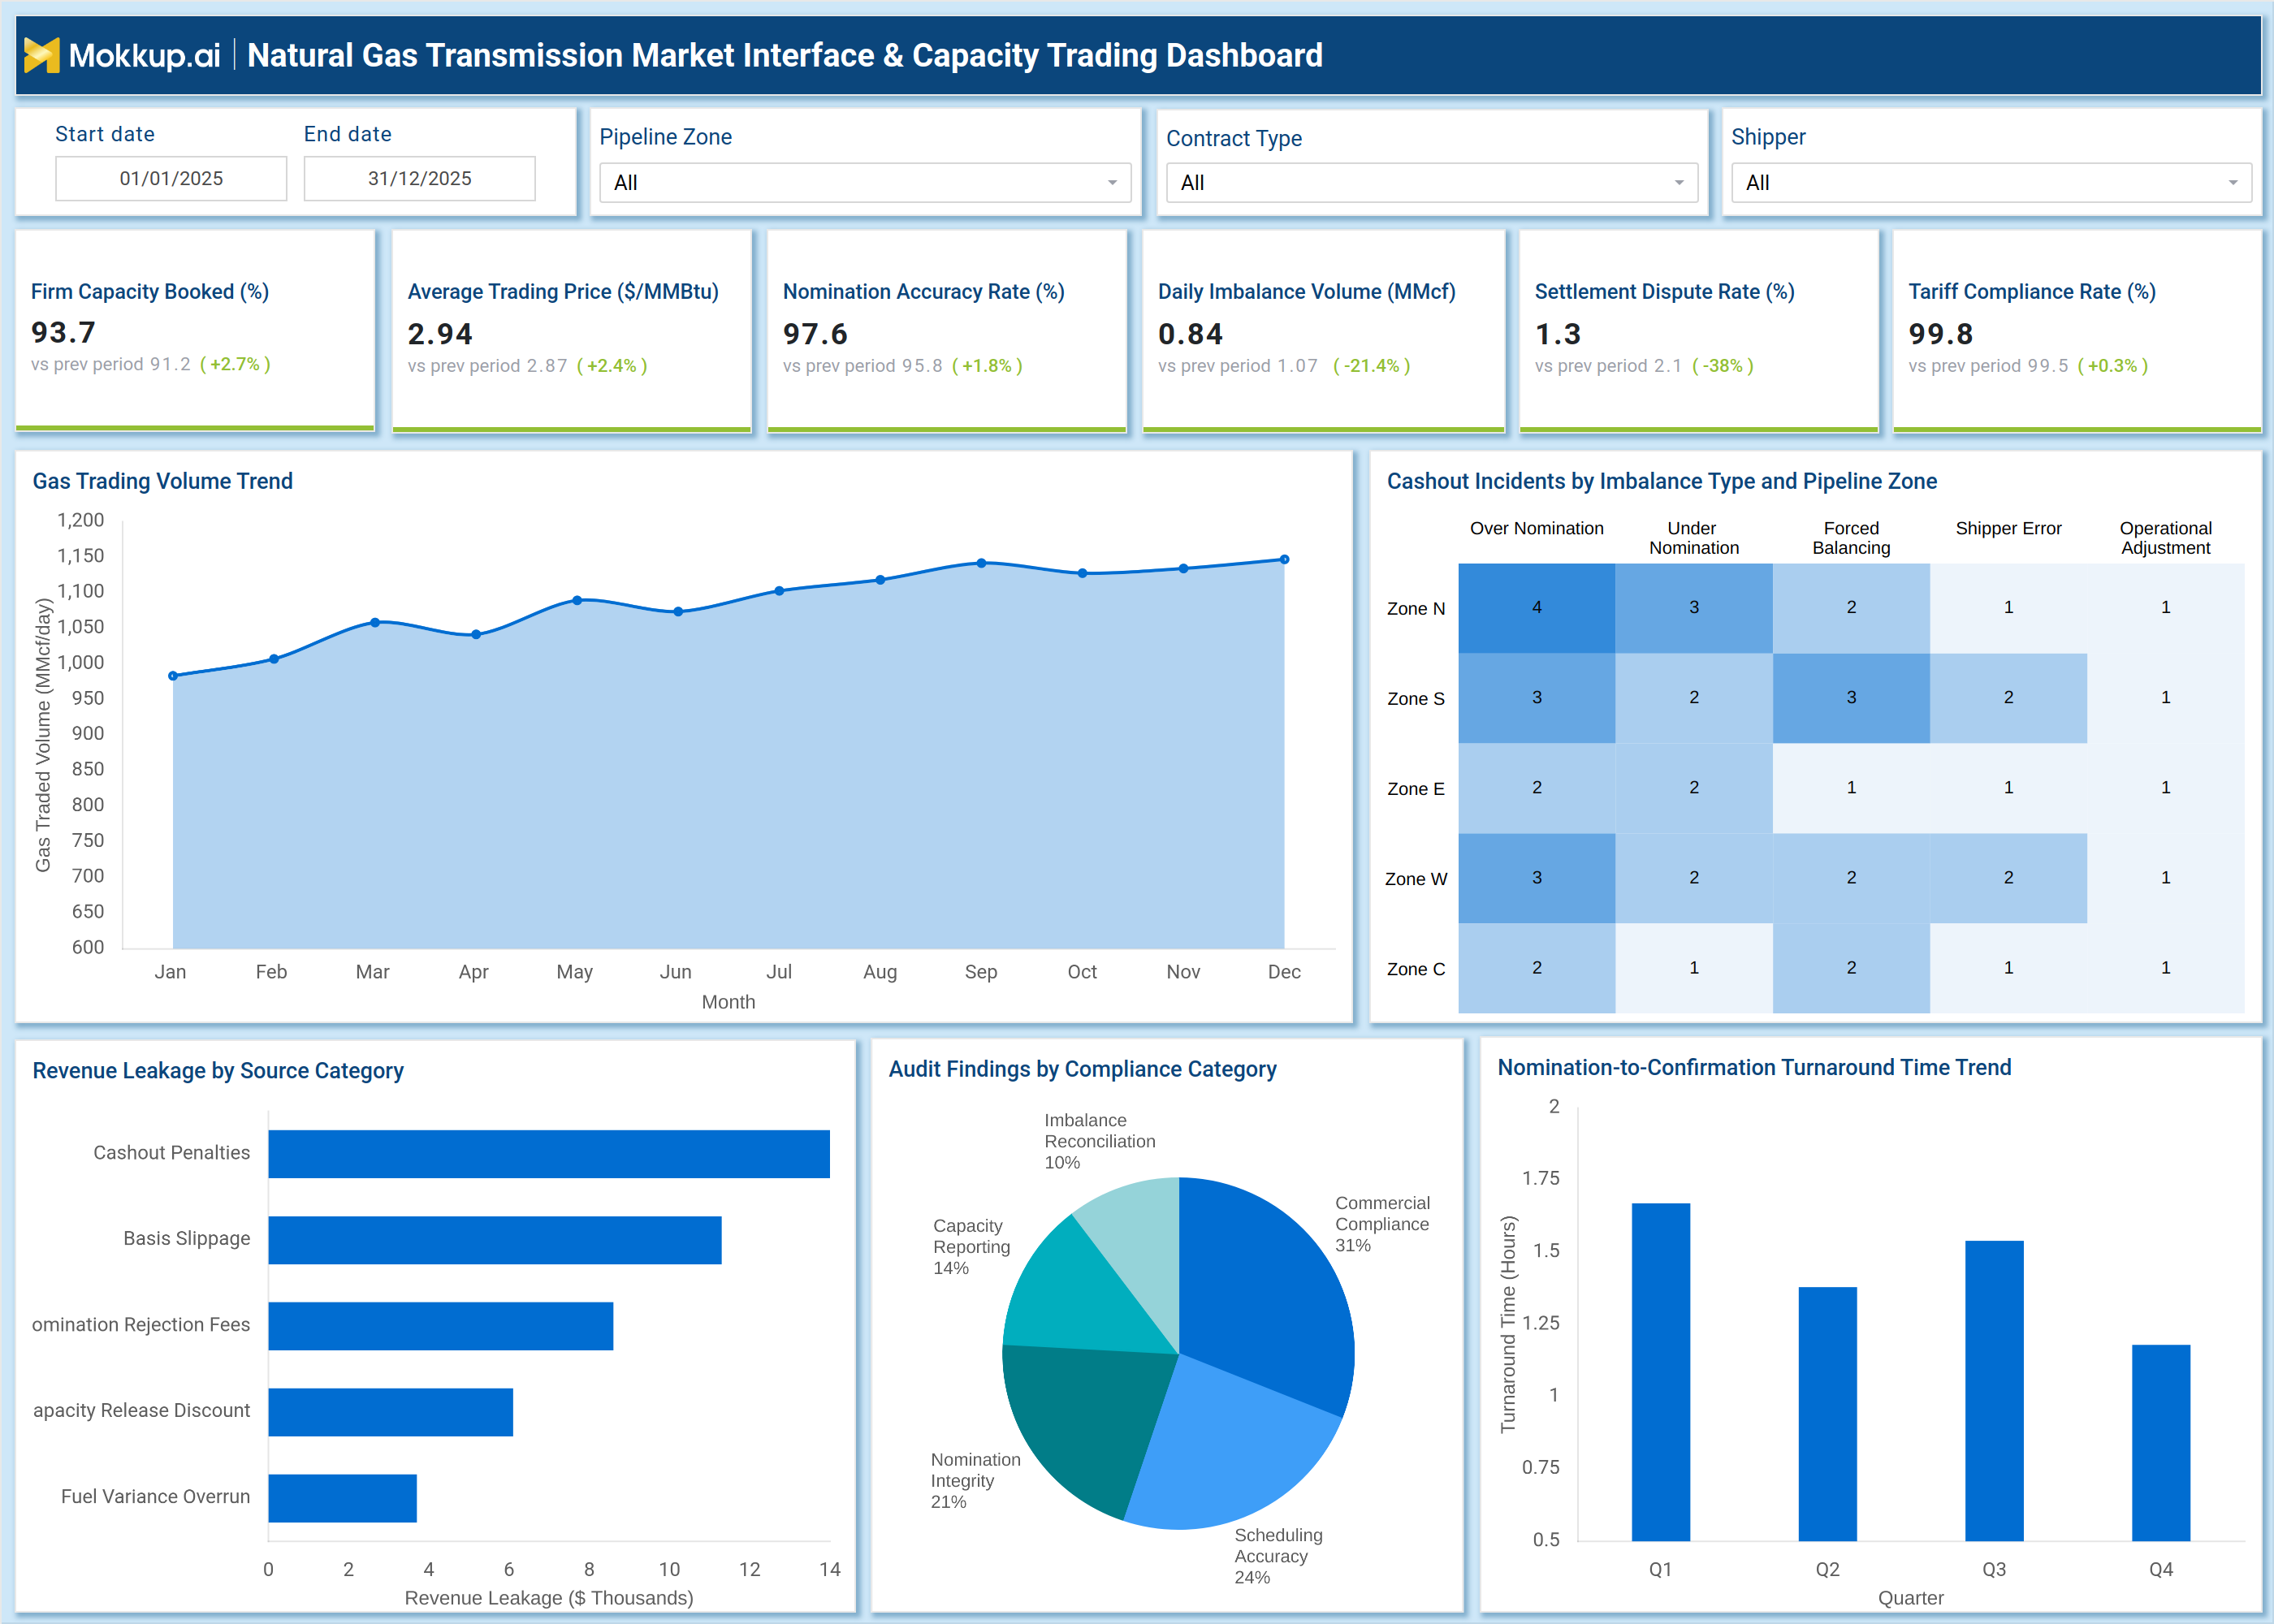
A typical implementation of this dashboard provides a comprehensive view of both trading performance and pipeline utilization. At the top level, key KPIs such as firm capacity booked, average trading price, nomination accuracy rate, daily imbalance volume, and tariff compliance rate give a snapshot of commercial and operational health. These metrics help operators understand how effectively pipeline capacity is being utilized and traded. The dashboard also includes a pipeline capacity trading dashboard view that tracks gas trading volume trends across months, allowing operators to identify seasonal demand patterns and optimize capacity allocation. A heatmap of cashout incidents by imbalance type and pipeline zone highlights operational inefficiencies such as over-nomination or under-nomination. This enables targeted corrective actions. Additional visuals, such as revenue leakage analysis, audit findings by compliance category, and nomination-to-confirmation turnaround time, provide deeper insights into financial performance and operational efficiency. Together, these elements form a complete gas capacity trading analytics dashboard that supports both strategic planning and daily operations.
How to Analyze Data in Natural Gas Transmission Market Interface & Capacity Trading Dashboard
Here is how you can analyze data from this dashboard:
- Track firm capacity booked (%) to evaluate how much pipeline capacity is utilized versus available capacity
- Monitor gas trading volume trends to identify demand patterns and seasonal fluctuations
- Analyze nomination accuracy rate (%) to detect scheduling inefficiencies and reduce imbalances
- Review daily imbalance volume to understand operational deviations between scheduled and actual flows
- Evaluate average trading price ($/MMBtu) to assess market competitiveness and revenue potential
- Identify cashout incidents by imbalance type to pinpoint operational issues like over-nomination or forced balancing
- Examine pipeline zone performance to detect regional inefficiencies in capacity utilization
- Analyze revenue leakage sources such as penalties, slippage, and rejection fees to improve financial performance
- Track nomination-to-confirmation turnaround time to improve scheduling efficiency
- Review audit findings and compliance metrics to ensure adherence to tariff and regulatory requirements
Benefits of Natural Gas Transmission Market Interface & Capacity Trading Dashboard
The following are the benefits of using this dashboard:
- Improves visibility into pipeline capacity usage with a pipeline capacity utilization dashboard
- Enables efficient capacity allocation through a transmission capacity booking dashboard
- Enhances trading decisions using insights from a gas capacity trading analytics dashboard
- Reduces imbalance risks by monitoring nomination accuracy and operational deviations
- Minimizes revenue leakage through detailed financial and penalty tracking
- Improves coordination between shippers, operators, and regulators
- Supports regulatory compliance with integrated audit and tariff monitoring
- Optimizes pipeline throughput and reduces underutilization
- Enhances operational efficiency with faster nomination and confirmation cycles
- Provides a unified natural gas transmission dashboard for commercial and operational teams
KPIs to Track in Natural Gas Transmission Market Interface & Capacity Trading Dashboard
The following key KPIs can be tracked by using this dashboard:
- Firm Capacity Booked (%) – Measures utilization of available pipeline capacity
- Average Trading Price ($/MMBtu) – Indicates market pricing trends and revenue potential
- Nomination Accuracy Rate (%) – Tracks alignment between scheduled and actual gas flows
- Daily Imbalance Volume (MMcf) – Measures deviation in gas delivery versus nomination
- Settlement Dispute Rate (%) – Indicates frequency of billing or settlement issues
- Tariff Compliance Rate (%) – Ensures adherence to regulatory and contractual requirements
- Gas Trading Volume (MMcf/day) – Tracks total traded gas across the network
- Cashout Incident Count – Measures operational inefficiencies and imbalance penalties
- Revenue Leakage ($) – Identifies financial losses from penalties and inefficiencies
- Nomination Turnaround Time (hours) – Measures efficiency of scheduling processes
Frequently Asked Questions
1. Who uses a Natural Gas Transmission Market Interface & Capacity Trading Dashboard?
Pipeline operators, natural gas utilities, energy traders, and regulatory teams use this dashboard to monitor capacity utilization, trading performance, and compliance.
2. How does this dashboard improve pipeline capacity utilization?
It provides insights into capacity booking, trading volumes, and underutilized segments, enabling operators to optimize allocation and reduce idle capacity.
3. What is the role of nomination accuracy in gas transmission?
Nomination accuracy ensures that scheduled gas volumes match actual flows, reducing imbalances, penalties, and operational disruptions.
4. What KPIs are tracked in a Natural Gas Transmission Market Interface & Capacity Trading Dashboard?
Key KPIs include firm capacity booked (%), average trading price ($/MMBtu), nomination accuracy rate (%), daily imbalance volume (MMcf), settlement dispute rate (%), tariff compliance rate (%), gas trading volume (MMcf/day), and cashout incident count.
5. How does the dashboard support regulatory compliance in gas transmission?
The dashboard integrates audit findings and tariff compliance metrics, providing visibility into regulatory requirements and helping operators ensure adherence to contractual obligations and industry standards.