
What is a Natural Gas Transmission Pipeline Materials, Spares & Vendor Management Dashboard?
Natural gas transmission pipelines require precise management of materials, spare parts, and vendor performance to ensure operational efficiency and reliability. A Natural Gas Transmission Pipeline Materials, Spares & Vendor Management Dashboard serves as a centralized analytics tool that tracks procurement, inventory, vendor performance, and failure incidents.
This dashboard integrates data from procurement systems, inventory logs, and vendor performance metrics to provide actionable insights for pipeline operators. By monitoring critical spares inventory, vendor delivery performance, and material failure trends, utilities can optimize supply chain efficiency, reduce downtime, and control costs.
How to Create a Natural Gas Transmission Pipeline Materials, Spares & Vendor Management Dashboard
You don't need to build your report from scratch; just start with a ready-to-use dashboard template from Mokkup.ai. Add in your data and export it however you like. Here's how to do it:
1. Create or Log in to Your Mokkup Account
Start by signing up on Mokkup.ai using your email. If you already have an account, just log in, and you'll be good to go.
2. Choose and Customize Your Dashboard Template
Find the Natural Gas Transmission Pipeline Materials, Spares & Vendor Management Dashboard template in the Templates section. Use the drag and drop editor to adjust KPIs, edit filters, or add elements based on your data.
3. Export to Your BI Tool
Once your dashboard wireframe is ready, use the BI Tool Export feature to send it directly to Power BI or Tableau for further analysis and enhancements. You can also download the dashboard as a PDF, PNG, or JPEG, embed it on a platform, or invite your team to collaborate.
Note: This is a Pro template. You'll need a Pro subscription on Mokkup to use and customize this dashboard wireframe. Upgrade anytime to unlock full access.
Natural Gas Transmission Pipeline Materials, Spares & Vendor Management Dashboard Example
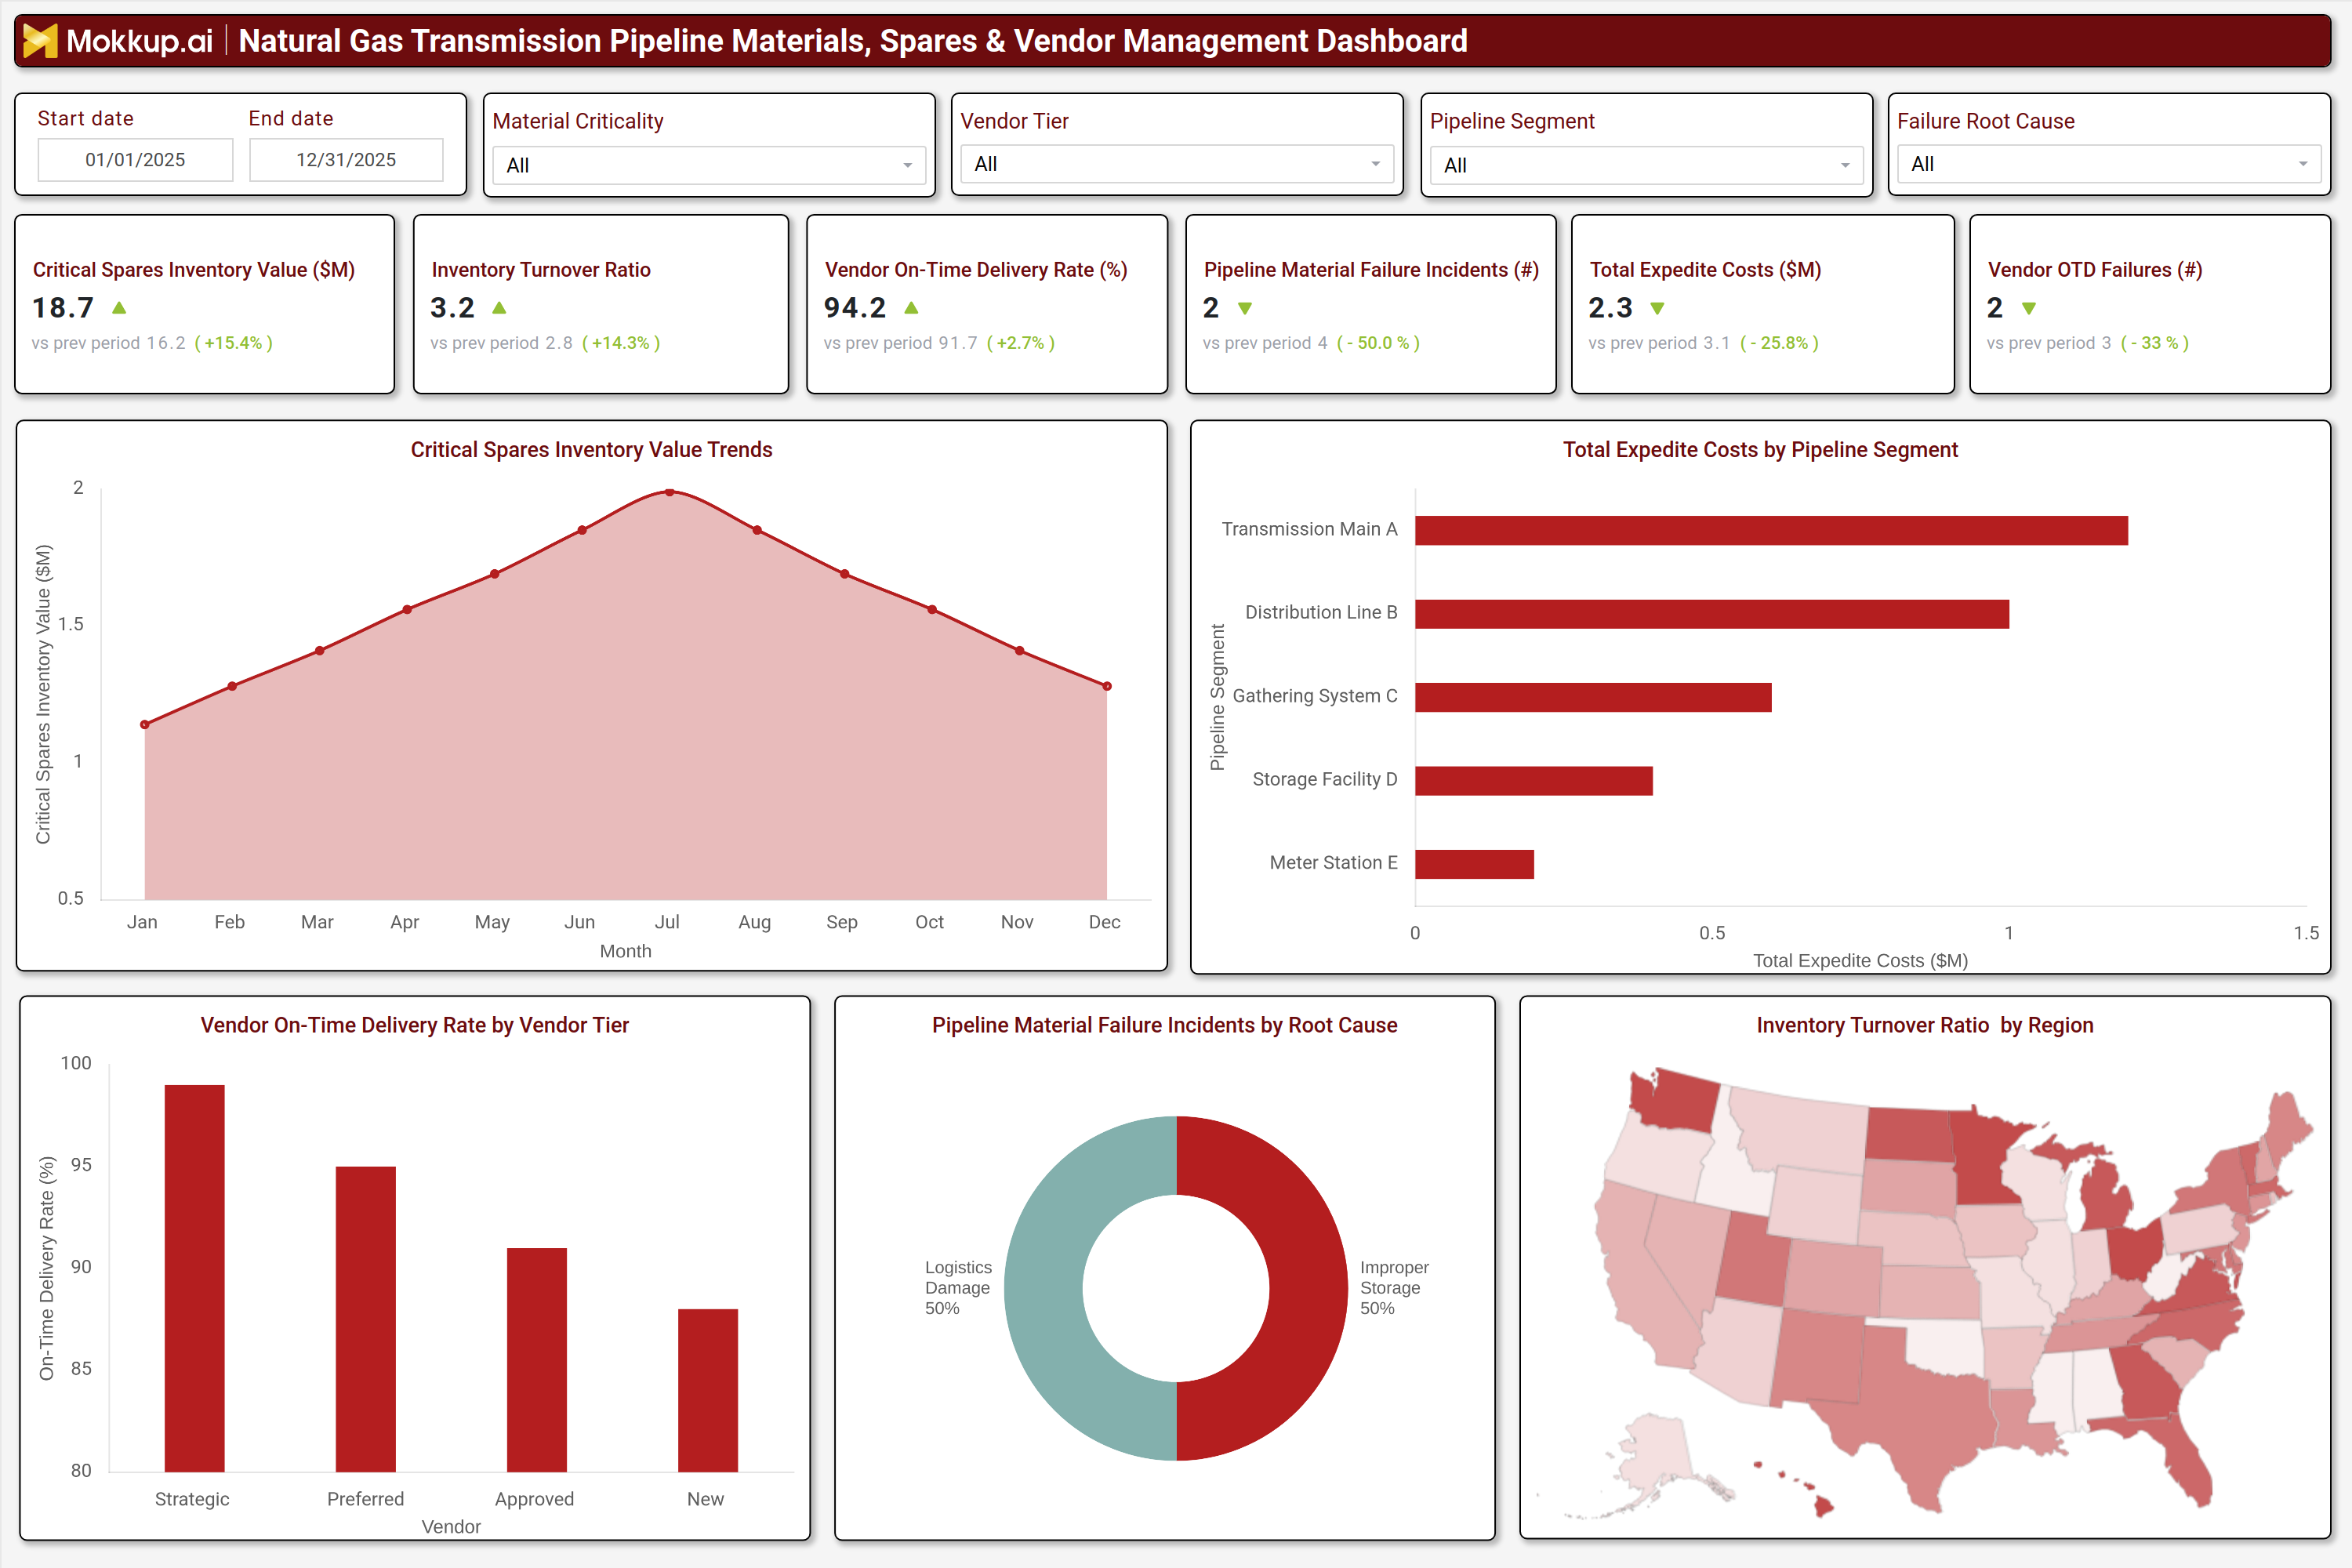
A well-structured Natural Gas Transmission Pipeline Materials, Spares & Vendor Management Dashboard includes interactive filters for date ranges, material criticality, vendor tiers, pipeline segments, and failure root causes. Key performance tiles display critical spares inventory value, inventory turnover ratio, vendor on time delivery rates, pipeline material failure incidents, expedite costs, and vendor OTD (On Time Delivery) failures.
Trend charts track critical spares inventory value over time, while bar graphs compare expedited costs by pipeline segment. Vendor performance is analyzed by tier, and failure incidents are categorized by root cause. A geographic heatmap visualizes inventory turnover ratios by region, helping operators identify inefficiencies in procurement and logistics. Together, these components provide a comprehensive view of supply chain health, enabling data-driven decision-making for pipeline maintenance and vendor management.
How to Analyze Data in a Natural Gas Transmission Pipeline Materials, Spares & Vendor Management Dashboard
Here is how you can analyze data from this dashboard:
- Monitor critical spares inventory value to ensure sufficient stock levels for emergency repairs.
- Track inventory turnover ratio to assess procurement efficiency and avoid overstocking or shortages.
- Evaluate vendor on time delivery rates to identify reliable suppliers and address performance gaps.
- Analyze pipeline material failure incidents to detect recurring issues and improve maintenance strategies.
- Review expedite costs by pipeline segment to optimize logistics and reduce emergency procurement expenses.
- Compare vendor performance by tier to prioritize strategic partnerships and negotiate better terms.
- Assess failure root causes to implement preventive measures and reduce downtime.
- Use geographic inventory turnover data to optimize regional procurement and distribution strategies.
Benefits of a Natural Gas Transmission Pipeline Materials, Spares & Vendor Management Dashboard
The following are the benefits of using this Pipeline Logistics Dashboard:
- Enhances supply chain visibility by tracking material procurement, inventory, and vendor performance in one platform.
- Reduces downtime through proactive spares inventory management and failure incident analysis.
- Lowers procurement costs by optimizing inventory levels and minimizing expedite expenses.
- Improves vendor accountability with performance tracking and tier-based evaluations.
- Supports predictive maintenance by identifying material failure trends and root causes.
- Streamlines compliance reporting with automated data collection and analytics.
- Enables data-driven decision-making for procurement, logistics, and maintenance planning.
KPIs to Track in a Natural Gas Transmission Pipeline Materials, Spares & Vendor Management Dashboard
The following key KPIs can be tracked by using this Transmission Pipeline Materials Dashboard:
- Critical Spares Inventory Value ($M): Measures the total value of essential spare parts in stock to prevent operational disruptions.
- Inventory Turnover Ratio: Indicates how efficiently inventory is used and replenished, calculated as cost of goods sold divided by average inventory.
- Vendor On-Time Delivery Rate (%): Tracks the percentage of orders delivered on schedule to assess supplier reliability.
- Pipeline Material Failure Incidents (count): Counts material-related failures to identify maintenance and procurement improvement areas.
- Total Expedite Costs ($M): Monitors emergency procurement expenses to control logistics and supply chain costs.
- Vendor OTD Failures (count): Measures the number of late deliveries to evaluate vendor performance and contract compliance.
Frequently Asked Questions
1. Who should use a Gas Transmission Pipeline Material Supply Chain Dashboard?
Pipeline operators, procurement managers, maintenance teams, and supply chain analysts use this dashboard to optimize material procurement, inventory, and vendor performance.
2. What data sources feed into a Vendor Performance Tracking Dashboard?
Procurement systems, inventory logs, vendor performance reports, and failure incident databases provide the data for this dashboard.
3. How can a Pipeline Spares Management Dashboard improve efficiency?
It provides insights into inventory turnover, vendor reliability, and failure trends, enabling operators to reduce costs and improve supply chain resilience.