
What is a Natural Gas Retail Operations & Service Delivery Performance Dashboard?
A natural gas retail operations dashboard is an analytics tool used by gas utilities to monitor retail service performance, customer service efficiency, and supply reliability. It consolidates operational, customer, and service delivery metrics into a unified view to support data-driven decision-making. This gas retail service delivery dashboard tracks key indicators such as supply fulfillment, network uptime, complaint resolution, service timeliness, and unaccounted gas loss. It helps utilities ensure consistent service delivery while maintaining operational efficiency. In addition, a gas utility retail performance analytics dashboard enables monitoring across regions, service types, and customer segments. It provides insights into demand-supply balance, service disruptions, and customer experience, allowing utilities to optimize operations and improve service quality.
How to Create a Natural Gas Retail Operations & Service Delivery Performance Dashboard?
You don’t need to build your report from scratch; just start with a ready-to-use dashboard template from Mokkup. Add in your data and export it however you like. Here’s how to do it:
1. Create or Log in to Your Mokkup Account
Start by signing up on Mokkup.ai using your email. If you already have an account, just log in, and you’ll be good to go.
2. Choose and Customize Your Dashboard Template
Find the Natural Gas Retail Operations & Service Delivery Performance Dashboard template in the Templates section. Use the drag-and-drop editor to adjust KPIs, edit filters, or add elements based on your data.
3. Export to Your BI Tool
Once your dashboard wireframe is ready, use the BI Tool Export feature to send it directly to Power BI or Tableau for further analysis and enhancements. You can also download the dashboard as a PDF, PNG, or JPEG, embed it on a platform, or invite your team to collaborate.
Note: This is a Pro template. You’ll need a Pro subscription on Mokkup to use and customize this dashboard wireframe. Upgrade anytime to unlock full access.
Natural Gas Retail Operations & Service Delivery Performance Dashboard Example
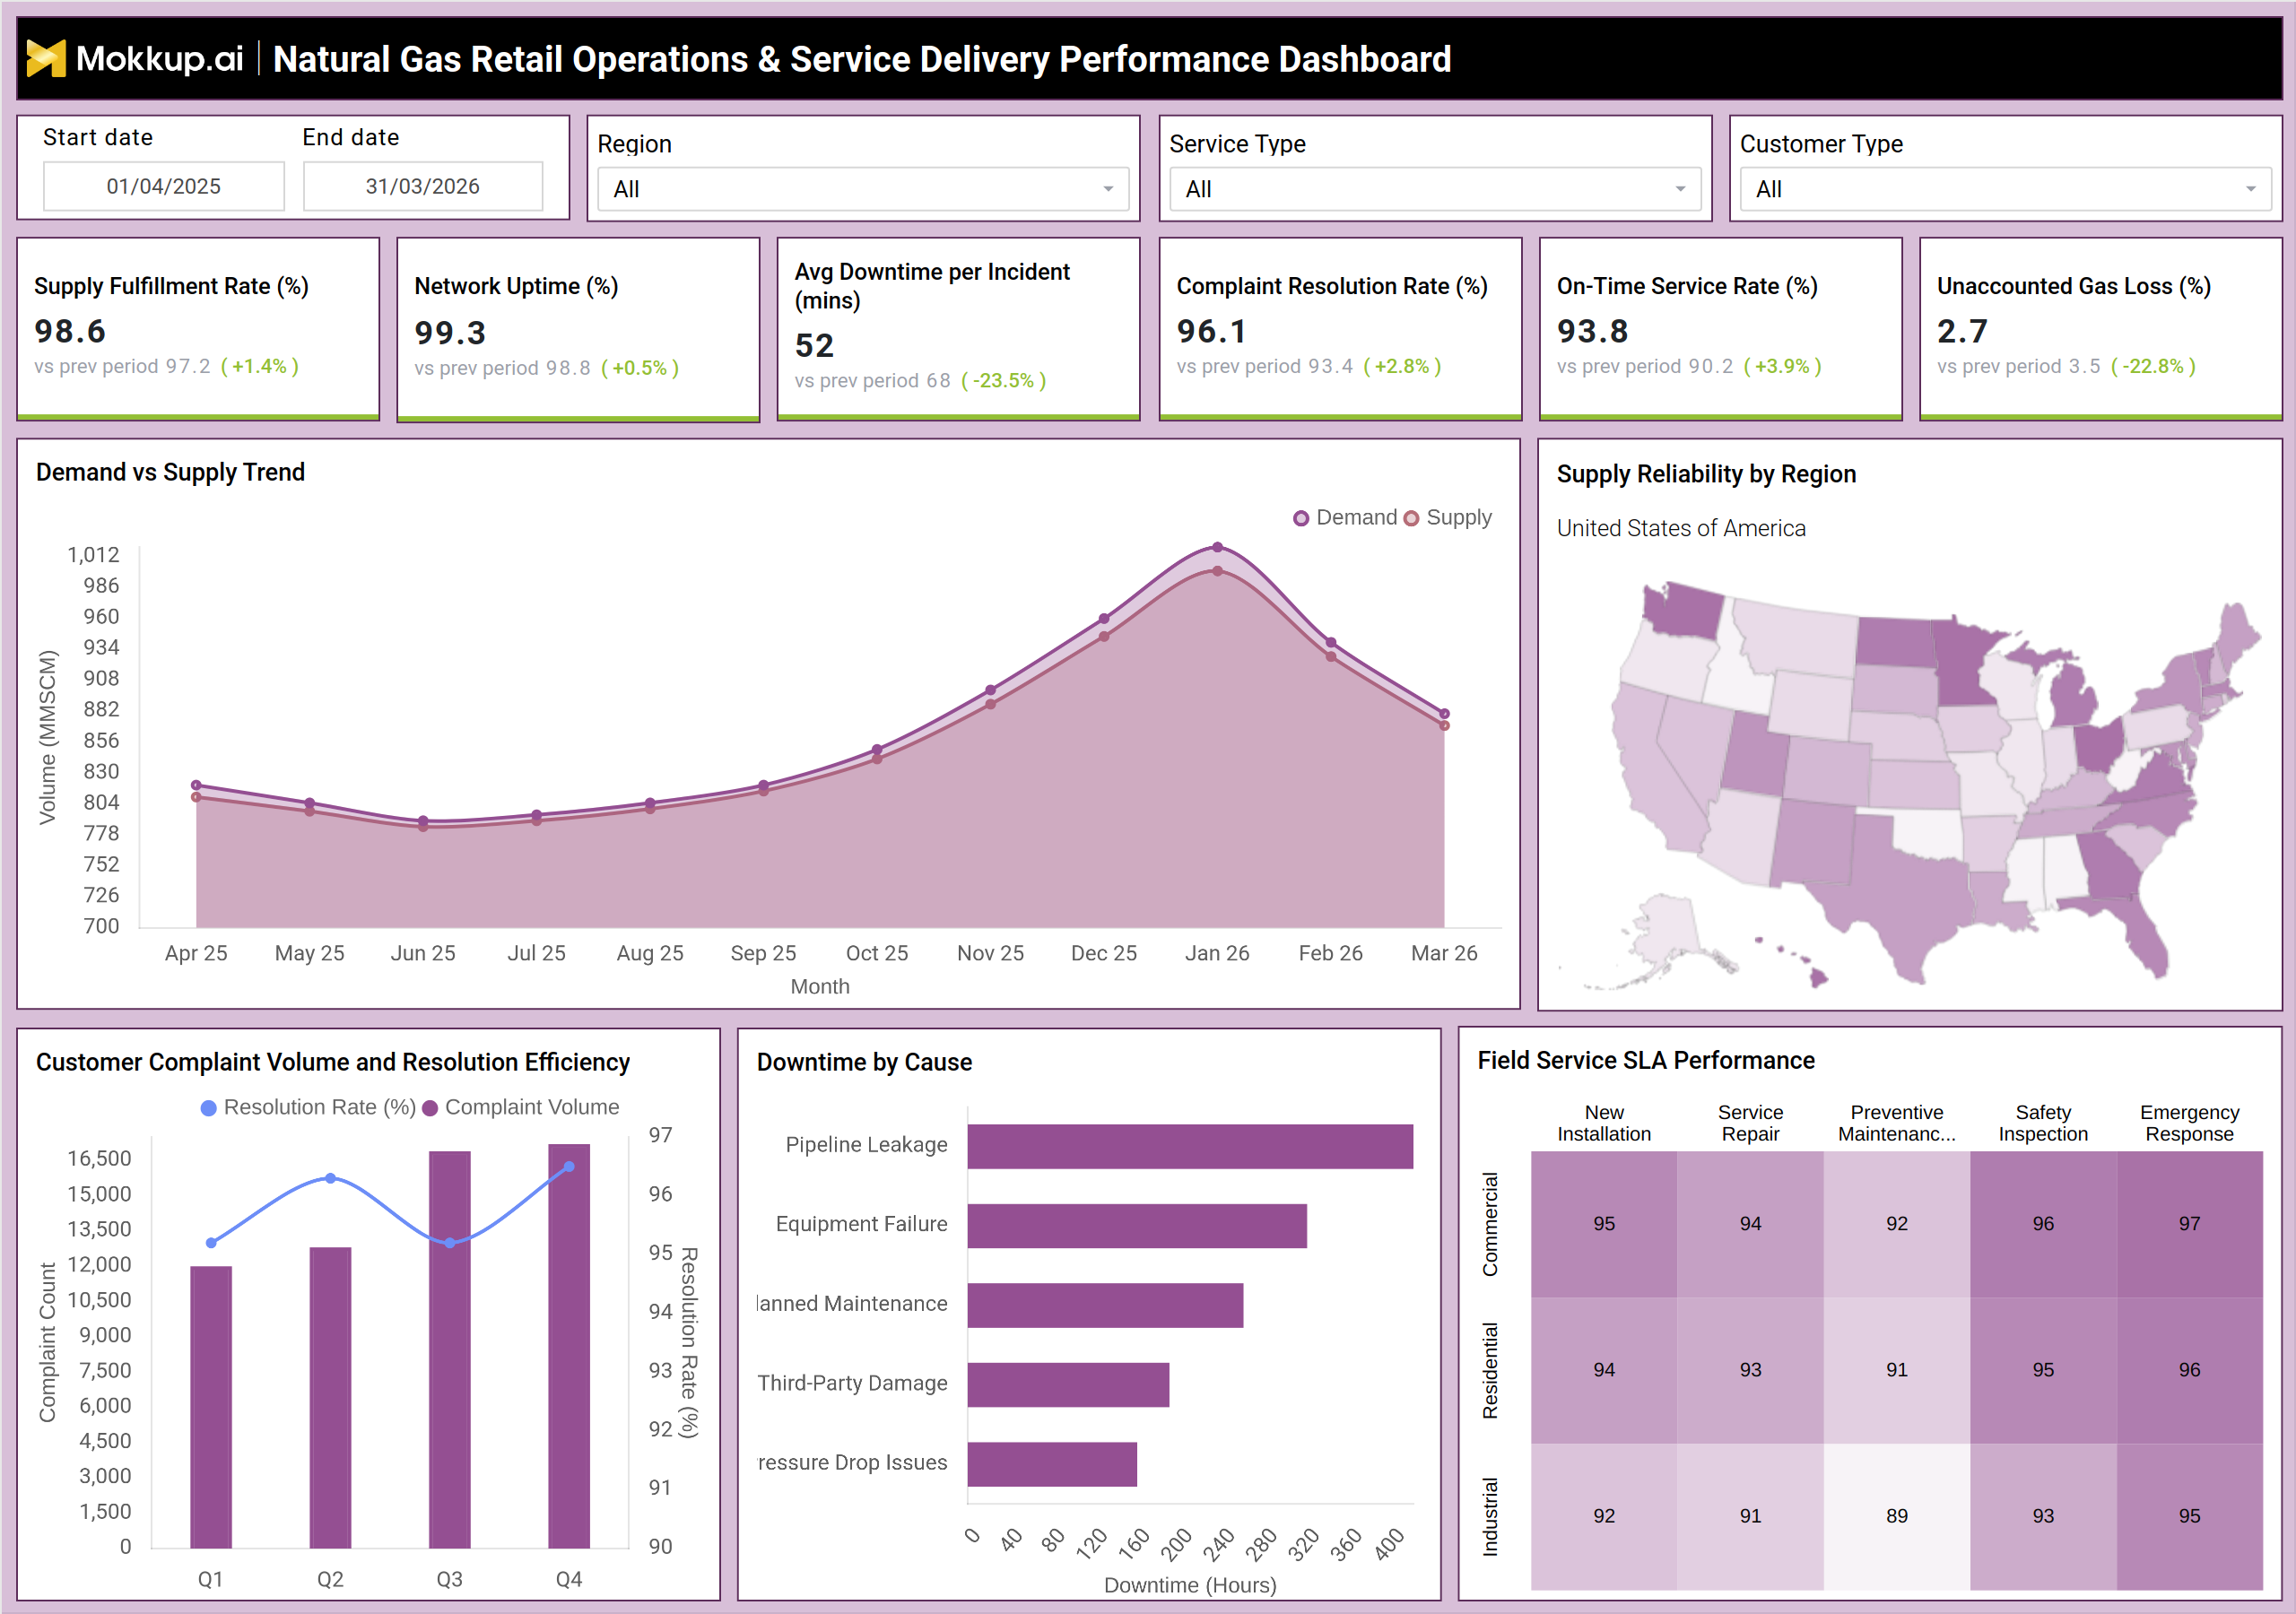
A typical natural gas customer service performance dashboard provides a comprehensive view of retail operations performance. For example, the dashboard displays KPIs such as supply fulfillment rate, network uptime, average downtime per incident, complaint resolution rate, on-time service rate, and unaccounted gas loss. Users can filter data by region, service type, and customer segment to analyze performance at a detailed level. A demand vs supply trend visual shows how well supply aligns with customer demand over time, helping identify imbalances. Regional supply reliability maps highlight areas with service inconsistencies.
Customer complaint volume and resolution efficiency charts provide insights into customer service performance and operational responsiveness. Downtime by cause analysis identifies key issues such as pipeline leakage, equipment failure, planned maintenance, and third-party damage. Additionally, field service SLA performance metrics track service delivery efficiency across activities such as installation, repair, and inspections. This gas retail operations monitoring dashboard enables utilities to maintain service reliability while improving customer satisfaction and operational efficiency.
How to Analyze Data in Natural Gas Retail Operations & Service Delivery Performance Dashboard
Here is how you can analyze data from this dashboard:
- Compare supply fulfillment rate with demand trends to identify supply gaps
- Track network uptime to assess system reliability across regions
- Analyze average downtime per incident to evaluate operational efficiency
- Review complaint resolution rate to measure customer service effectiveness
- Compare on-time service rate across service types to identify delays
- Monitor unaccounted gas loss to detect inefficiencies or leakage issues
- Analyze demand vs supply trends to ensure balance and forecasting accuracy
- Identify regions with lower supply reliability for targeted improvements
- Evaluate complaint volume trends alongside resolution efficiency
- Analyze downtime causes to prioritize maintenance and risk mitigation
Benefits of Natural Gas Retail Operations & Service Delivery Performance Dashboard
The following are the benefits of using this dashboard:
- Provides visibility into retail operations and service performance
- Improves customer satisfaction through better service monitoring
- Enables faster issue resolution with detailed complaint tracking
- Enhances operational efficiency by identifying downtime causes
- Supports demand-supply balancing for reliable service delivery
- Reduces gas losses through continuous monitoring and analysis
- Improves SLA compliance across field service operations
- Enables data-driven decision-making across retail operations teams
- Enhances regional performance tracking and benchmarking
- Strengthens overall service reliability and operational control
KPIs to Track in Natural Gas Retail Operations & Service Delivery Performance Dashboard
The following key KPIs can be tracked by using this dashboard:
- Supply Fulfillment Rate (%) – Measures how effectively gas demand is met across customer segments
- Network Uptime (%) – Indicates the availability and reliability of the gas distribution network
- Average Downtime per Incident (mins) – Tracks the average duration of service disruptions
- Complaint Resolution Rate (%) – Measures the percentage of customer complaints resolved successfully
- On-Time Service Rate (%) – Indicates how often service requests are completed within defined timelines
- Unaccounted Gas Loss (%) – Tracks losses due to leakage, theft, or inefficiencies in the system
- Demand vs Supply Trend – Monitors alignment between gas demand and supply over time
- Supply Reliability by Region – Identifies regional variations in service reliability
- Customer Complaint Volume – Tracks the number of complaints received across periods
- Downtime by Cause – Highlights key contributors to service interruptions
- Field Service SLA Performance (%) – Measures service efficiency across installation, repair, and maintenance activities
Frequently Asked Questions
1. Why is a natural gas retail operations dashboard important?
It provides a complete view of service delivery performance, helping utilities maintain reliability and improve customer experience.
2. How does a gas retail service delivery dashboard improve operations?
It identifies inefficiencies in service delivery, downtime causes, and customer service gaps, enabling corrective actions.
3. What insights does a natural gas service delivery analytics dashboard provide?
It offers insights into demand-supply balance, complaint trends, SLA performance, and operational reliability.