
What is a Natural Gas Retail Digital Innovation Dashboard?
A Natural Gas Retail Digital Innovation Dashboard template is a strategic visualization platform designed to monitor, analyze, and optimize digital transformation initiatives and innovation projects within natural gas retail operations. It consolidates critical retail innovation metrics, including pilot projects, billing error reduction, innovation ROI, cost savings, average pilot duration, and automated billing rate into a unified, forward-looking interface.
By integrating gas retail digital innovation tracking, customer experience technology monitoring, billing automation analytics, and innovation portfolio management, this dashboard enables retail innovation directors, digital transformation leads, customer experience managers, and utility leadership to measure return on innovation investments, accelerate deployment of customer-facing technologies, reduce operational costs, enhance billing accuracy, and drive competitive differentiation in the retail gas market. It serves as a central command center for cultivating a culture of retail innovation and demonstrating tangible value from digital investments.
How to Create a Natural Gas Retail Digital Innovation Dashboard
You don’t need to build your report from scratch, just start with a ready-to-use Natural Gas Retail Digital Innovation dashboard template from Mokkup. Add in your data and export it however you like. Here’s how to do it:
1. Create or Log in to Your Mokkup Account
Start by signing up on Mokkup.ai using your email. If you already have an account, just log in, and you’ll be good to go.
2. Choose and Customize Your Dashboard Template
Find the Natural Gas Retail Digital Innovation Dashboard template in the Templates section. Use the drag-and-drop editor to adjust KPIs, edit filters, or add elements based on your data.
3. Export to Your BI Tool
Once your dashboard wireframe is ready, use the BI Tool Export feature to send it directly to Power BI or Tableau for further analysis and enhancements. You can also download the dashboard as a PDF, PNG, or JPEG, embed it on a platform, or invite your team to collaborate.
Note: This is a Pro template. You’ll need a Pro subscription on Mokkup to use and customize this dashboard wireframe. Upgrade anytime to unlock full access.
Natural Gas Retail Digital Innovation Dashboard Example
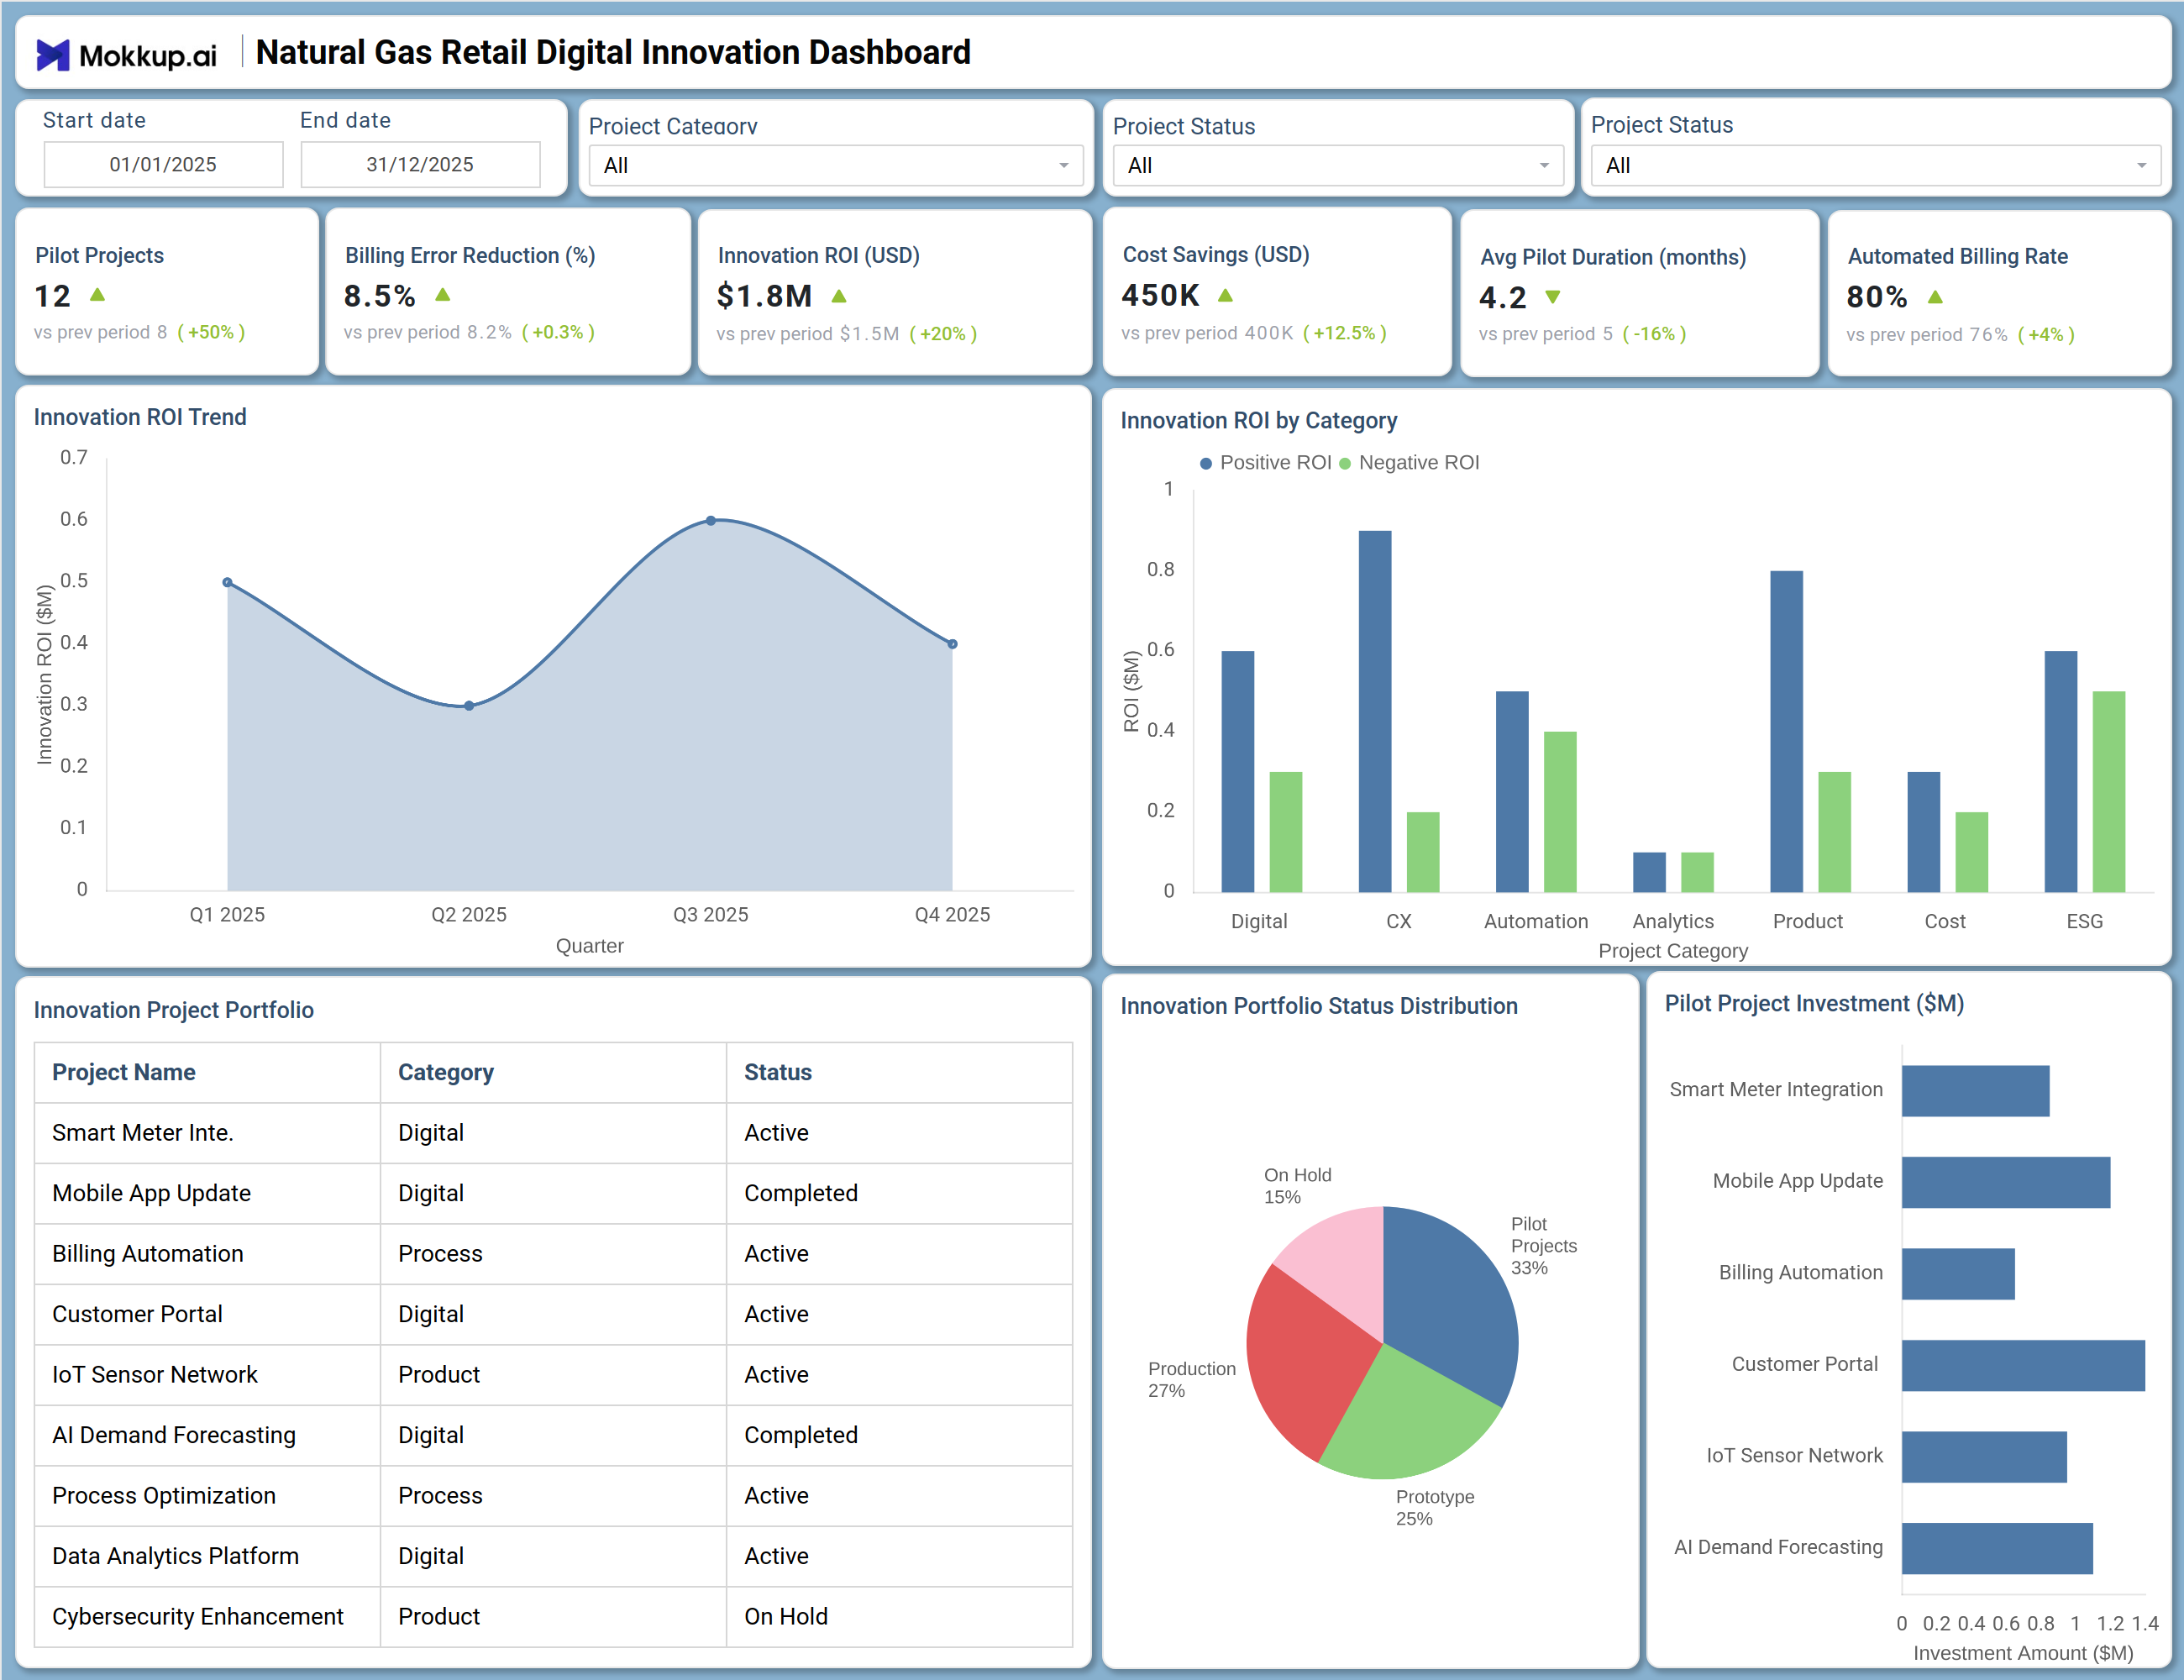
This dashboard delivers a comprehensive view of digital innovation performance and technology deployment across natural gas retail operations. The Overview screen prominently displays six critical retail innovation KPIs: Pilot Projects at 12 (50% increase from prior period), Billing Error Reduction at 8.5% (0.3 percentage point improvement), Innovation ROI at $1.8M (20% growth), Cost Savings at $450K (12.5% increase), Average Pilot Duration reduced to 4.2 months (16% faster), and Automated Billing Rate at 80% (4 percentage point gain).
The Innovation ROI Trend chart tracks quarterly return on innovation investment across Q1 through Q4 2025, revealing patterns and validating the financial impact of digital initiatives. Innovation ROI by Category provides a detailed breakdown of positive versus negative ROI across project categories, including Digital, Customer Experience (CX), Automation, Analytics, Product, Cost Optimization, and ESG, enabling strategic reallocation of resources to highest performing areas. The Innovation Project Portfolio table lists active and completed initiatives, including Smart Meter Integration, Mobile App Enhancement, Billing Automation, Customer Portal, IoT Sensor Network, AI Demand Forecasting, Process Optimization, Data Analytics Platform, and Cybersecurity Enhancement—with status indicators for each.
Innovation Portfolio Status Distribution pie chart shows the breakdown of projects by status: Production (27%), Prototype (25%), On Hold (15%), with the remaining distribution across Digital, CX, Automation, Analytics, Product, Cost Optimization, and ESG categories. Together, these components enable gas retail digital innovation tracking, innovation portfolio management, and data-driven technology investment decisions for customer-facing operations.
How to Analyze Data in a Natural Gas Retail Digital Innovation Dashboard
Here is how you can analyze data from this dashboard:
- Innovation Pipeline Tracking: Monitor Pilot Projects (count) to assess the strength of the innovation pipeline and project flow.
- Billing Accuracy Impact: Track Billing Error Reduction (%) to measure improvements in billing automation and customer experience.
- ROI Performance Evaluation: Review Innovation ROI ($) to validate financial returns from digital initiatives.
- Cost Efficiency Analysis: Analyze Cost Savings ($) to quantify operational improvements from automation projects.
- Project Execution Speed: Examine Average Pilot Duration (months) to identify delays and improve time to market.
- Automation Progress Monitoring: Evaluate Automated Billing Rate (%) to track adoption of fully automated processes.
- Category Level ROI Analysis: Drill into Innovation ROI by Category to identify high performing investment areas.
- ROI Trend Monitoring: Use Innovation ROI Trend to correlate performance with project rollouts or market conditions.
- Project Portfolio Tracking: Review the Innovation Project Portfolio table to monitor progress and flag delayed initiatives.
- Portfolio Balance Assessment: Analyze Innovation Portfolio Status Distribution to maintain a healthy mix of active, prototype, and on hold projects.
Benefits of a Natural Gas Retail Digital Innovation Dashboard
The following are the benefits of using this dashboard:
- Centralized Innovation Visibility: Provides a real time view of digital transformation and innovation performance.
- Data Driven Investment Decisions: Enables better funding decisions using ROI and cost savings insights.
- Faster Time to Market: Accelerates deployment of new technologies through pilot tracking and execution monitoring.
- Financial Value Demonstration: Clearly shows returns from innovation initiatives to stakeholders.
- Improved Customer Experience: Reduces billing errors and enhances digital service quality.
- Optimized Resource Allocation: Focuses investments on high ROI innovation categories.
- Competitive Advantage: Supports faster adoption of digital capabilities in retail gas markets.
- Innovation Culture Enablement: Promotes transparency and engagement across the innovation portfolio.
KPIs to Track in a Natural Gas Retail Digital Innovation Dashboard
The following key KPIs can be tracked by using this dashboard:
- Pilot Projects (count): Number of active or planned retail innovation pilot projects.
- Billing Error Reduction (%): Percentage reduction in billing errors attributable to automation and accuracy initiatives.
- Innovation ROI ($): Financial return on innovation investments (savings + revenue impact ÷ investment).
- Cost Savings ($): Quantified operational cost reductions from innovation projects.
- Average Pilot Duration (months): Mean time from project start to completion or production deployment.
- Automated Billing Rate (%): Percentage of billing transactions processed automatically without manual intervention.
- Innovation ROI by Category: Breakdown of ROI across Digital, CX, Automation, Analytics, Product, Cost Opti., and ESG categories.
- Project Portfolio Status: Distribution of projects by status (Active, Completed, On Hold, Planned).
- Innovation Portfolio by Category: Percentage breakdown of projects across innovation categories.
- Time to Value (months): Average time from project initiation to realized financial benefit.
Frequently Asked Questions
Q1. What is the purpose of this Natural Gas Retail Digital Innovation Dashboard?
This dashboard provides a centralized view of digital innovation activities, pilot projects, and financial returns across natural gas retail operations. It helps innovation leaders track progress, measure ROI, optimize resource allocation, and communicate the value of technology investments to stakeholders.
Q2. How does this dashboard measure innovation ROI?
Innovation ROI is calculated by tracking both the investment in innovation projects and the resulting financial benefits including cost savings, billing error reduction, and revenue enhancements. The Innovation ROI by Category view provides granular visibility into which types of projects deliver the highest returns.
Q3. What types of retail innovation projects can be tracked?
The dashboard can track a wide range of retail innovation initiatives including Smart Meter Integration, Mobile App Enhancements, Billing Automation, Customer Portals, IoT Sensor Networks, AI Demand Forecasting, Process Optimization, Data Analytics Platforms, Cybersecurity Enhancements, and other digital customer experience technologies.
Q4. Who typically uses this dashboard?
Retail innovation directors, digital transformation leads, customer experience managers, product development teams, marketing technology leaders, and utility retail executives use this dashboard to oversee innovation portfolios, allocate resources, and drive customer-facing technology advancement.
Q5. How does this dashboard support customer experience improvement?
By tracking projects in Customer Experience (CX) category and measuring their impact on billing accuracy and automation, the dashboard provides visibility into initiatives that directly enhance the customer journey, reduce friction, and improve satisfaction with retail gas services.