What is a Coal Power Plant B2B Sales & Customer Dashboard?
A Coal Power Plant B2B Sales & Customer Dashboard is a centralized analytics system used by electric power utilities to monitor sales performance, revenue trends, customer contracts, and engagement patterns across industrial and commercial buyers. It consolidates financial, operational, and customer-facing metrics into a structured interface that supports timely commercial decisions.
This dashboard serves as a B2B sales performance dashboard for coal power plants, enabling commercial teams to track contract utilization, tariff performance, energy delivery reliability, and causes of interruptions. It also works as a coal power generation customer analytics platform, enabling utilities to analyze consumption behavior, overdue aging trends, customer issues, payment cycles, and renewal risks. By integrating these insights, coal utilities gain a comprehensive sales and customer insights dashboard for coal power utilities, which improves demand forecasting, strengthens customer relationships, and supports data-driven revenue planning.
How to Create a Coal Power Plant B2B Sales & Customer Dashboard
You don’t need to build your report from scratch—just start with a ready-to-use dashboard template from Mokkup. Add in your data and export it however you like. Here’s how to do it:
1. Create or Log in to Your Mokkup Account
Start by signing up on Mokkup.ai using your email. If you already have an account, just log in, and you’ll be good to go.
2. Choose and Customize Your Dashboard Template
Find the Coal Power Plant B2B Sales & Customer Dashboard template in the Templates section. Use the drag-and-drop editor to adjust KPIs, edit filters, or add elements based on your data.
3. Export to Your BI Tool
Once your dashboard wireframe is ready, use the BI Tool Export feature to send it directly to Power BI or Tableau for further analysis and enhancements. You can also download the dashboard as a PDF, PNG, or JPEG, embed it on a platform, or invite your team to collaborate.
Note: This is a Pro template. You’ll need a Pro subscription on Mokkup to use and customize this dashboard wireframe. Upgrade anytime to unlock full access.
Coal Power Plant B2B Sales & Customer Dashboard Example
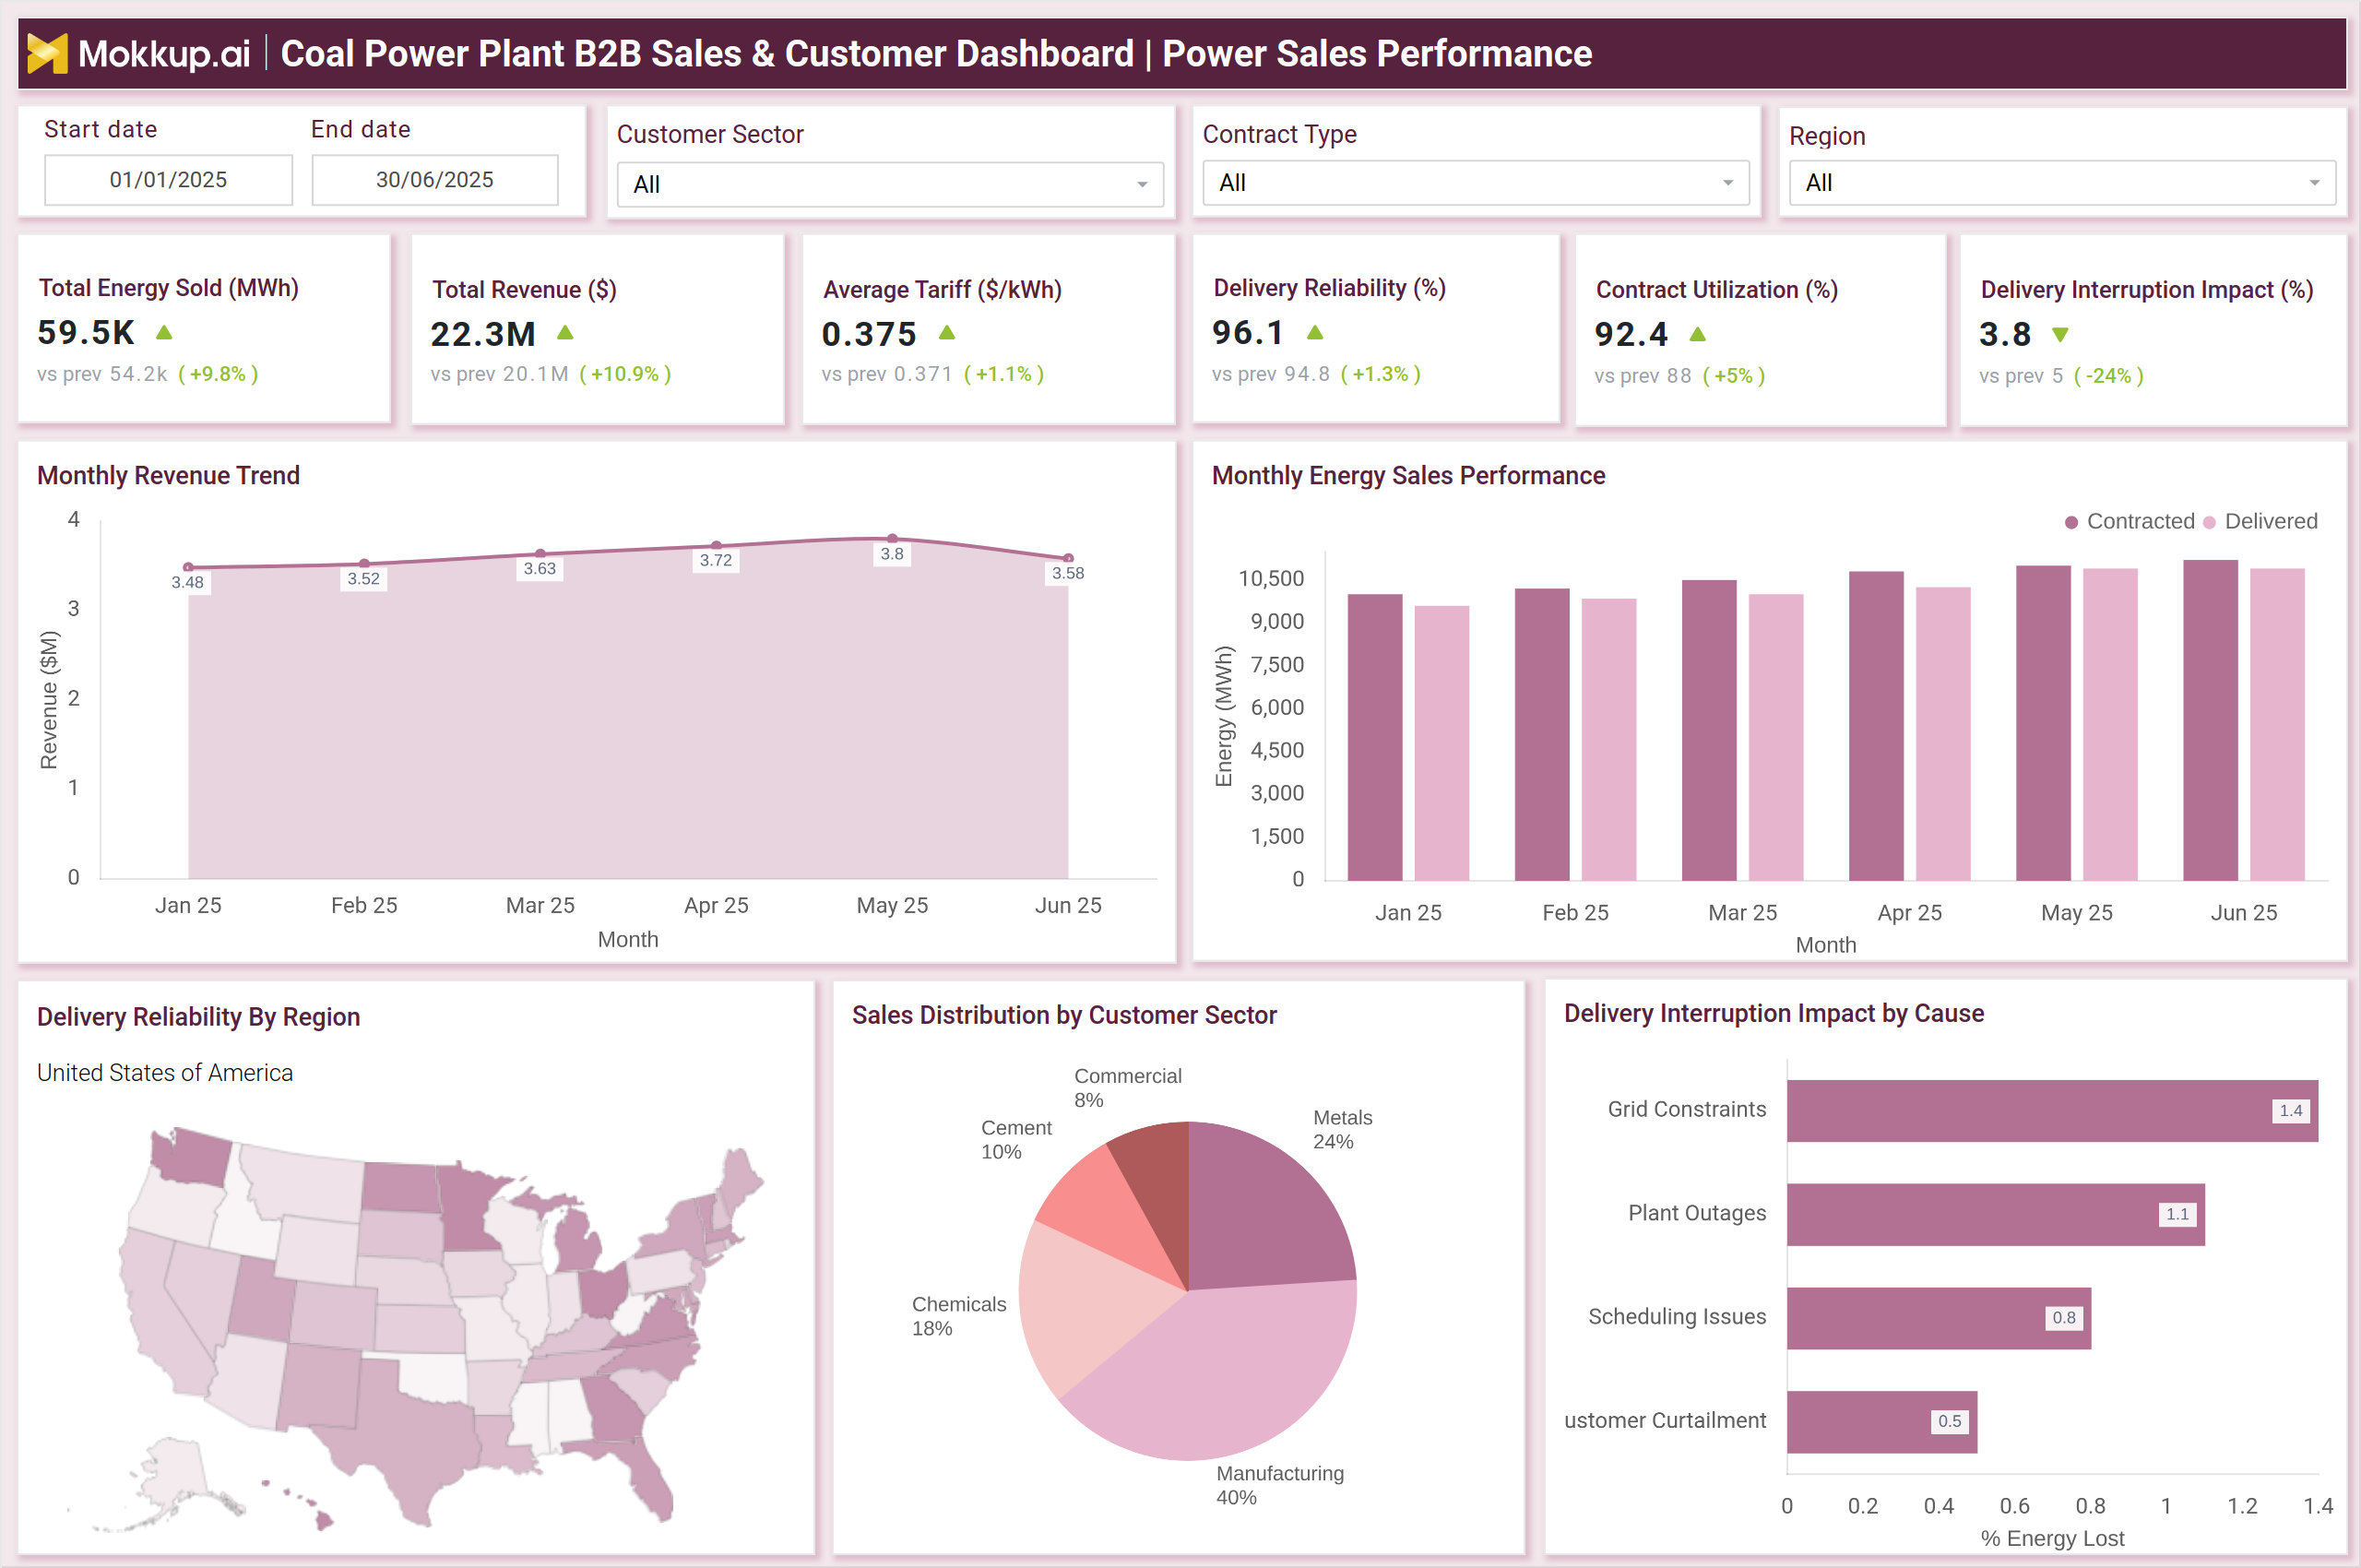
A typical example of this dashboard is built around two core areas: Power Sales Performance and Customer Commercial Health. The Sales Performance view highlights key metrics, including total energy sold, total revenue, tariff trends, delivery reliability, and contract utilization. Supporting visuals, such as monthly revenue trends, monthly sales performance, regional delivery reliability, customer sector distribution, and causes of delivery interruptions, help the commercial team understand where sales performance is gaining or losing momentum.
On the customer side, the dashboard serves as a customer acquisition analysis tool for coal utilities, providing a detailed view of portfolio health, collection efficiency, renewal risks, and satisfaction scores. It displays energy engagement patterns by comparing contracted versus actual usage, provides overdue aging heatmaps, shows top customer issues, and tracks issue resolution performance. It also operates as a coal-based power plant revenue and sales monitoring tool, providing actionable insights for contract renewal. This helps utilities focus on high-value accounts, assess dependency levels, and prioritize accounts that are at a higher risk of churn.
How to Analyze Data in a Coal Power Plant B2B Sales & Customer Dashboard
Here is how you can analyze data from the coal power plant B2B sales performance dashboard:
- Begin with high-level KPIs, such as energy sold, revenue, average tariff, and delivery reliability, to gain an understanding of overall commercial performance.
- Compare contracted vs. delivered energy to identify fulfillment gaps or operational constraints.
- Review monthly revenue and energy performance trends for seasonality, growth momentum, or drop-off periods.
- Analyze customer sector distribution to determine which industries drive the largest share of demand.
- Assess delivery interruption causes to identify avoidable operational issues impacting revenue and reliability.
- Study overdue aging patterns to evaluate credit risks and payment delays across customer segments.
- Track customer issue resolution performance to measure service responsiveness and identify recurring complaints.
- Monitor contract utilization and renewal risk scores to plan proactive engagement and reduce churn.
- Utilize regional reliability maps to identify geographic delivery challenges that impact customer satisfaction.
- Review load dependency index and remaining contract tenure to prioritize long-term, high-value client relationships.
Benefits of Coal Power Plant B2B Sales & Customer Dashboard
The following are the benefits of using this coal power utilities sales and customer insights dashboard:
- Improves revenue visibility by consolidating sales, tariffs, and energy delivery metrics into one interface.
- Enhances customer insights through tracking of engagement, consumption, payment behavior, and issue patterns.
- Supports operational efficiency by pinpointing causes of energy delivery interruptions and fulfillment gaps.
- Strengthens account management with renewal forecasting, risk scoring, and dependency analysis.
- Reduces credit risk through detailed overdue aging and collection performance monitoring.
- Helps forecast demand using historical sales trends, contracted load patterns, and seasonal usage variations.
- Improves decision-making by integrating sales performance and customer health into a unified analytics view.
- Enhances service quality by providing transparent tracking of issue resolution rates and customer satisfaction scores.
- Drives strategic pricing decisions by analyzing tariff trends and customer profitability.
- Enables targeted engagement for high-value customers based on contract value and dependency metrics.
KPIs to Track in a Coal Power Plant B2B Sales & Customer Dashboard
The following key KPIs can be tracked by using this dashboard:
- Total Energy Sold (MWh) – Measures volume of contracted and delivered energy to B2B customers.
- Total Revenue ($) – Tracks revenue generated from industrial and commercial clients.
- Average Tariff ($/kWh) – Indicates pricing performance and tariff competitiveness.
- Delivery Reliability (%) – Shows how consistently the utility meets contracted demand.
- Contract Utilization (%) – Measures how much of the contracted load customers are actually using.
- Delivery Interruption Impact (%) – Quantifies revenue loss due to outages, curtailment, or grid issues.
- Customer Portfolio Health Score – Overall indicator of customer financial performance and engagement stability.
- Collection Rate (%) – Measures billing efficiency and customer payment compliance.
- Renewal Risk Score – Predicts the likelihood of customer contract continuation or termination.
- Average Payment Time (days) – Indicates payment discipline and potential credit issues.
- Issue Resolution Rate (%) – Tracks how effectively customer complaints are addressed.
- Customer Satisfaction Score – Measures service quality and relationship health.
- Overdue Aging Pattern – Highlights overdue invoices across aging brackets.
- Contract Renewal Outlook Metrics – Remaining tenure, contract value, load dependency, and renewal probability.
Frequently Asked Questions
1. Who uses a Coal Power Plant B2B Sales & Customer Dashboard?
Commercial teams, key account managers, revenue analysts, operations teams, and executive leadership.
2. How does this dashboard support a B2B sales strategy?
It provides visibility into sales trends, customer behavior, and contract performance, enabling informed decisions on pricing, forecasting, and customer management.
3. Can this dashboard identify at-risk customers?
Yes. Renewal risk scores, issue patterns, overdue aging, and consumption deviations help identify customers likely to churn.