What is a Natural Gas Retail CRM & Digital Channel Dashboard?
The Natural Gas Retail CRM & Digital Channel Dashboard is a purpose-built analytics template designed for natural gas retail providers who need a clear, consolidated view of customer engagement, channel performance, and operational reliability. This natural gas retail CRM dashboard brings together critical service metrics — from billing system uptime and dispute resolution timelines to mobile app activity — so CRM managers, digital operations teams, and customer service leads can monitor performance without switching between systems. It tracks how customers interact across self-service and assisted channels, measures how efficiently issues are resolved on first contact using the CRM first-contact resolution rate dashboard view, and flags security incidents that could affect platform trust. By centralizing these data points, the dashboard gives retail energy teams the visibility they need to improve customer retention, reduce operational friction, and maintain compliance with service standards.
How to Create a Natural Gas Retail CRM & Digital Channel Dashboard
You don't need to build your report from scratch, just start with a ready-to-use dashboard template from Mokkup. Add in your data and export it however you like. Here's how to do it:
1. Create or Log in to Your Mokkup Account
Start by signing up on Mokkup.ai using your email. If you already have an account, just log in, and you'll be good to go.
2. Choose and Customize Your Dashboard Template
Find the Natural Gas Retail CRM & Digital Channel Dashboard template in the Templates section. Use the drag-and-drop editor to adjust KPIs, edit filters, or add elements based on your data.
3. Export to Your BI Tool
Once your dashboard wireframe is ready, use the BI Tool Export feature to send it directly to Power BI or Tableau for further analysis and enhancements. You can also download the dashboard as a PDF, PNG, or JPEG, embed it on a platform, or invite your team to collaborate.
Note: This is a Pro template. You'll need a Pro subscription on Mokkup to use and customize this dashboard wireframe. Upgrade anytime to unlock full access.
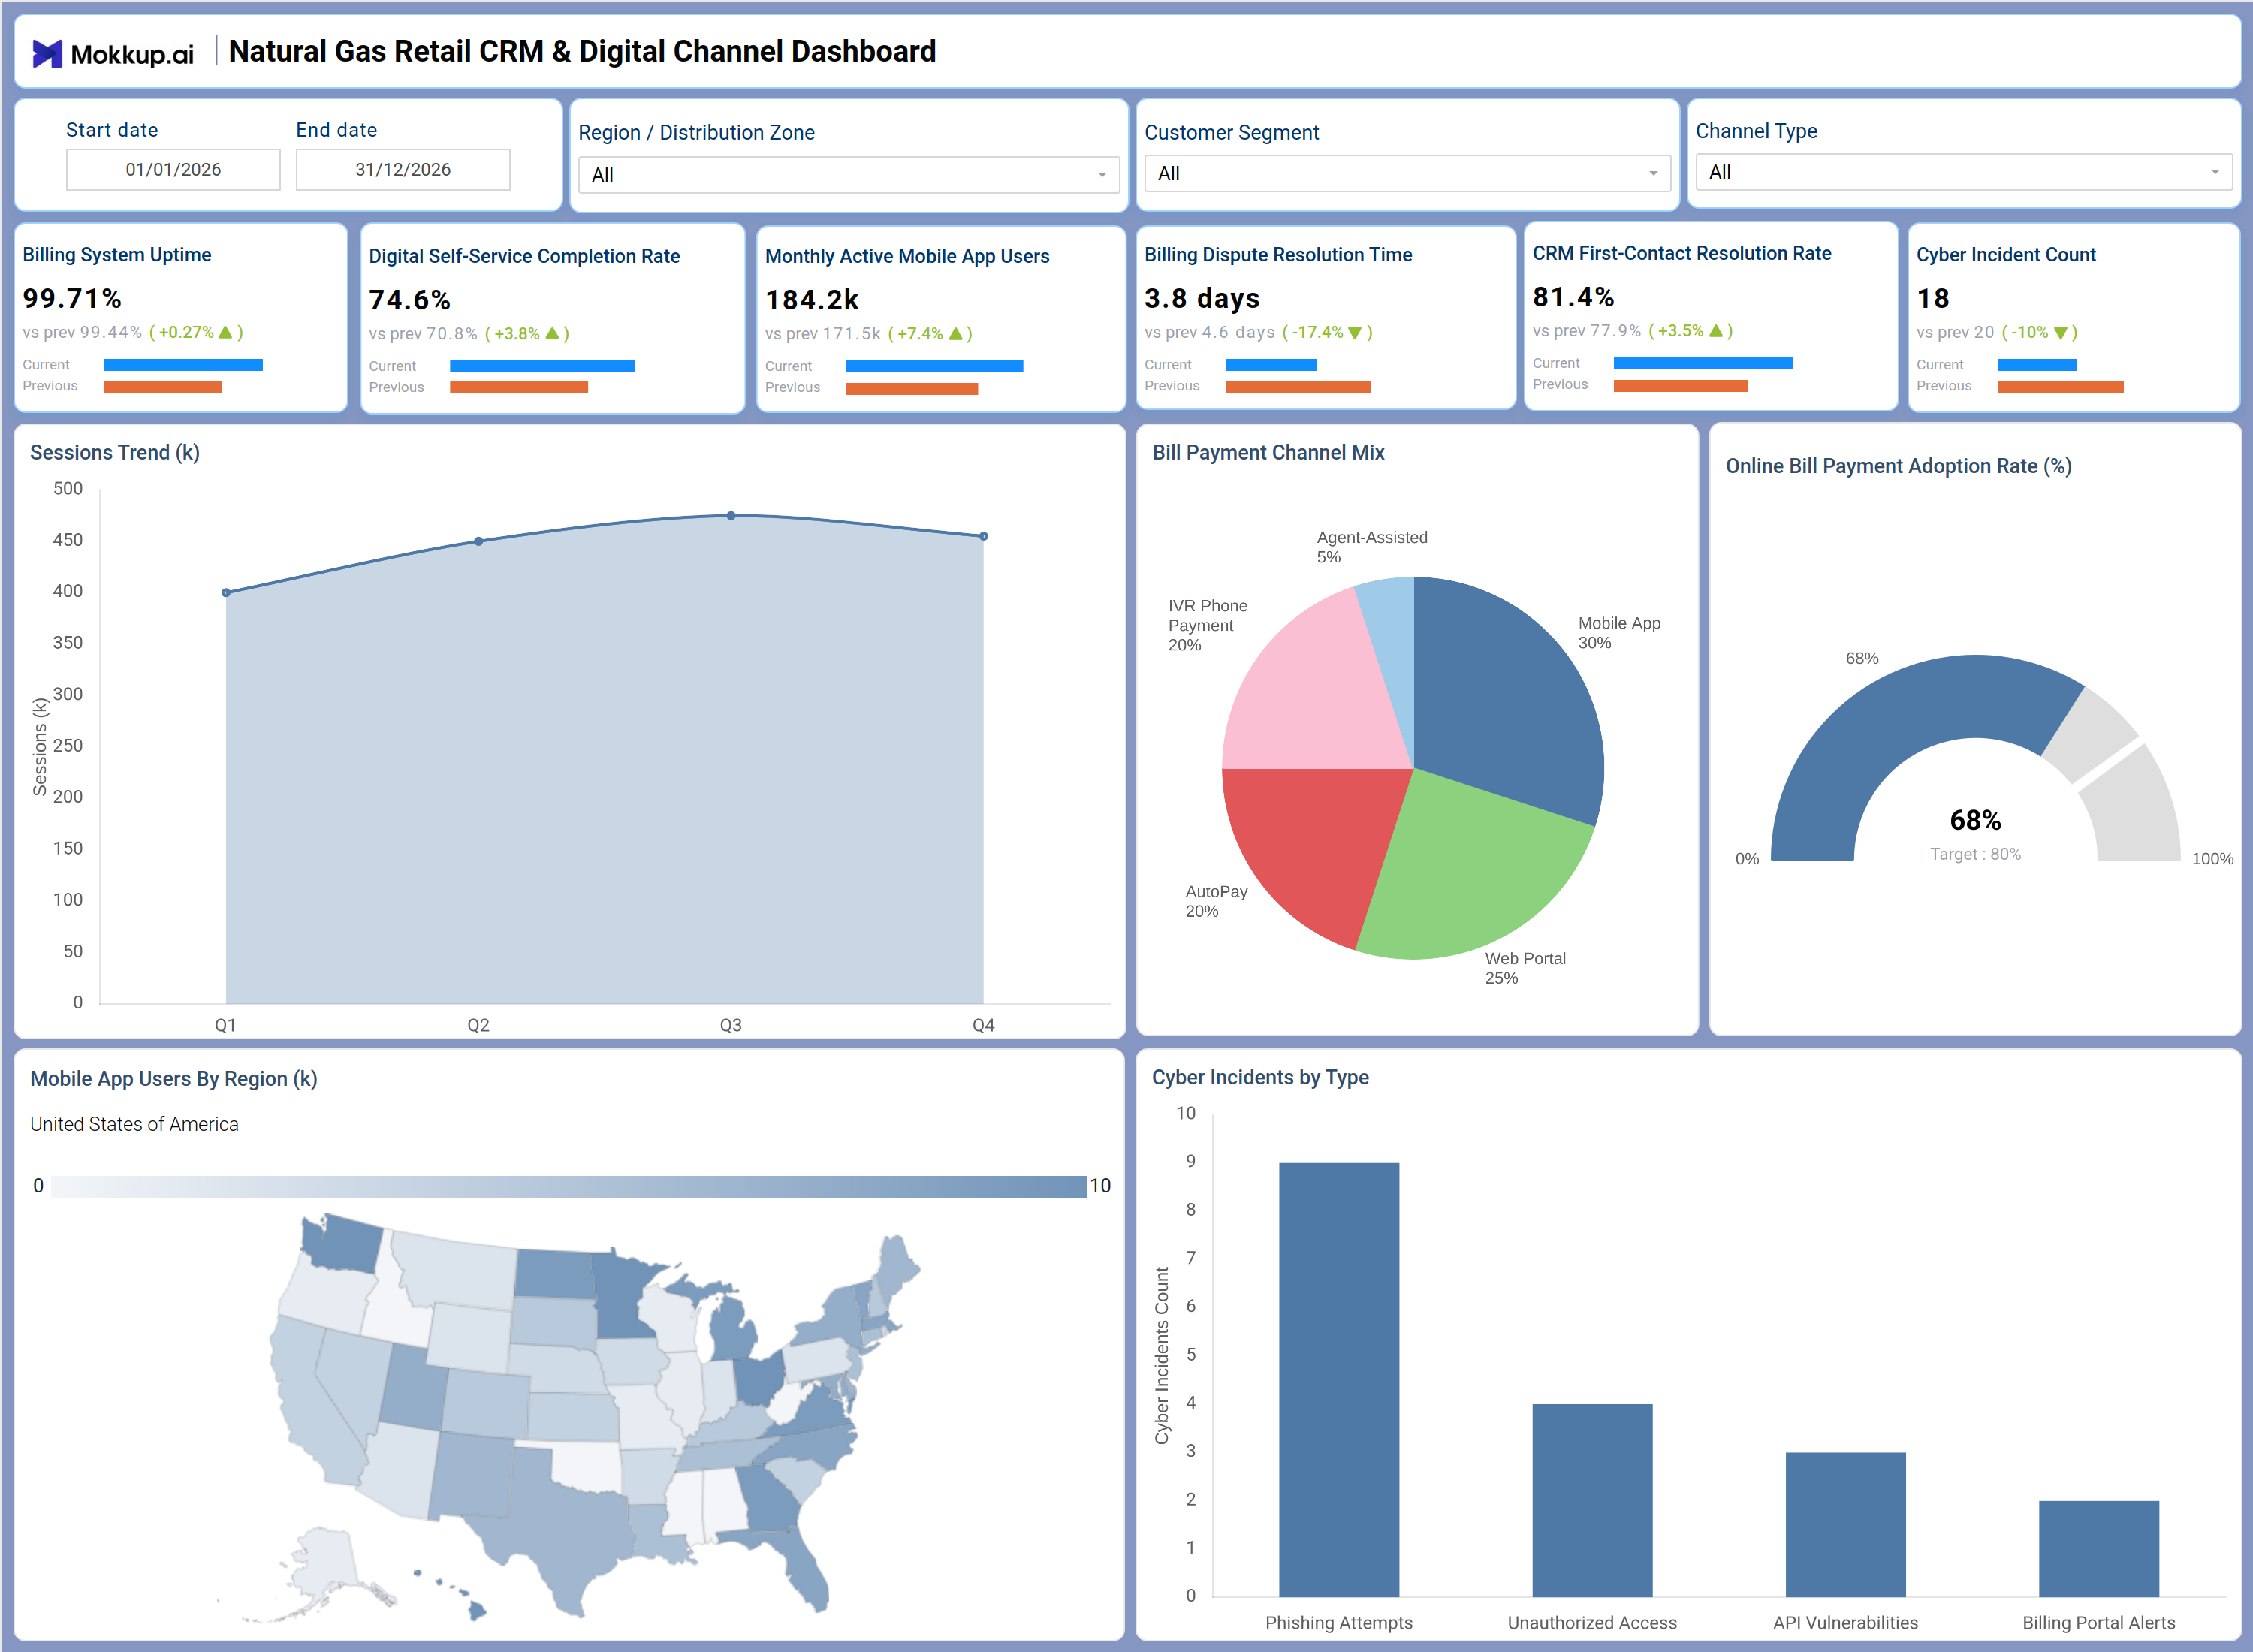
Natural Gas Retail CRM & Digital Channel Dashboard Example
A digital operations manager at a natural gas retail company opens this dashboard to assess whether customer-facing channels are performing within acceptable service thresholds for the current reporting period. By applying filters for Region / Distribution Zone, Customer Segment, and Channel Type, teams can quickly narrow performance data to the exact context they need. With the Sessions Trend chart, planners can identify whether digital engagement is growing or declining across quarters and use that signal to decide whether to scale self-service investments or reallocate support resources. The digital self-service completion rate tracking view gives CRM leaders a direct measure of how effectively customers are finishing transactions without agent assistance.
The bill payment channel mix analysis section helps product and operations teams understand how customers are choosing to pay — whether through the mobile app, web portal, AutoPay, IVR, or agent-assisted channels — and where adoption lags relative to targets. The Online Bill Payment Adoption Rate gauge provides a single, at-a-glance comparison against the 80% target. Mobile app adoption in natural gas retail is mapped geographically, showing regional managers where engagement is strong and where outreach efforts are needed. The Cyber Incidents by Type bar chart supports security and compliance teams in managing cyber incident tracking for energy retail, covering phishing attempts, unauthorized access, and API vulnerabilities, enabling prioritized responses by severity. Across all sections, this dashboard equips CRM, digital, and operations leaders to act on data rather than assumptions.
How to Analyze Data in a Natural Gas Retail CRM & Digital Channel Dashboard
Here is how you can analyze data from this dashboard:
- Use the Region / Distribution Zone filter to compare CRM and channel performance across different service territories.
- Apply the Customer Segment filter to isolate how different customer groups interact with self-service vs. agent-assisted channels.
- Monitor the Sessions Trend chart quarterly to detect drops in digital engagement and respond before churn increases.
- Track the digital self-service completion rate tracking metric to assess whether customers are successfully finishing tasks without escalation.
- Review the Bill Payment Channel Mix donut chart to conduct bill payment channel mix analysis and understand payment behavior shifts.
- Use the Online Bill Payment Adoption Rate gauge to measure progress against the 80% target and guide digital migration planning.
- Analyze the mobile app users by region map to identify geographies with low mobile app adoption in natural gas retail and plan targeted campaigns.
- Monitor the Cyber Incidents by Type bar chart to prioritize response actions based on incident frequency and category.
Benefits of a Natural Gas Retail CRM & Digital Channel Dashboard
The following are the benefits of using this dashboard:
- Centralizes CRM, digital channel, and security metrics for natural gas retail operations in a single structured template.
- Supports digital self-service completion rate tracking alongside billing and CRM KPIs without requiring separate tools.
- Reduces manual data aggregation for monthly or quarterly reviews with pre-built KPI tiles and chart layouts.
- Enables region-level analysis of mobile app adoption in natural gas retail to guide infrastructure and outreach decisions.
- Provides a clear bill payment channel mix analysis view to support payment channel strategy and AutoPay adoption campaigns.
- Gives CRM managers and digital operations leads a shared, consistent view of customer engagement performance.
- Helps security teams monitor cyber incident tracking for energy retail environments alongside operational KPIs in one view.
KPIs to Track in a Natural Gas Retail CRM & Digital Channel Dashboard
The following key KPIs can be tracked by using this dashboard:
- Billing System Uptime (%): Measures the percentage of time the billing platform is operational — essential for maintaining customer trust and uninterrupted service access in natural gas retail CRM dashboard reporting.
- Digital Self-Service Completion Rate (%): Tracks the share of customer interactions completed through self-service channels without agent involvement — core to digital self-service completion rate tracking and reducing support costs.
- Monthly Active Mobile App Users (k): Counts the number of unique customers using the mobile app each month — a key indicator of mobile app adoption in natural gas retail and digital engagement health.
- Billing Dispute Resolution Time (days): Measures the average number of days taken to resolve billing disputes — directly tied to customer satisfaction and retention.
- CRM First-Contact Resolution Rate (%): Tracks the percentage of customer issues resolved on the first contact — central to the CRM first-contact resolution rate dashboard view and a primary measure of service efficiency.
- Cyber Incident Count: Records the total number of security incidents logged — supports cyber incident tracking for energy retail compliance and platform security oversight.
- Online Bill Payment Adoption Rate (%): Measures the proportion of customers paying bills through online channels — used in bill payment channel mix analysis to track digital payment migration against targets.
Frequently Asked Questions
1. What teams benefit most from the Natural Gas Retail CRM & Digital Channel Dashboard?
CRM managers, digital operations leads, and customer service teams at natural gas retail companies benefit most. Security and compliance teams also use it to monitor cyber incidents alongside service metrics.
2. Can this dashboard track performance across multiple regions and customer segments?
Yes. The Region / Distribution Zone and Customer Segment filters allow teams to isolate and compare performance across specific territories and customer groups within the same view.
3. How does the Bill Payment Channel Mix chart support payment strategy decisions?
The donut chart breaks down payment volume across mobile app, web portal, AutoPay, IVR, and agent-assisted channels. This bill payment channel mix analysis helps teams identify which channels are underutilized and where to focus adoption efforts.