What is a Suspicious Activity Tracker Dashboard?
A Suspicious Activity Tracker Dashboard template helps to monitor, detect, and manage potential fraudulent or abnormal activities across an organization’s operations. It enables security teams, compliance officers, and executives to gain real-time insights into suspicious behavior, track financial and operational risks, and mitigate threats.
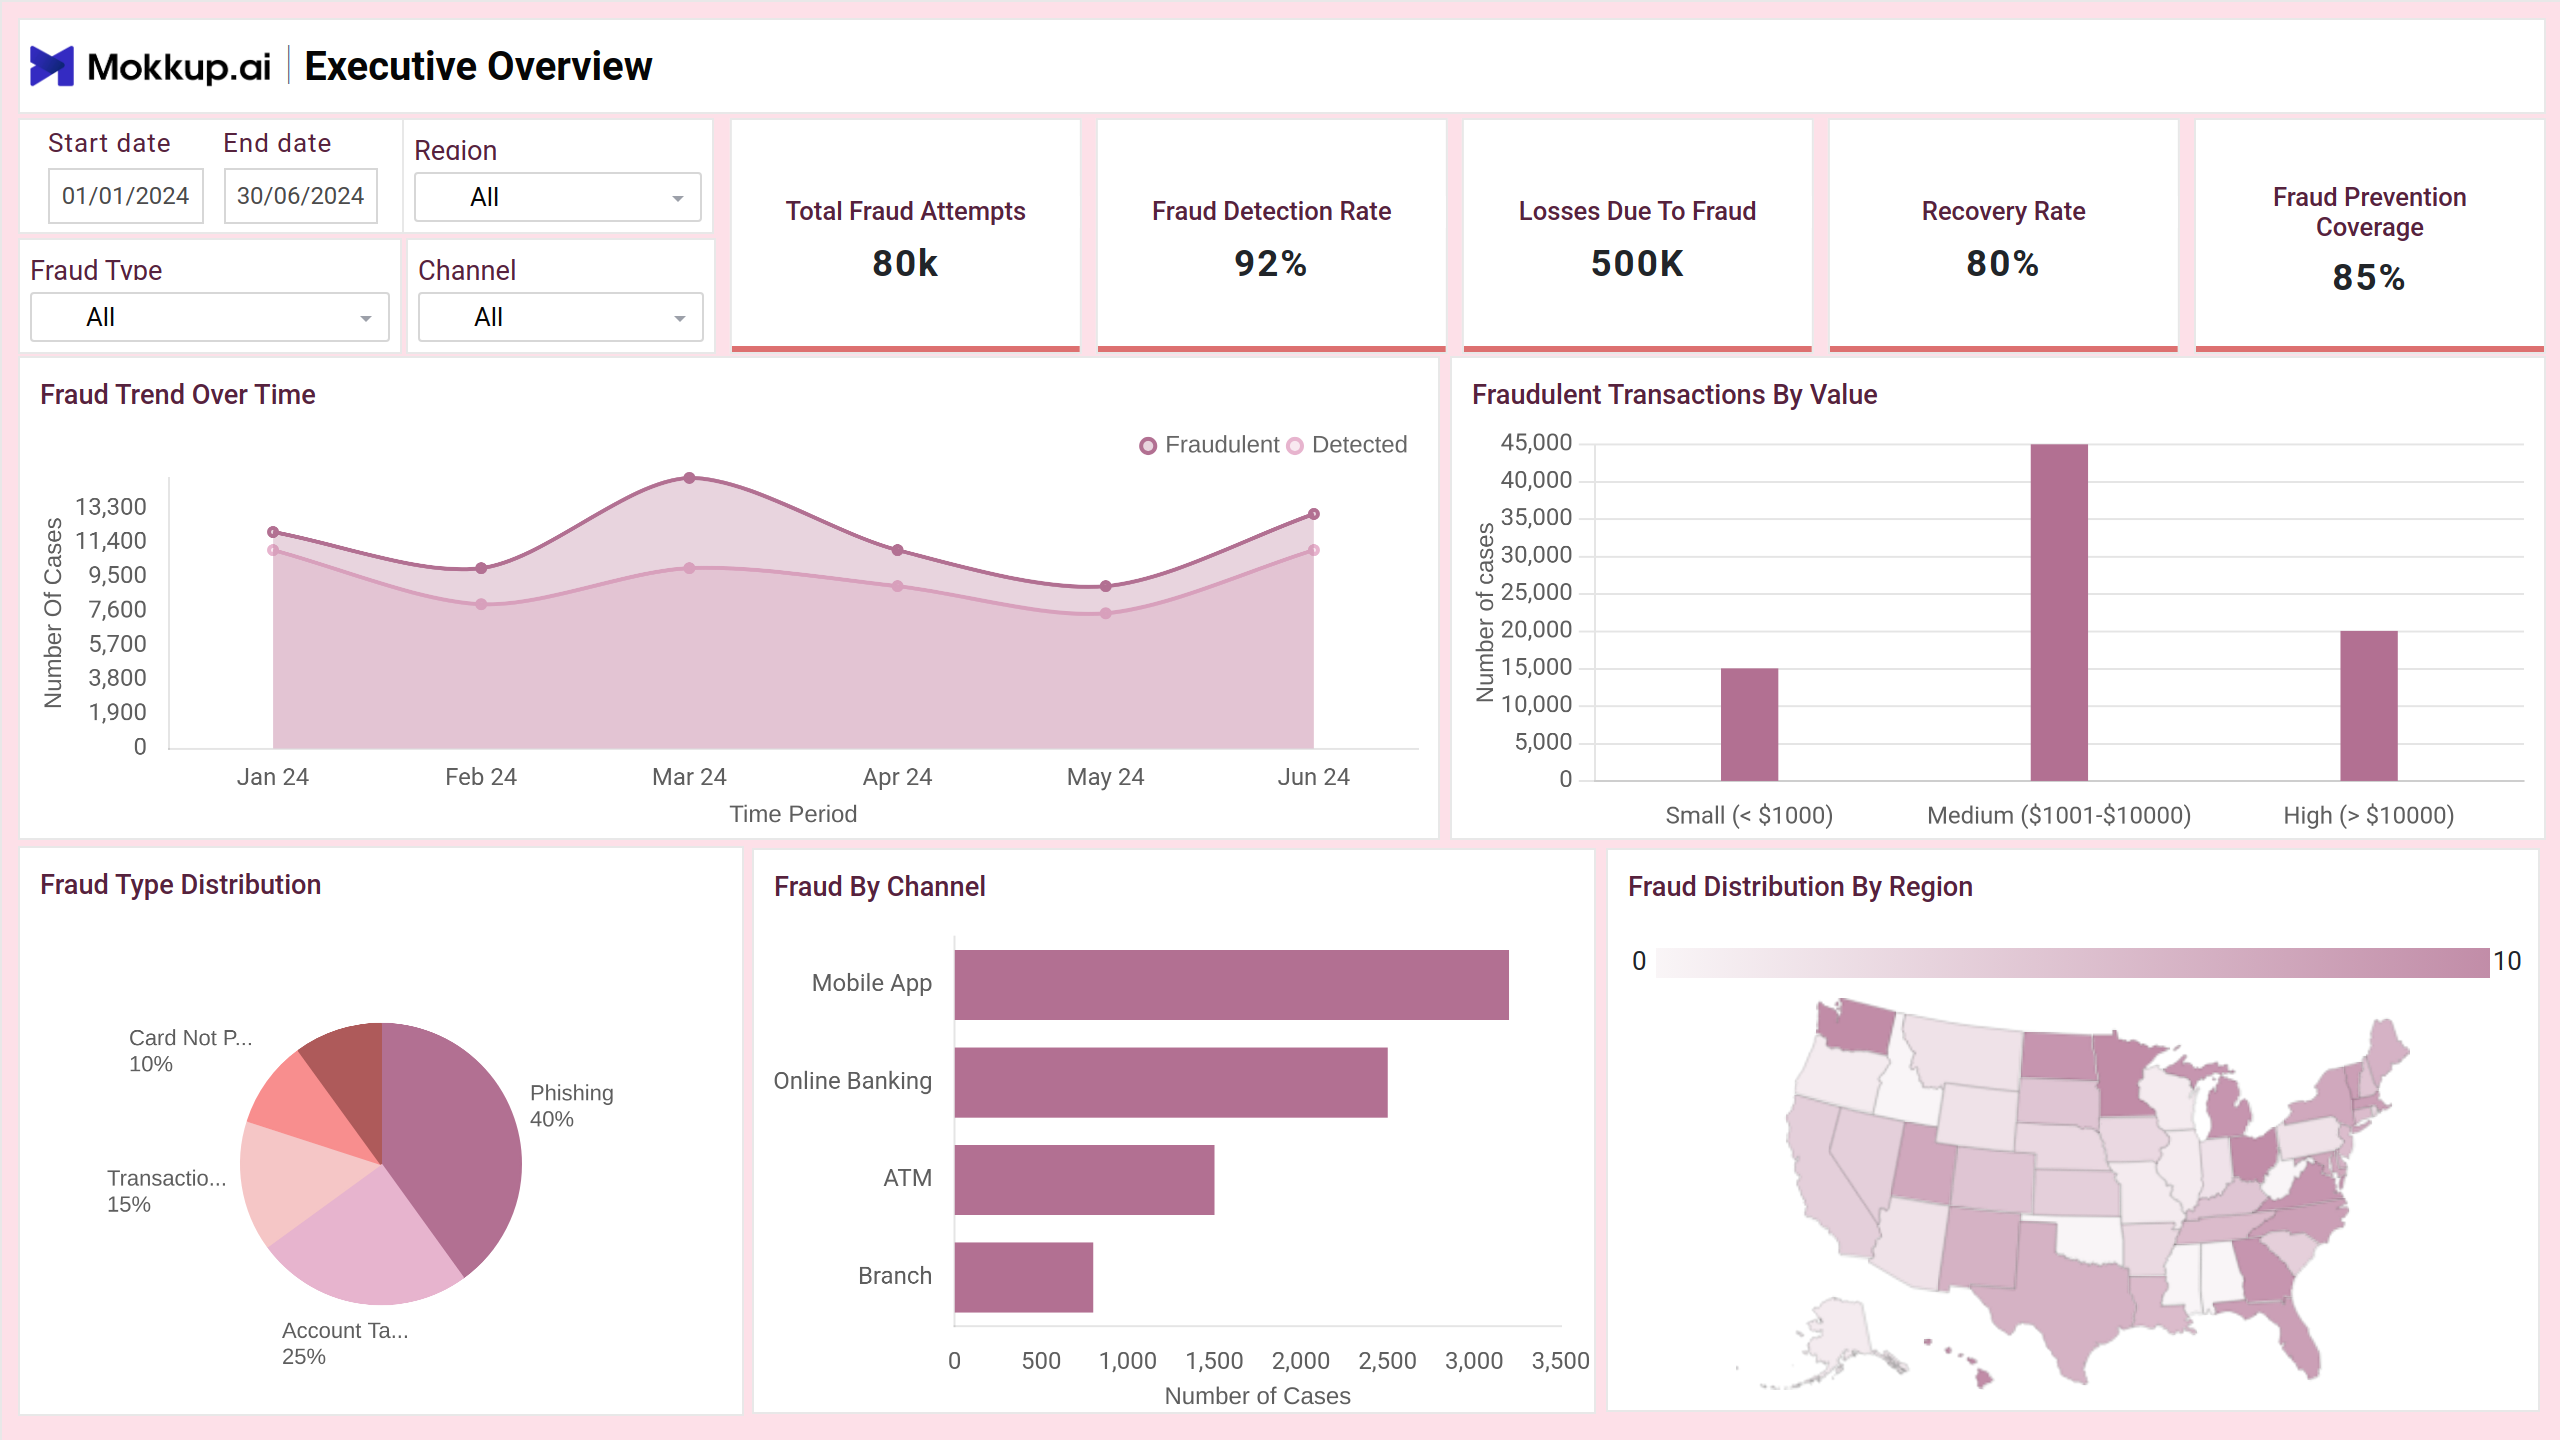
Suspicious Activity Dashboard Example
The Suspicious Activity Tracker Dashboard template offers a centralized, real-time view of unusual behaviors, fraud attempts, and system anomalies across regions, channels, and fraud types. Tailored for security analysts, fraud teams, and decision-makers, the dashboard wireframe visualizes key metrics such as detection rates, alert volumes, and financial losses, enabling teams to take swift, informed action to reduce risk and improve response efficiency.
How to Analyze Data in Suspicious Activity Dashboards
The Suspicious Activity Tracker Dashboard template helps organizations detect fraud patterns early, reduce financial losses, and enhance response effectiveness. Here’s how to approach it:
- Monitor fraud trends over time to track increases in fraud attempts and evaluate detection performance. Use dual-line area charts to compare attempted vs. detected cases.
- Review fraud types and channels through pie and bar charts to understand which fraud methods and platforms (online, mobile, etc.) are most exploited.
- Track the geographic distribution of fraud using map visuals to identify regional hotspots and tailor prevention strategies accordingly.
- Evaluate the financial impact of KPIs, such as fraud losses and recovery rate, to assess how much has been lost and recovered during the selected period.
- Inspect alert volumes and resolution status to see how many alerts are raised, how quickly they're resolved, and where false positives may occur.
- Analyze detection method performance through grouped bar charts to compare the accuracy and efficiency of AI, manual, and automated systems.
- Drill into case resolution timelines with trend lines showing average time to detect and resolve fraud, revealing where delays may occur.
With these visuals and metrics, the dashboard wireframe provides security teams with a clear path to improving fraud detection, reducing financial exposure, and fine-tuning operational workflows.
How to Create a Suspicious Activity Dashboard
You don’t need to build your report from scratch—just start with a ready-to-use sample Suspicious Activity Tracker Dashboard template from Mokkup. Add in your data and export it however you like. Here’s how to do it:
1. Create or Log in to Your Mokkup Account
Start by signing up on Mokkup.ai using your email. Already have an account? Just log in, and you’re good to go.
2. Choose and Customize Your Dashboard Template
Find the Suspicious Activity Tracker Dashboard in the Templates section. Use the drag-and-drop editor to adjust KPIs, edit filters, or add elements based on your data.
3. Export to Your BI Tool
Once your dashboard wireframe is ready, use the BI Tool Export feature to send it directly to Power BI or Tableau for further analysis and enhancements. You can also download the dashboard as a PDF, PNG, or JPEG, embed it on a platform, or invite your team to collaborate.
Note: This is a Pro template. To use and customize this dashboard wireframe, you’ll need a Pro subscription on Mokkup. Upgrade anytime to unlock full access.
Benefits of Suspicious Activity Tracking Dashboards
Mokkup.ai Security Dashboard template offers organizations a streamlined way to detect, respond to, and prevent fraud and anomalies across digital and physical channels. By centralizing risk metrics and alert data, they allow for faster decisions, proactive threat response, and reduced financial exposure. Here are some key benefits:
- Real-Time Fraud Detection: Enables security teams to monitor live activity and detect suspicious patterns instantly, improving the speed of incident response.
- Centralized Case Management: Consolidates alerts, cases, and resolution statuses in one place.
- Reduced Financial Losses: By quickly identifying high-value fraud attempts and recovery trends, businesses can minimize damage and improve restitution efforts.
- Performance Benchmarking: Tracks detection rates, alert resolution times, and incorrect alert ratios to evaluate system and team effectiveness.
- Improved Resource Allocation: Geographic and channel-based insights help direct fraud prevention resources to high-risk areas.
- Strategic Decision Support: Summarizes complex data into visual insights, making it easier for executives to align fraud prevention with organizational goals.
These dashboards help reduce threats, protect revenue, and increase organizational resilience.
KPIs to Track in Activity Monitoring Dashboards
Activity monitoring dashboards, especially those used for fraud or suspicious behavior tracking, rely on specific key performance indicators (KPIs) to measure effectiveness and identify risk patterns. These KPIs help teams evaluate detection accuracy, operational efficiency, and financial impact. Here are essential KPIs to track:
- Total Fraud Attempts: Measures the volume of attempted fraudulent activities within the selected period.
- Fraud Detection Rate: Shows the percentage of detected fraud cases compared to total attempts.
- Losses Due to Fraud: Calculates the total monetary loss incurred from successful fraud events.
- Recovery Rate: Percentage of recovered funds from detected fraud cases, showing the success of mitigation and resolution efforts.
- Total Alerts: Tracks the number of fraud alerts generated by detection systems, used to assess alert volume and frequency.
- Alert Resolution Rate: Measures the proportion of alerts that are resolved versus those pending or ignored.
- Incorrect Alert Rate (False Positives): Identifies how many fraud alerts were incorrectly flagged, helping assess detection accuracy.
These KPIs provide a clear picture of how well your activity monitoring system performs and where to improve detection, response, and operational efficiency.
Frequently Asked Questions
Q1. What types of suspicious activities can this dashboard detect?
The dashboard can detect activities such as identity theft, account takeovers, unusual transaction patterns, high-risk login attempts, and anomalies across different channels like mobile, web, or in-store.
Q2. How accurate is the alert system in identifying real fraud?
The dashboard tracks the fraud detection rate and incorrect alert (false positive) rate, helping organizations assess the precision of their detection systems and adjust rules or algorithms for better accuracy.