
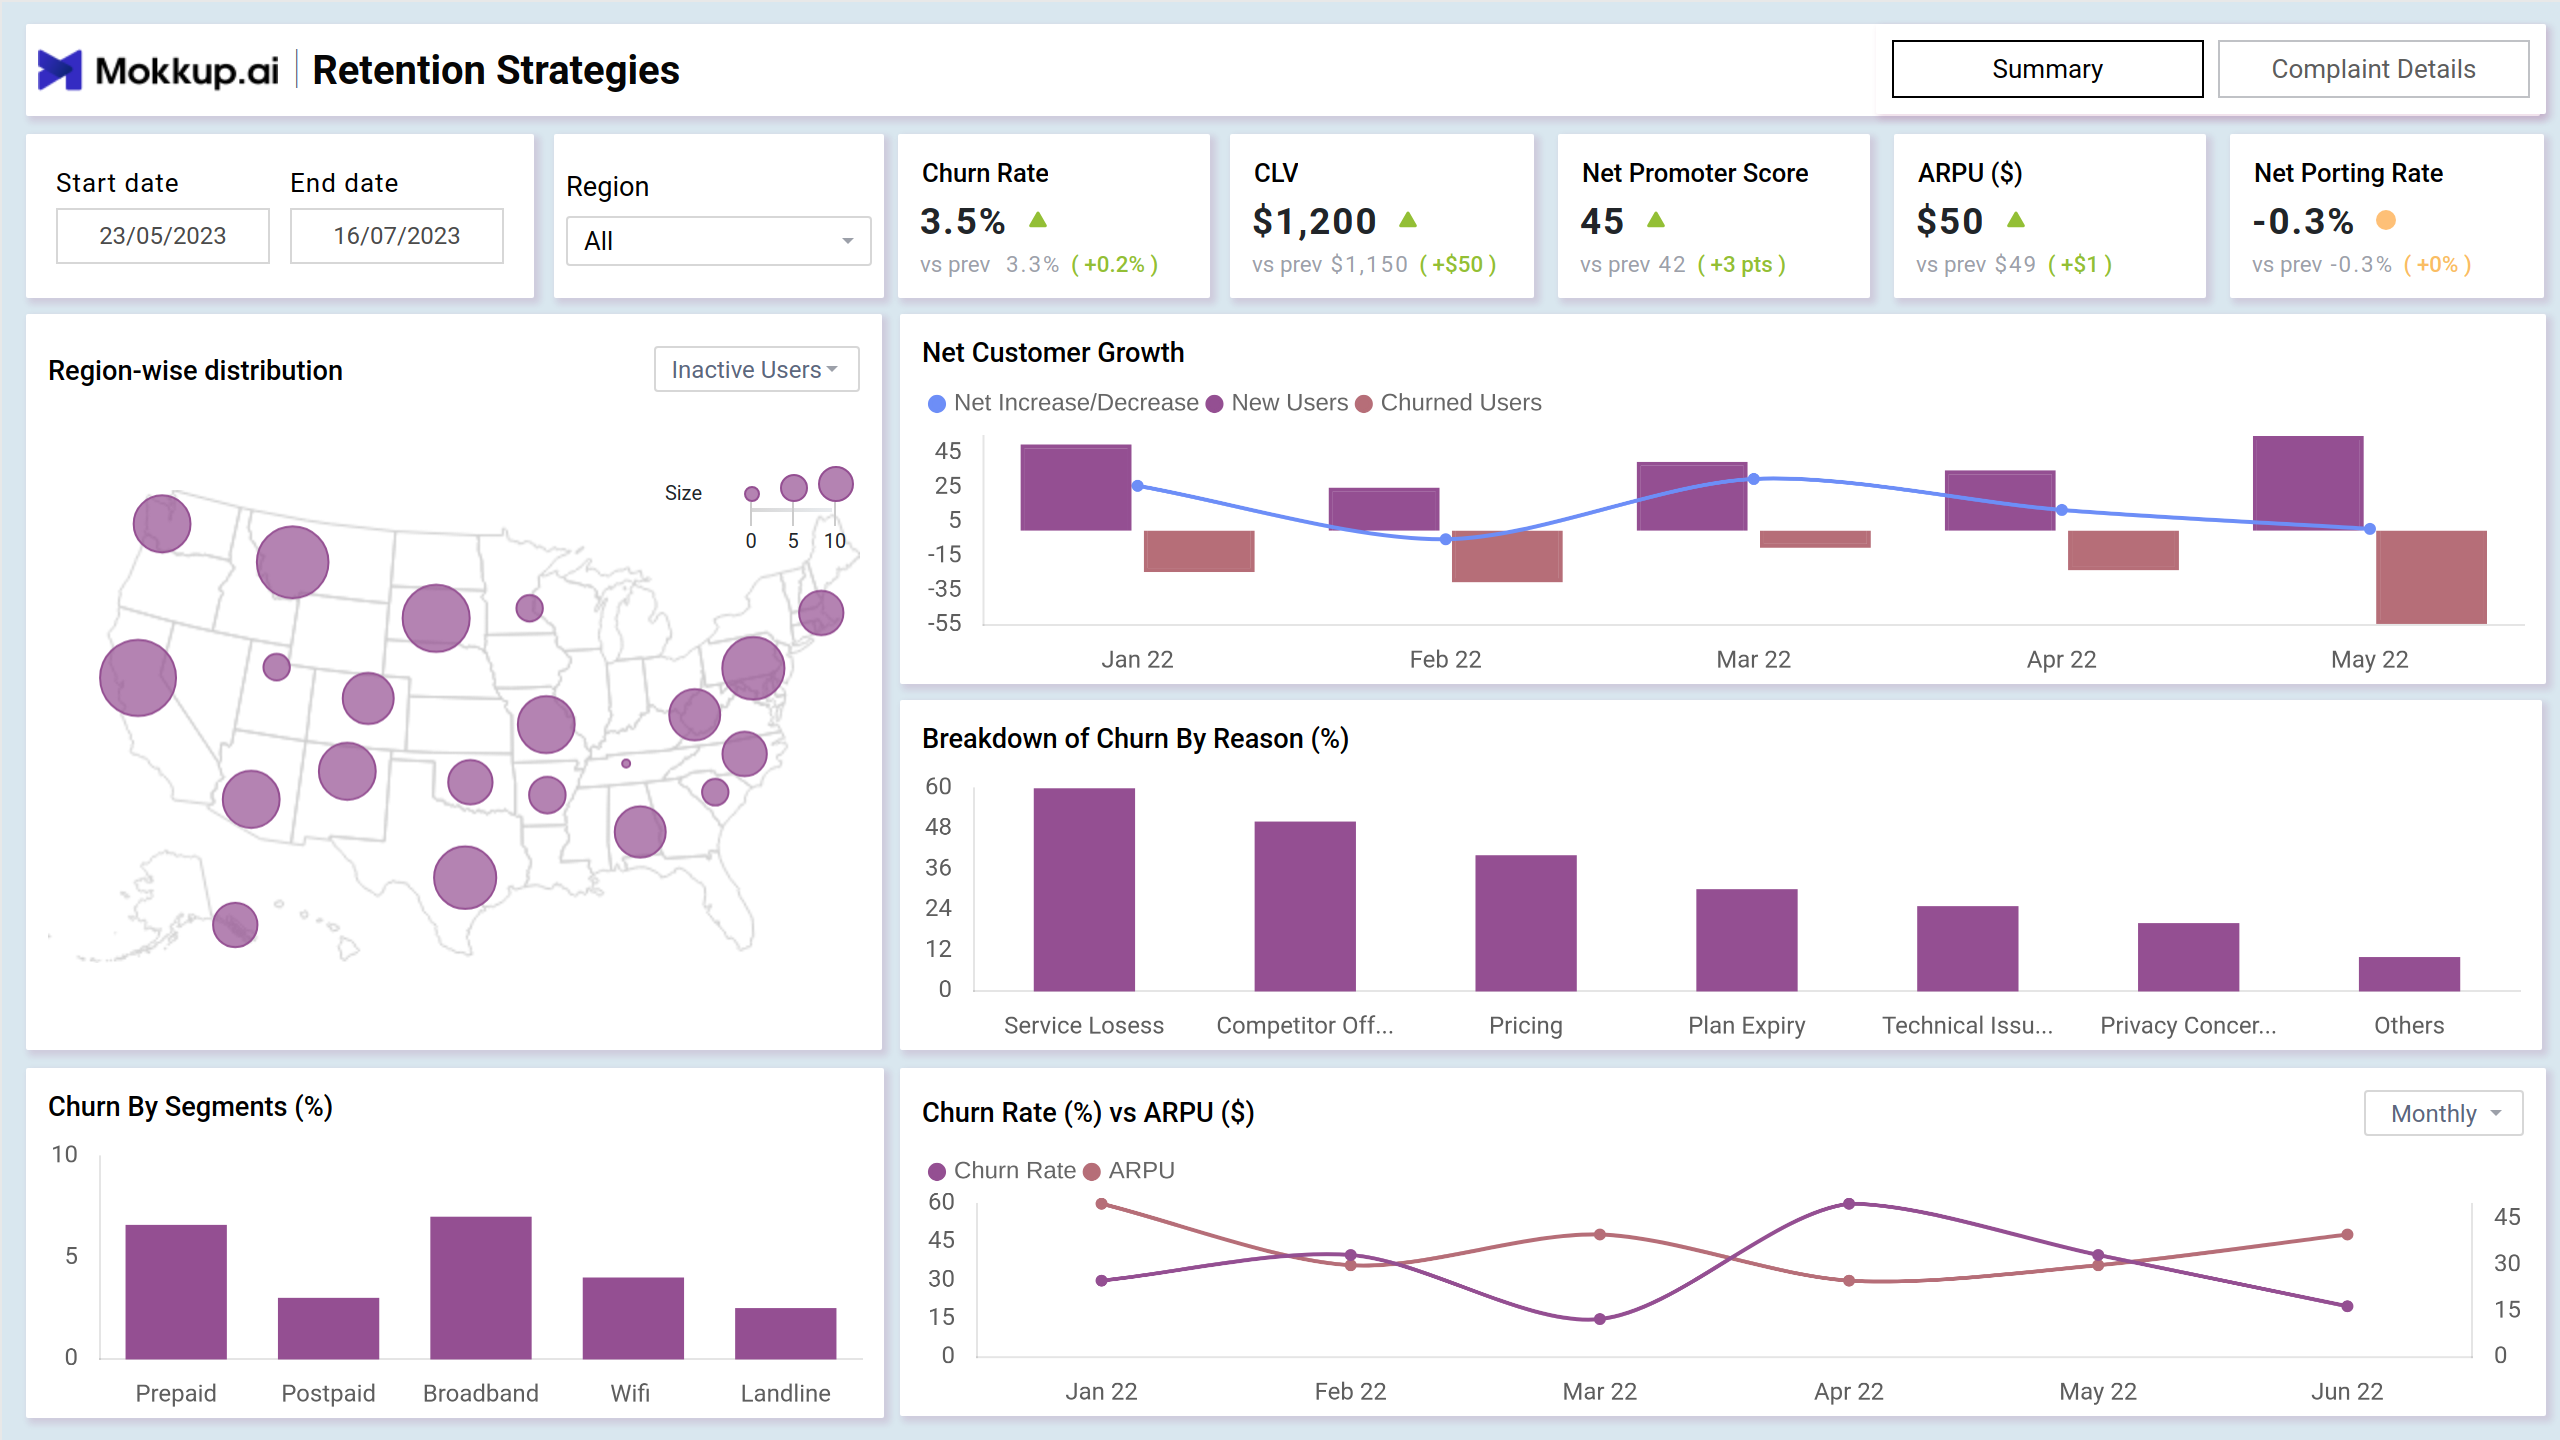
This engagement and retention tracker dashboard template provides telecom industry managers with a comprehensive view of their customer base, enabling them to make informed decisions and optimize their operations.
The dashboard template is divided into two screens: Retention Overview & Detailed Retention Analysis, each explained below.
Retention Overview
The screen covers key performance indicators such as Churn Rate, CLV, Net Promoter Score, and ARPU, allowing practice managers to identify the current status of customer retention, find areas for improvement, and implement targeted strategies.
Key Terms to Know
- Churn Rate: The churn rate represents the percentage of customers who have discontinued their service or subscription over a given period.
- Customer Lifetime Value (CLV): CLV is a metric that estimates the total revenue a customer is expected to generate over the lifetime of their relationship with the organization.
- Net Promoter Score (NPS): NPS is a customer loyalty metric that measures the likelihood of customers recommending the organization's products or services to others.
- Average Revenue Per User (ARPU): ARPU is a measure of the average revenue generated per customer.
- Net Porting Rate: The net porting rate reflects the difference between customers joining the organization (porting in) and customers leaving the organization (porting out).
- Region-wise Distribution: This map visualizes the regional distribution of customers, with the size of the circles representing the relative customer count.
- Inactive Users: This section provides insights into the number of inactive users, which can be a valuable indicator of potential churn.
Detailed Retention Analysis
The view's visualizations, including line charts, bar charts, combo charts, geo maps, bubble charts, and donut charts, provide a clear and intuitive way to analyze customer trends, distribution, and segmentation. This information can be used to enhance the customer experience, solve complaints, improve operational efficiency, and ultimately drive better retention outcomes for the telecom industry.
Key Terms to Know
- Net Customer Growth: This chart tracks the net increase or decrease in customers and the changes in new and churned users over time.
- Breakdown of Churn by Reason: This section provides a detailed analysis of the reasons for customer churn, allowing the organization to prioritize and address the key drivers.
- Churn Rate (%) vs ARPU ($): The correlation between churn rate and ARPU is displayed, enabling the identification of potential relationships between revenue and retention.
- Churn By Segments: The chart shows the churn rates across different customer segments, such as Prepaid, Postpaid, Broadband, and Landline, providing insights into the performance of specific product lines.
- Customer Segments: The scatter plot visualizes the distribution of customers based on their monthly usage and segment (Loyal, Promising, Need Attention, At Risk), helping the organization identify and target specific customer groups.
Dashboard Template Insights
This dashboard wireframe provides actionable insights to help businesses understand and improve customer loyalty.
- It showcases detailed churn percentages by segment, such as age, location, or activity level, enabling businesses to pinpoint trends and address key issues effectively.
- By including cohort analysis, it highlights retention trends over time, helping teams evaluate the impact of strategies and campaigns.
- The wireframe tracks essential metrics like active users, session duration, and feature usage, giving a clear picture of user engagement and behavior.
- Integrated user feedback allows businesses to correlate satisfaction levels with retention rates, empowering data-driven improvements.
Conclusion
The dashboard equips the telecom organization with a comprehensive view of its customer retention performance, empowering them to make data-driven decisions, address pain points, and continuously improve customer loyalty. By leveraging the insights provided in this dashboard, the organization can enhance its service quality, strengthen customer relationships, and maintain a competitive edge in the industry.