
What is a Natural Gas Retail Consumer Compliance & Audit Dashboard?
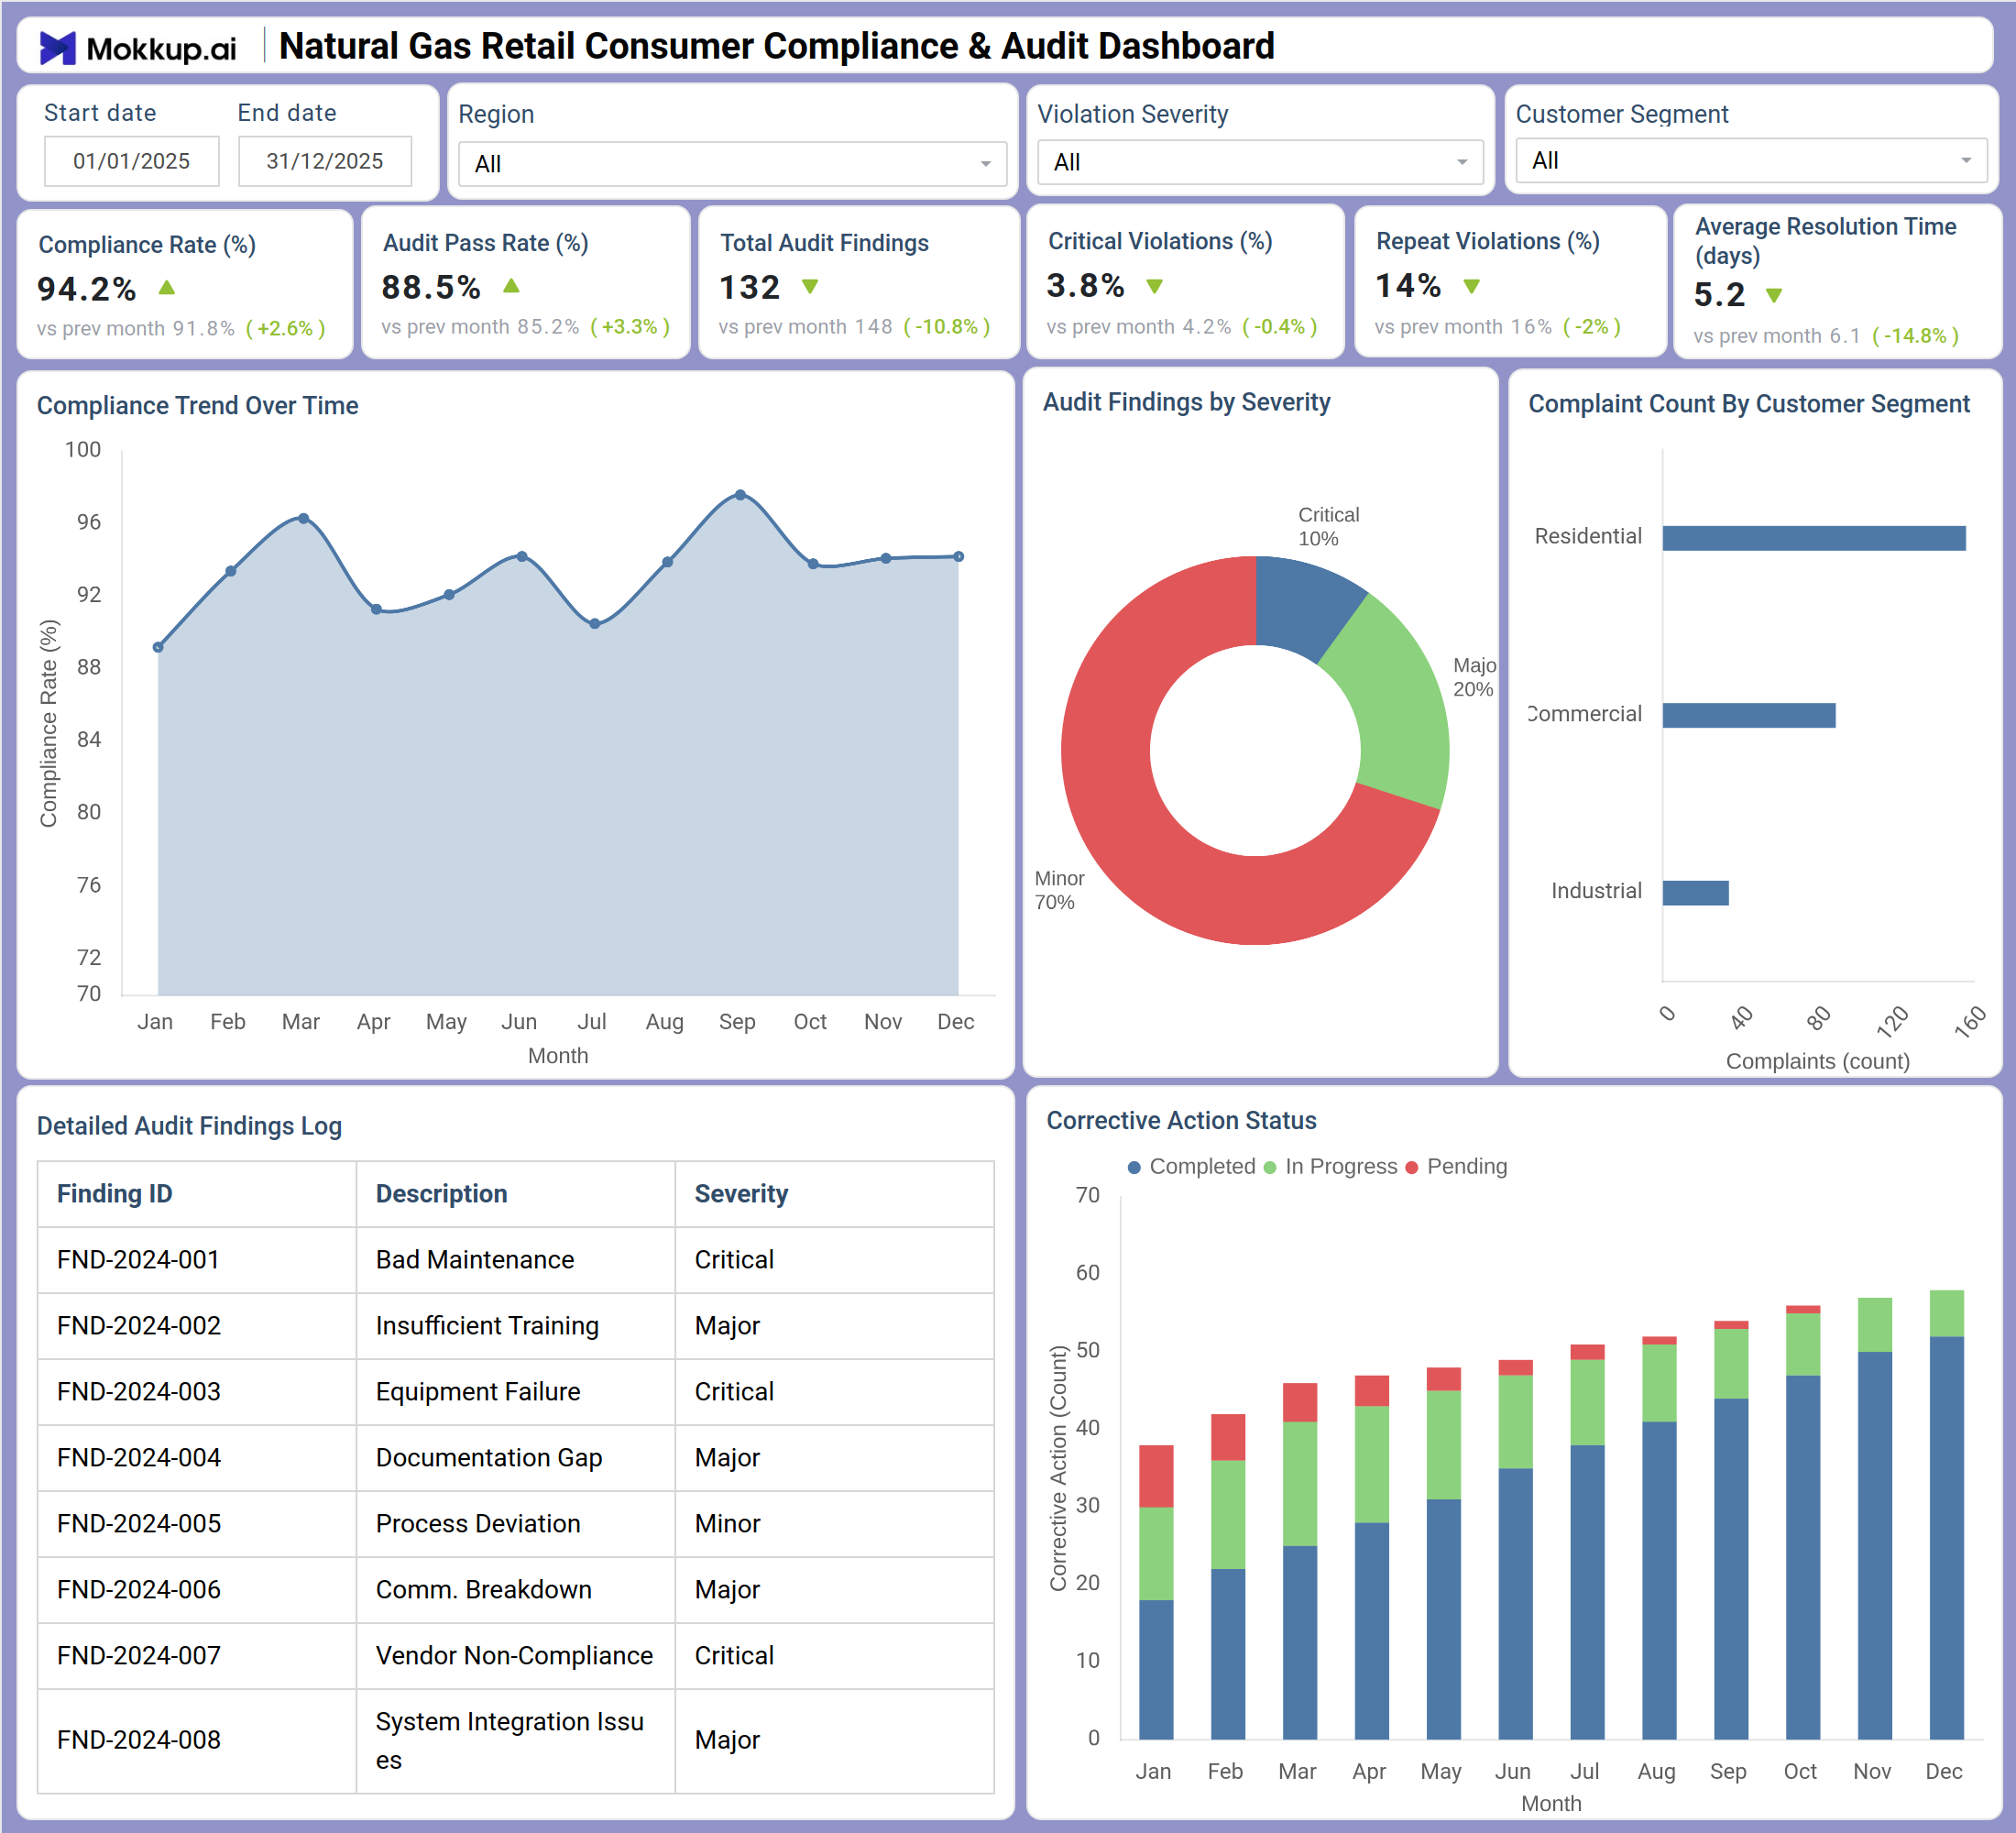
The Natural Gas Retail Consumer Compliance & Audit Dashboard is a purpose-built natural gas retail compliance dashboard designed for regulatory affairs teams, audit managers, and operations leaders at gas distribution companies. It tracks critical performance indicators, including Compliance Rate, Audit Pass Rate, Total Audit Findings, Critical Violations, Repeat Violations, and Average Resolution Time — giving compliance officers a unified view of how well the organization meets consumer protection and regulatory standards.
The gas utility audit pass rate visible on this dashboard helps teams quickly evaluate whether audit outcomes are improving or declining month over month, and whether corrective measures are taking effect. By consolidating audit logs, violation tracking, and corrective action progress into a single view, this natural gas retail compliance dashboard reduces reporting overhead and supports faster, more informed remediation decisions.
How to Create a Natural Gas Retail Consumer Compliance & Audit Dashboard
You don’t need to build your report from scratch, just start with a ready-to-use Natural Gas Retail Consumer Compliance & Audit dashboard template from Mokkup. Add in your data and export it however you like. Here’s how to do it:
1. Create or Log in to Your Mokkup Account
Start by signing up on Mokkup.ai using your email. If you already have an account, just log in, and you'll be good to go.
2. Choose and Customize Your Dashboard Template
Find the Natural Gas Retail Consumer Compliance & Audit Dashboard template in the Templates section. Use the drag-and-drop editor to adjust KPIs, edit filters, or add elements based on your data.
3. Export to Your BI Tool
Once your dashboard wireframe is ready, use the BI Tool Export feature to send it directly to Power BI or Tableau for further analysis and enhancements. You can also download the dashboard as a PDF, PNG, or JPEG, embed it on a platform, or invite your team to collaborate.
Note: This is a Pro template. You'll need a Pro subscription on Mokkup to use and customize this dashboard wireframe. Upgrade anytime to unlock full access.
Natural Gas Retail Consumer Compliance & Audit Dashboard Example
A compliance manager at a gas distribution utility opens this dashboard to get a quick read on how the organization is performing against regulatory benchmarks across all customer segments. By scanning the KPI tiles at the top, the manager can immediately assess whether the overall compliance posture is holding or whether new violations are emerging that need escalation. If the Critical Violations or Repeat Violations percentages are trending in the wrong direction, the manager knows to investigate which regions or customer segments are driving the deterioration before it reaches a regulatory reporting threshold. Moving deeper, the team uses the Compliance Trend Over Time chart to understand seasonal or operational patterns — identifying months where performance historically dips and planning preventive measures in advance. The audit findings severity tracking view, available through the Audit Findings by Severity donut chart, helps the team quickly assess whether the audit caseload is weighted toward minor process deviations or toward more serious critical and major findings that carry higher regulatory risk.
When it comes to acting on findings, the corrective action status monitoring capabilities of this dashboard become critical. Managers can see month by month how many corrective actions are completed, how many are still in progress, and how many remain pending — enabling leadership to intervene when backlogs are building. The Complaint Count by Customer Segment chart further helps customer-facing teams understand which segment — Residential, Commercial, or Industrial — is generating the most complaints, so resources can be directed where they will have the greatest impact on service quality and compliance outcomes.
How to Analyze Data in a Natural Gas Retail Consumer Compliance & Audit Dashboard
Here is how you can analyze data from this dashboard:
- Filter by Region: Compare compliance performance across geographic service areas.
- Track Compliance Rates: Review KPI trends to identify improving or declining compliance performance.
- Monitor Compliance Trends: Use trend charts to detect seasonal dips before escalation risks increase.
- Analyze Corrective Actions: Review corrective action status to identify growing backlogs of pending items.
- Compare Complaint Volumes: Analyze complaints by customer segment to identify high-risk groups.
- Review Audit Findings: Use the findings log to pinpoint recurring issues and critical violations.
- Focus on High-Severity Violations: Filter by severity to prioritize Critical and Major findings.
- Measure Resolution Efficiency: Track average resolution time and repeat violations to assess process improvements.
Benefits of a Natural Gas Retail Consumer Compliance & Audit Dashboard
The following are the benefits of using this dashboard:
- Centralized Compliance Visibility: Combines audit findings, compliance rates, and violation metrics in one view.
- Severity-Based Tracking: Supports monitoring across Critical, Major, and Minor findings.
- Reduced Reporting Effort: Prebuilt KPIs and charts simplify regulatory reporting workflows.
- Regional Performance Insights: Helps identify areas needing operational or staffing improvements.
- Corrective Action Monitoring: Tracks completion, progress, and pending actions over time.
- Regulatory Alignment: Supports compliance across multiple frameworks without rebuilding reports.
- Shared Operational View: Aligns audit, compliance, and customer-facing teams around performance metrics.
KPIs to Track in a Natural Gas Retail Consumer Compliance & Audit Dashboard
The following key KPIs can be tracked by using this dashboard:
- Compliance Rate (%): The core metric of any natural gas retail compliance dashboard — measures the percentage of operations meeting all applicable regulatory standards and is the primary indicator of overall compliance health.
- Audit Pass Rate (%): Tracks the share of audits that fully satisfy compliance criteria — a direct reflection of how effectively the gas utility audit pass rate is trending and whether internal controls are functioning as intended.
- Total Audit Findings (count): Quantifies all issues identified in the audit cycle — supporting corrective action status monitoring by establishing the baseline caseload for prioritization and resolution tracking.
- Critical Violations (%): Measures the proportion of findings classified at the highest risk tier — key to consumer complaint resolution time analysis by surfacing the most urgent remediation needs before they escalate to regulatory action.
- Repeat Violations (%): Central to repeat violations compliance management — evaluates how often the same issue recurs across audit cycles, and a persistently high rate signals systemic process failures requiring structural corrective action rather than one-off fixes.
- Average Resolution Time (days): Tracks how quickly audit findings are closed across Critical, Major, and Minor severity levels — a lower value reflects faster, more efficient remediation workflows across the organization.
Frequently Asked Questions
Q1. What teams use a Natural Gas Retail Consumer Compliance & Audit Dashboard?
Regulatory affairs teams, compliance officers, audit managers, customer operations leaders, and vendor management teams at gas distribution utilities use this dashboard to monitor performance against consumer protection standards, track audit findings by severity, and manage corrective actions from identification through resolution.
Q2. How does this dashboard improve audit remediation efficiency?
The Corrective Action Status chart breaks down monthly remediation progress into Completed, In Progress, and Pending categories, giving compliance leads clear visibility into where bottlenecks are forming. Combined with the Detailed Audit Findings Log, teams can connect specific findings — such as Bad Maintenance, Equipment Failure, or Documentation Gaps — to open corrective actions and accelerate closure before findings recur in the next audit cycle.
Q3. Can this dashboard track compliance trends by customer segment?
Yes. The Customer Segment filter and the Complaint Count By Customer Segment bar chart together allow teams to isolate complaint volumes and compliance trends for Residential, Commercial, and Industrial customers separately, making it straightforward to identify which segment needs focused intervention and to allocate compliance resources accordingly.
Q4. How does the Audit Findings by Severity donut chart work?
The Audit Findings by Severity donut chart categorizes all audit findings into three severity tiers — Minor, Major, and Critical — and displays the proportional share of each tier within total findings. Teams use this view to quickly assess whether the audit caseload is dominated by lower-risk process deviations or by serious critical violations that carry higher regulatory consequences and require escalated response.
Q5. What does Repeat Violations (%) measure?
Repeat Violations (%) measures the percentage of audit findings that recur across successive audit cycles, indicating unresolved systemic compliance gaps. It is the key metric for repeat violations compliance management — a persistently high rate signals that initial corrective actions are not adequately addressing root causes and that deeper process redesign, training, or vendor accountability measures are needed.