
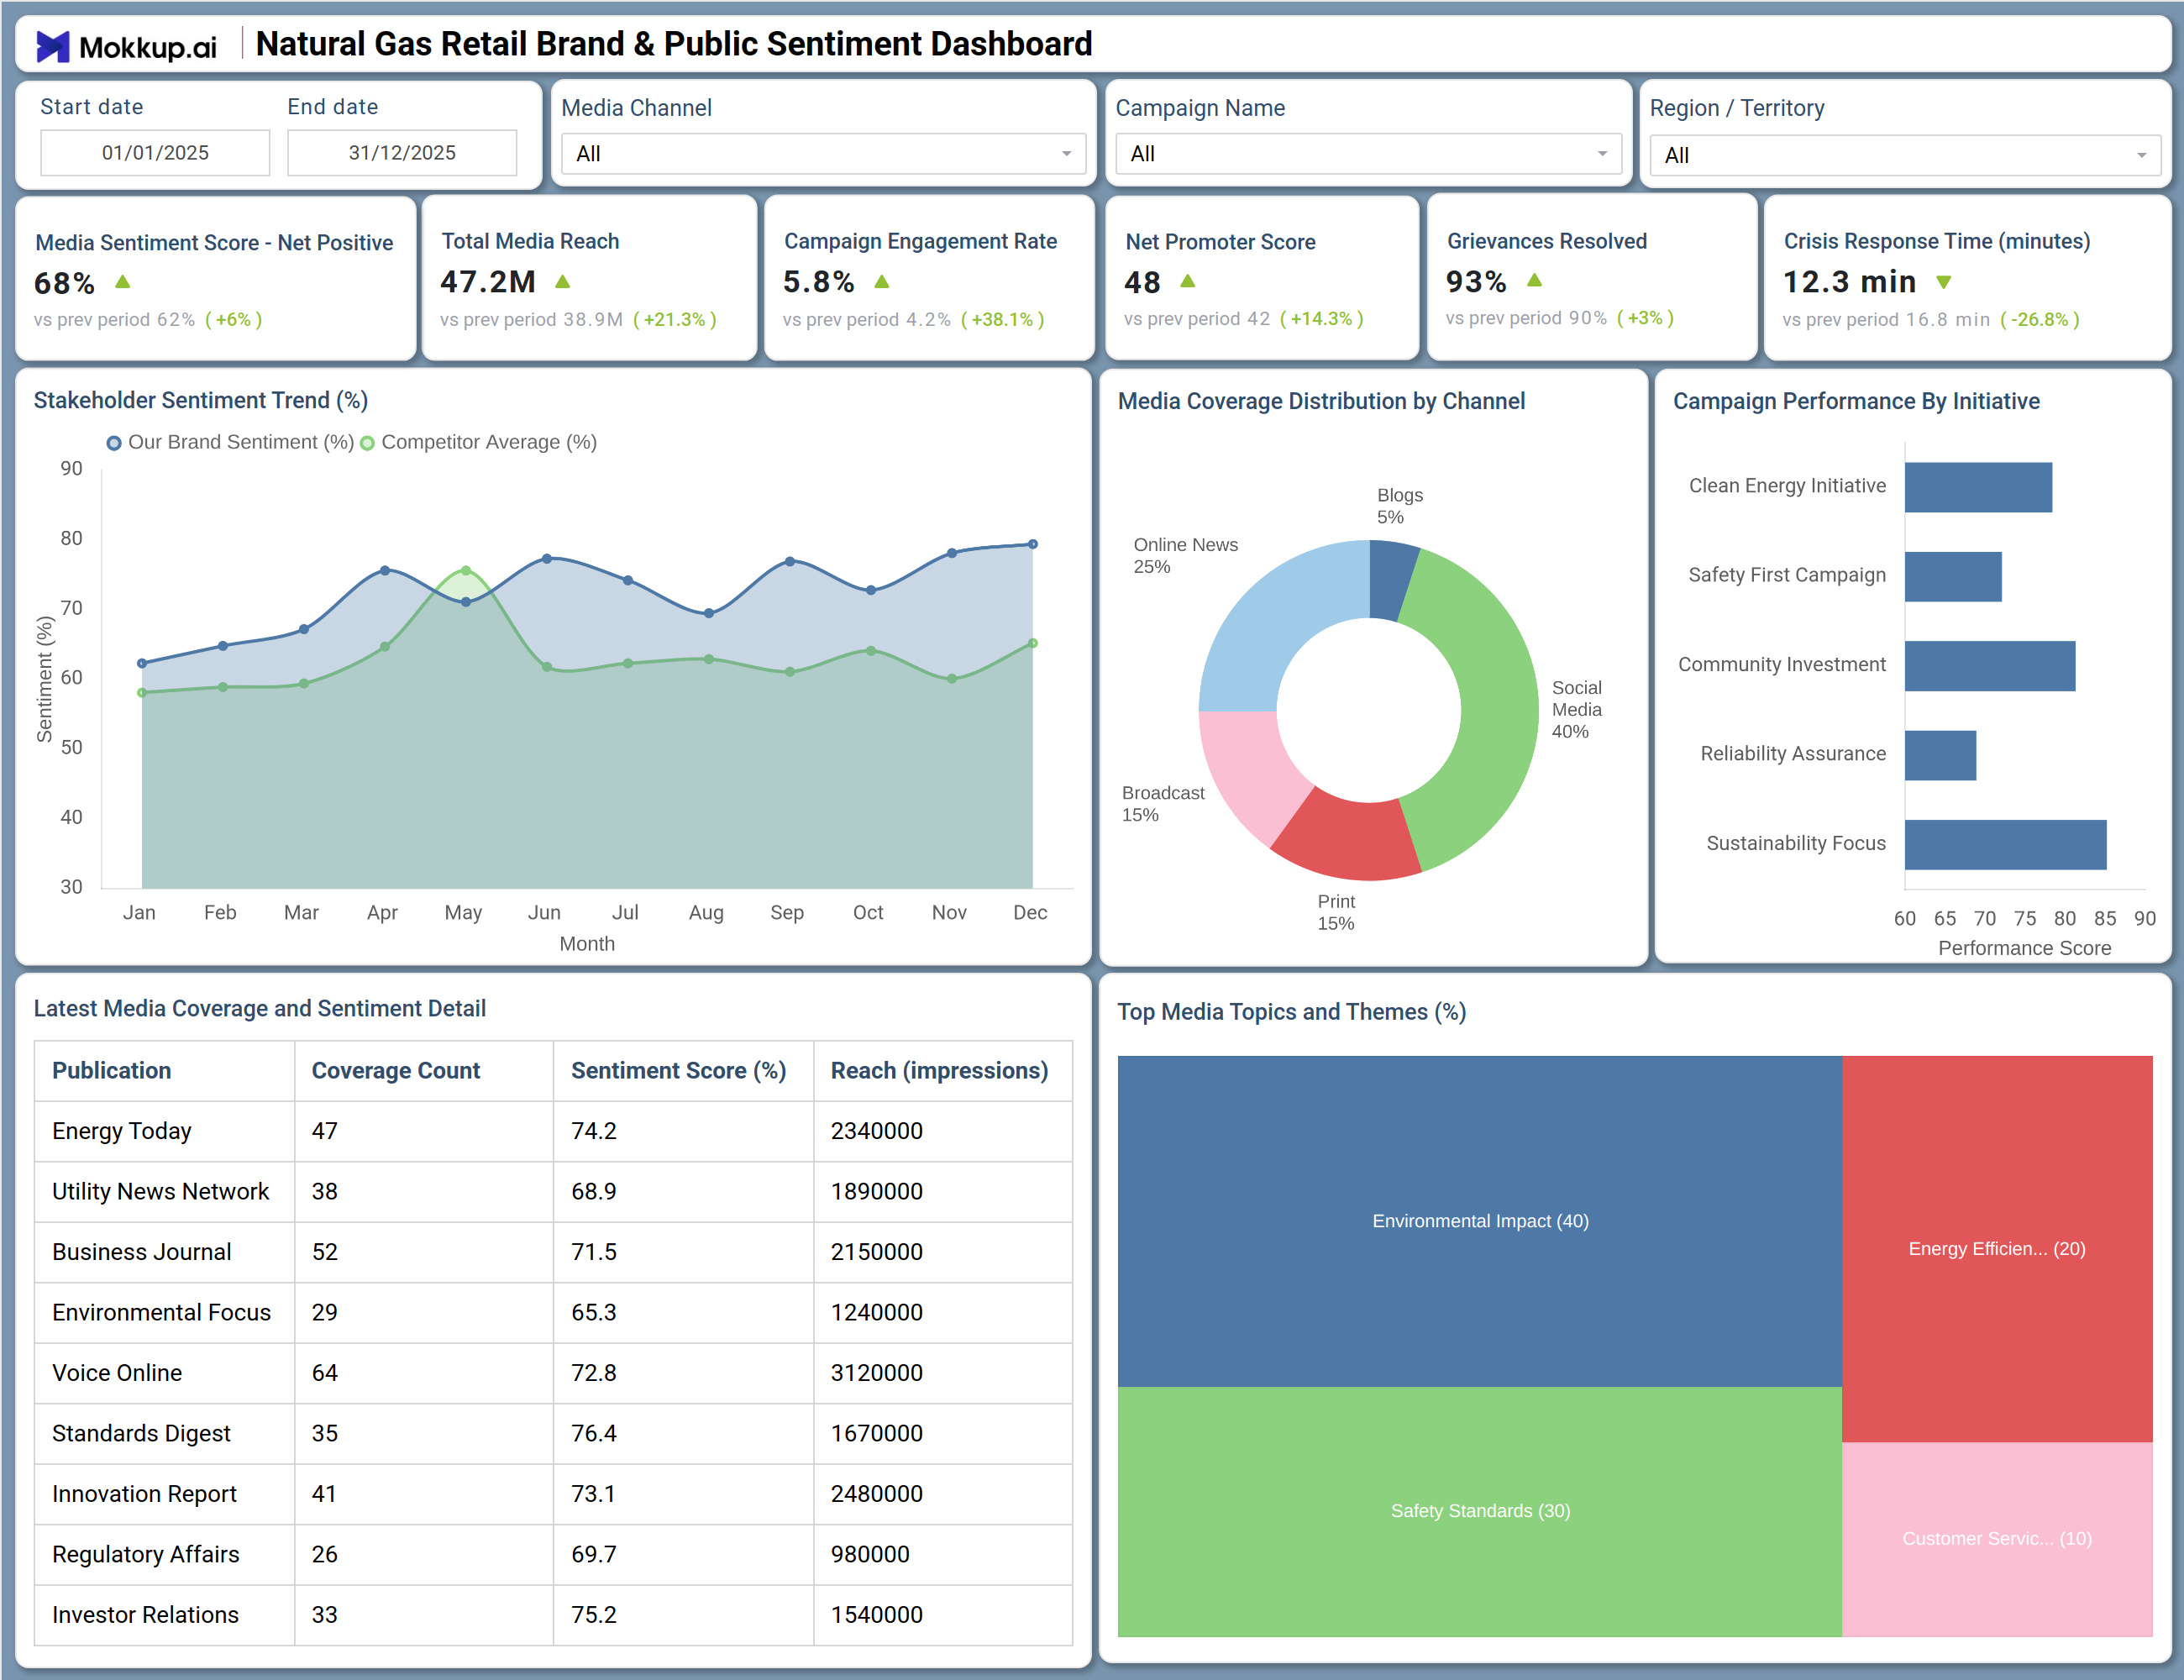
What is a Natural Gas Retail Brand & Public Sentiment Dashboard?
The Natural Gas Retail Brand & Public Sentiment Dashboard is a media intelligence and brand analytics tool built for communications teams, public affairs executives, and brand managers at natural gas retail organizations. As a natural gas brand sentiment dashboard, it centralizes the media sentiment score natural gas teams depend on — alongside campaign engagement metrics, total media reach, and crisis response indicators — giving leaders a complete, channel-by-channel view of how the company is perceived across print, broadcast, digital, and social media. The platform tracks essential KPIs, including net positive media sentiment, campaign engagement rate, net promoter score, grievances resolved, and crisis response time, providing an ongoing picture of brand health and stakeholder trust. With public sentiment media coverage tracking built in, organizations can also benchmark their brand against competitor sentiment trends and proactively manage reputational exposure before it escalates.
How to Create a Natural Gas Retail Brand & Public Sentiment Dashboard
You don't need to build your report from scratch, just start with a ready-to-use dashboard template from Mokkup. Add in your data and export it however you like. Here's how to do it:
1. Create or Log in to Your Mokkup Account
Start by signing up on Mokkup.ai using your email. If you already have an account, just log in, and you'll be good to go.
2. Choose and Customize Your Dashboard Template
Find the Natural Gas Retail Brand & Public Sentiment Dashboard template in the Templates section. Use the drag-and-drop editor to adjust KPIs, edit filters, or add elements based on your data.
3. Export to Your BI Tool
Once your dashboard wireframe is ready, use the BI Tool Export feature to send it directly to Power BI or Tableau for further analysis and enhancements. You can also download the dashboard as a PDF, PNG, or JPEG, embed it on a platform, or invite your team to collaborate.
Note: This is a Pro template. You'll need a Pro subscription on Mokkup to use and customize this dashboard wireframe. Upgrade anytime to unlock full access.
Natural Gas Retail Brand & Public Sentiment Dashboard Example
For a natural gas retail company's communications director, this dashboard transforms what would normally be a week of manual media compilation into a daily pulse check on brand health. When opening the dashboard at the start of a reporting cycle, the team immediately understands whether overall media perception is trending positively — and how that trajectory compares with what competitors are achieving in the same period. When sentiment dips in a particular month, teams can trace whether the shift aligns with a specific media channel or campaign launch and decide where to direct messaging resources to course-correct. As the team digs deeper into media distribution, they can assess which channels are generating the majority of brand coverage and whether the highest-reach platforms are also delivering the most favorable sentiment. This helps media planners make data-backed decisions about where to concentrate outreach budgets for the next campaign cycle.
The publication-level breakdown then allows analysts to rank the most impactful outlets and flag any that are high-reach but trending negatively, so PR managers can prioritize relationship-building accordingly. Natural gas campaign performance tracking becomes significantly more structured through the initiative-level comparison view. Campaign managers can evaluate which programs — whether focused on clean energy messaging, safety, community investment, or reliability assurance — are resonating most with audiences, and use that insight to decide which efforts to scale, refine, or pause before the next planning period begins. The topics and themes breakdown helps the team understand which subject areas are dominating media conversations — whether that is environmental impact, safety standards, energy efficiency, or customer service. By aligning internal messaging with the topics that external audiences are already discussing, communications leaders can ensure their campaigns are entering conversations that already have momentum rather than trying to create new ones from scratch.
How to Analyze Data in a Natural Gas Retail Brand & Public Sentiment Dashboard
Here is how you can analyze data from this dashboard:
- Use the Media Channel filter to isolate sentiment and reach data for a specific platform — such as social media, broadcast, or online news — and identify which channels are driving the most favorable brand coverage.
- Review the Stakeholder Sentiment Trend chart to compare brand sentiment against the Competitor Average every month and pinpoint periods where perception is declining before it becomes a reputational risk.
- Monitor the Crisis Response Time KPI alongside the Grievances Resolved percentage to assess whether incident management is improving and flag when response speeds begin to slip.
- Analyze the Campaign Performance By Initiative bar chart to evaluate which initiative is delivering the highest performance scores and optimize natural gas campaign performance tracking investment accordingly.
- Compare the Top Media Topics and Themes treemap to identify which subject areas — environmental impact, safety standards, energy efficiency, or customer service — are commanding the most media coverage in a given period.
- Investigate the Latest Media Coverage and Sentiment Detail table to rank publications by reach and sentiment score and flag any outlets that are high-impression but trending negative.
- Filter by Region / Territory to align brand perception insights with specific geographic markets and tailor communications strategies to local audience dynamics.
- Track the Net Promoter Score over time to measure progress in building customer loyalty and brand advocacy across the retail gas market.
Benefits of a Natural Gas Retail Brand & Public Sentiment Dashboard
The following are the benefits of using this dashboard:
- Centralizes comprehensive public sentiment media coverage tracking — including media reach, sentiment scores, campaign engagement, and crisis response metrics — across all channels in one structured template.
- Supports media sentiment score natural gas monitoring across social media, broadcast, print, online news, and blog channels simultaneously.
- Reduces manual data compilation for brand and PR reporting with pre-built KPI tiles, sentiment trend charts, and publication-level table layouts.
- Enables region-level analysis of stakeholder sentiment trend analysis to guide targeted communications, investment, and public affairs strategy.
- Provides a horizontal bar chart breakdown of campaign initiative performance scores for marketing efficiency planning.
- Helps communications teams align brand messaging with the media topics that resonate most with stakeholders, without rebuilding reports from scratch.
- Gives brand managers and public affairs executives a shared view of media sentiment performance and campaign effectiveness.
KPIs to Track in a Natural Gas Retail Brand & Public Sentiment Dashboard
The following key KPIs can be tracked by using this dashboard:
- Media Sentiment Score - Net Positive (%): This natural gas brand sentiment dashboard KPI measures the percentage of media coverage carrying a net positive tone — the primary indicator of overall brand health and reputational standing in the market.
- Total Media Reach (M): Tracks the total audience impressions generated across all media channels — indicating how broadly the brand message is reaching target markets and key stakeholder groups.
- Campaign Engagement Rate (%): Quantifies audience interaction with brand campaigns — a key indicator of how effectively natural gas campaign performance tracking efforts are converting media presence into active audience engagement.
- Net Promoter Score: Measures customer loyalty and likelihood to recommend the brand — central to stakeholder sentiment trend analysis and understanding long-term public trust in the organization.
- Grievances Resolved (%): Evaluates the percentage of customer and stakeholder complaints successfully addressed — a net promoter score gas utility team tracks this alongside NPS to understand how service recovery shapes brand advocacy.
- Crisis Response Time (minutes): Tracks how quickly the organization responds to media crises and public incidents across all regions and media channels monitored in the dashboard.
Frequently Asked Questions
1. What teams use a Natural Gas Retail Brand & Public Sentiment Dashboard?
Communications teams, brand managers, public affairs executives, and media relations professionals at natural gas retail companies use this dashboard to monitor brand reputation, track campaign outcomes, and assess media coverage across all channels.
2. How does this dashboard improve brand reputation management?
By combining the Stakeholder Sentiment Trend chart, the Media Coverage Distribution by Channel donut chart, and the Campaign Performance By Initiative bar chart into one workspace, teams can quickly identify where sentiment is declining, which campaigns are underperforming, and which media topics require immediate attention.
3. Can this dashboard track multiple media channels simultaneously?
Yes. The Media Channel filter and the Media Coverage Distribution by Channel donut chart allow users to monitor brand presence and sentiment across social media, online news, broadcast, print, and blogs — all within a single view.
4. How does the Top Media Topics and Themes treemap work?
The Top Media Topics and Themes treemap displays the relative share of media coverage across key conversation categories, environmental impact, energy efficiency, safety standards, and customer service. Larger boxes represent topics receiving a greater proportion of media attention, helping teams align messaging with the areas stakeholders are actively discussing.
5. What does Net Promoter Score measure?
Net Promoter Score measures the likelihood that customers will recommend the brand to others, serving as a leading indicator of customer loyalty. For a net promoter score gas utility team, this KPI reflects how effectively the company's public communications, service quality, and campaign outcomes are translating into positive customer advocacy.