What is a Natural Gas Retail B2B Sales Performance Dashboard?
The Natural Gas Retail B2B Sales Performance Dashboard is a structured analytics template built for commercial sales teams managing large-volume account portfolios in the natural gas retail sector. This natural gas retail B2B sales dashboard consolidates revenue performance, funnel conversion metrics, and customer health indicators into a single, filterable view that sales leaders can act on immediately. From tracking lead-to-win conversion rates to assessing customer churn rate in energy retail, the dashboard connects every stage of the commercial sales cycle to measurable outcomes. Filters for Customer Segment, Sales Region, and Account Manager allow teams to slice data by territory or individual contributor, supporting both strategic planning and targeted coaching. Whether the goal is identifying funnel bottlenecks, reviewing account manager productivity, or understanding which geographies carry the most pipeline, this template gives commercial teams the structure to make data-driven decisions faster.
How to Create a Natural Gas Retail B2B Sales Performance Dashboard
You don't need to build your report from scratch, just start with a ready-to-use dashboard template from Mokkup. Add in your data and export it however you like. Here's how to do it:
1. Create or Log in to Your Mokkup Account
Start by signing up on Mokkup.ai using your email. If you already have an account, just log in, and you'll be good to go.
2. Choose and Customize Your Dashboard Template
Find the Natural Gas Retail B2B Sales Performance Dashboard template in the Templates section. Use the drag-and-drop editor to adjust KPIs, edit filters, or add elements based on your data.
3. Export to Your BI Tool
Once your dashboard wireframe is ready, use the BI Tool Export feature to send it directly to Power BI or Tableau for further analysis and enhancements. You can also download the dashboard as a PDF, PNG, or JPEG, embed it on a platform, or invite your team to collaborate.
Note: This is a Pro template. You'll need a Pro subscription on Mokkup to use and customize this dashboard wireframe. Upgrade anytime to unlock full access.
Natural Gas Retail B2B Sales Performance Dashboard Example
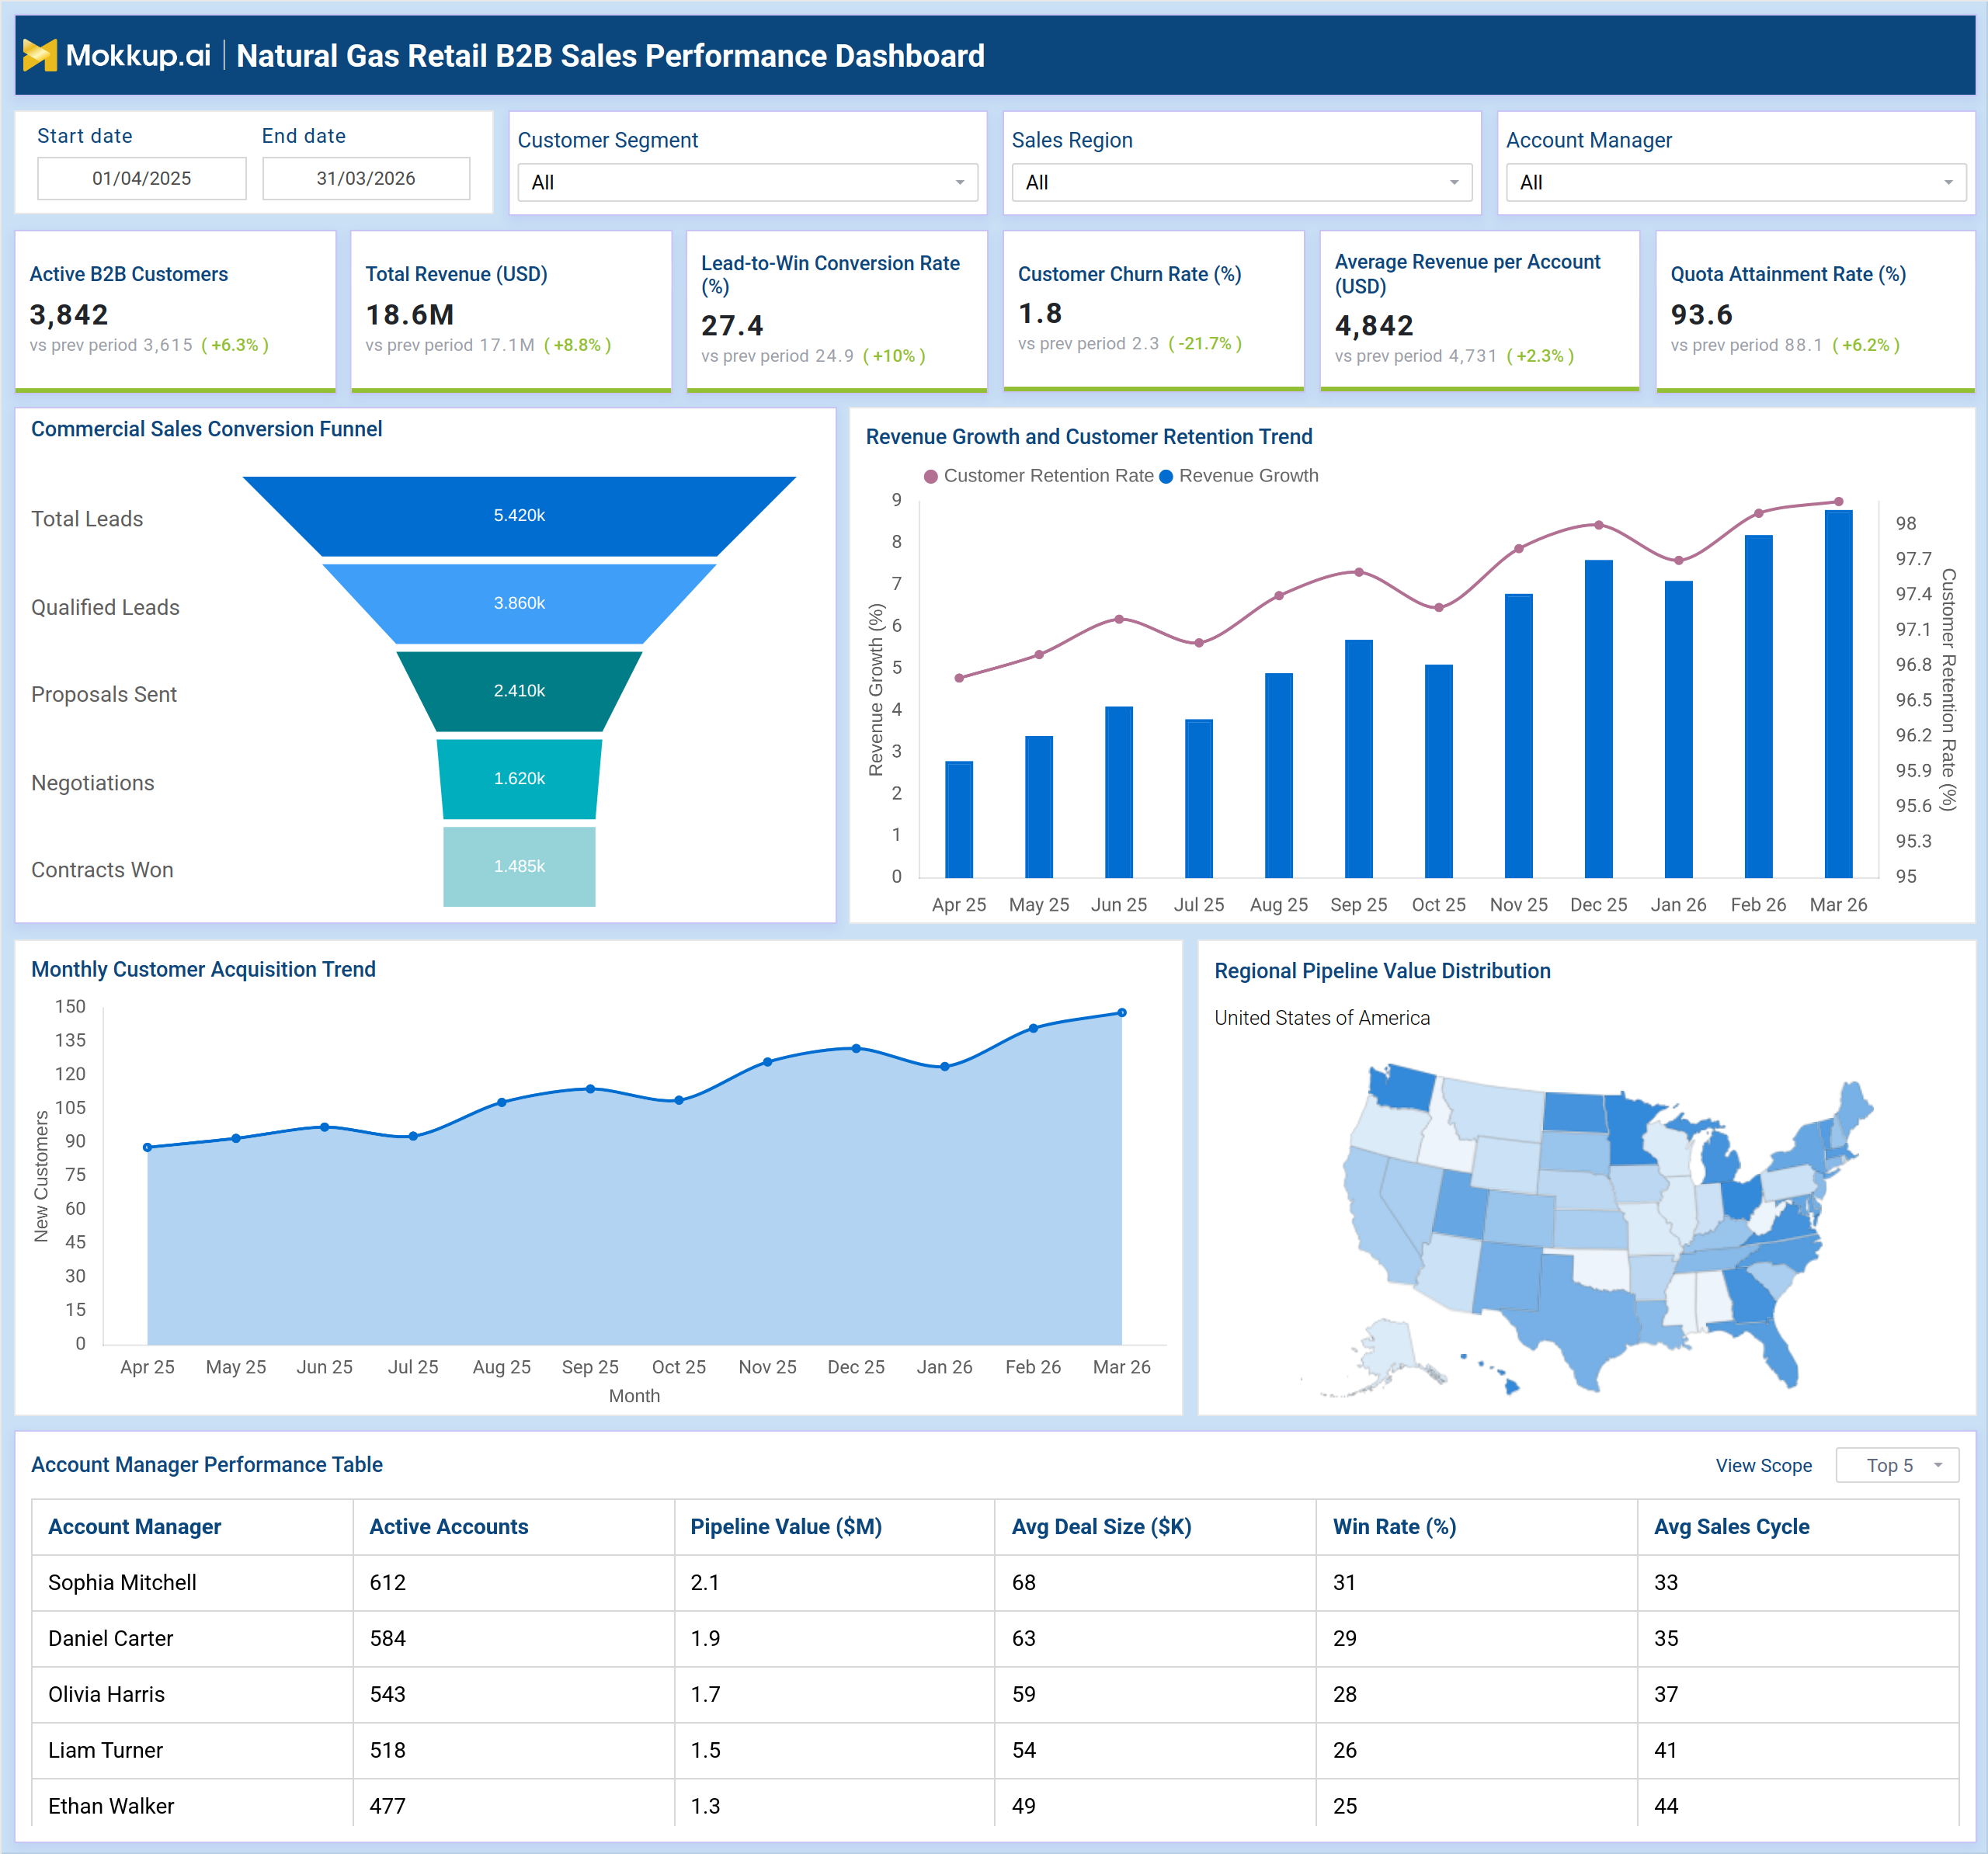
A commercial sales director at a natural gas retail company opens this dashboard at the start of the review cycle to understand how the team is tracking against targets. The top KPI row immediately surfaces whether revenue is on pace, how quota attainment tracking compares to the current period, and whether the lead-to-win rate is holding steady. With date range, segment, and region filters applied, the director can narrow the view to a specific territory without generating a separate report. Drilling down into the funnel, the team can identify exactly where in the sales cycle deals are stalling. B2B sales performance tracking at this level of granularity separates teams that hit targets consistently from those relying on end-of-quarter pushes.
Account managers use the performance table to benchmark their own results against peers. Commercial natural gas account management becomes measurable when active account counts, pipeline value, average deal size, win rates, and sales cycle lengths are visible side by side. Pipeline value monitoring across the choropleth map surfaces geographic concentration and underperforming territories where prospecting effort should increase. Leaders can track whether the customer churn rate in energy retail is rising before accounts lapse, and whether retention trends are aligned with revenue growth.
How to Analyze Data in a Natural Gas Retail B2B Sales Performance Dashboard
Here is how you can analyze data from this dashboard:
- Apply date range, segment, and region filters before reviewing any section to ensure data reflects the correct scope.
- Review the Commercial Sales Conversion Funnel to identify the stage with the highest drop-off rate.
- Track the dual-axis Revenue Growth and Customer Retention Trend chart to detect when retention starts diverging from revenue.
- Use the Monthly Customer Acquisition Trend to assess seasonality patterns and outreach effectiveness over time.
- Analyze the Regional Pipeline Value Distribution map to prioritize territories with the highest concentration of open deals.
- Benchmark account managers using the Performance Table across win rate, deal size, and sales cycle length.
- Use the Quota Attainment Rate KPI for quota attainment tracking and early identification of reps at risk of missing targets.
- Monitor Customer Churn Rate alongside Average Revenue per Account to flag declining account health before it impacts revenue.
Benefits of a Natural Gas Retail B2B Sales Performance Dashboard
The following are the benefits of using this dashboard:
- Provides a unified view of pipeline, conversion, and revenue performance without requiring multiple reporting tools.
- Supports commercial natural gas account management by surfacing per-rep productivity metrics in a sortable table.
- Enables territory planning decisions with geographic pipeline value distribution across regions.
- Reduces time spent in performance reviews by grounding every discussion in filterable, visible data.
- Supports pipeline value monitoring across account managers and regions to prioritize sales efforts correctly.
- Helps retention teams track customer churn rate in energy retail before accounts are lost.
- Enables quota attainment tracking for individual contributors and the full team within a single view.
KPIs to Track in a Natural Gas Retail B2B Sales Performance Dashboard
The following key KPIs can be tracked by using this dashboard:
- Active B2B Customers — total count of active commercial accounts in the current period, reflecting the health and size of the customer base.
- Total Revenue (USD) — aggregate revenue generated from B2B accounts within the selected date range and filters.
- Lead-to-Win Conversion Rate (%) — share of total leads that result in closed contracts, measuring end-to-end funnel efficiency.
- Customer Churn Rate (%) — percentage of B2B accounts lost in the period; a critical input for pipeline value monitoring and retention planning.
- Average Revenue per Account (USD) — mean revenue contribution per active B2B customer, indicating account quality and upsell performance.
- Quota Attainment Rate (%) — percentage of assigned revenue quota achieved in the period; the primary signal for quota attainment tracking across the team.
- Pipeline Value (M) — total estimated deal value in the active pipeline per account manager or region.
- Win Rate (%) — proportion of qualified opportunities converted to closed deals, benchmarked across account managers.
- Avg Deal Size (K) — average contract value per closed deal, useful for forecasting and territory planning.
- Customer Retention Rate — proportion of B2B customers retained across the period, tracked against revenue growth.
Frequently Asked Questions
1. What is the Natural Gas Retail B2B Sales Performance Dashboard used for?
This dashboard is designed for commercial sales teams in the natural gas retail sector to monitor pipeline health, conversion rates, and account performance. It supports both strategic planning and rep-level coaching through filterable, visual data.
2. Which teams benefit most from this dashboard?
Sales directors, account managers, and sales operations teams managing B2B customer portfolios in natural gas retail benefit most. It is particularly valuable for quota attainment tracking and B2B sales performance tracking across regions and segments.
3. Can this dashboard be filtered by region and account manager?
Yes. The dashboard includes filters for Sales Region, Customer Segment, and Account Manager. These filters apply across all charts and the performance table, enabling teams to compare results by territory or individual contributor.