What is a Biomass and Bioenergy B2B Sales, Margin & Cash Health Dashboard?
A Biomass and Bioenergy B2B Sales, Margin & Cash Health Dashboard is a centralized analytics solution designed for electric power utilities operating biomass and bioenergy plants. It consolidates sales performance, pricing realization, margin efficiency, and cash flow metrics into a single operational and financial view. This dashboard helps commercial, finance, and leadership teams monitor how revenue is generated across customer segments, contracts, plants, and regions while maintaining control over profitability and liquidity.
For utility executives and CFOs, this acts as a biomass energy executive financial dashboard that connects operational energy sales with financial outcomes. It supports informed decision-making by tracking revenue per kWh, net sales margins, receivables health, and customer churn. The dashboard also functions as a biomass power utility financial decision support system by aligning commercial execution with financial sustainability.
How to Create a Biomass and Bioenergy B2B Sales, Margin & Cash Health Dashboard
You don’t need to build your report from scratch, just start with a ready-to-use dashboard template from Mokkup. Add in your data and export it however you like. Here’s how to do it:
1. Create or Log in to Your Mokkup Account
Start by signing up on Mokkup.ai using your email. If you already have an account, just log in, and you’ll be good to go.
2. Choose and Customize Your Dashboard Template
Find the Biomass and Bioenergy B2B Sales, Margin & Cash Health Dashboard in the Templates section. Use the drag-and-drop editor to adjust KPIs, edit filters, or add elements based on your data.
3. Export to Your BI Tool
Once your dashboard wireframe is ready, use the BI Tool Export feature to send it directly to Power BI or Tableau for further analysis and enhancements. You can also download the dashboard as a PDF, PNG, or JPEG, embed it on a platform, or invite your team to collaborate.
Note: This is a Pro template. You’ll need a Pro subscription on Mokkup to use and customize this dashboard wireframe. Upgrade anytime to unlock full access.
Biomass and Bioenergy B2B Sales, Margin & Cash Health Dashboard Example
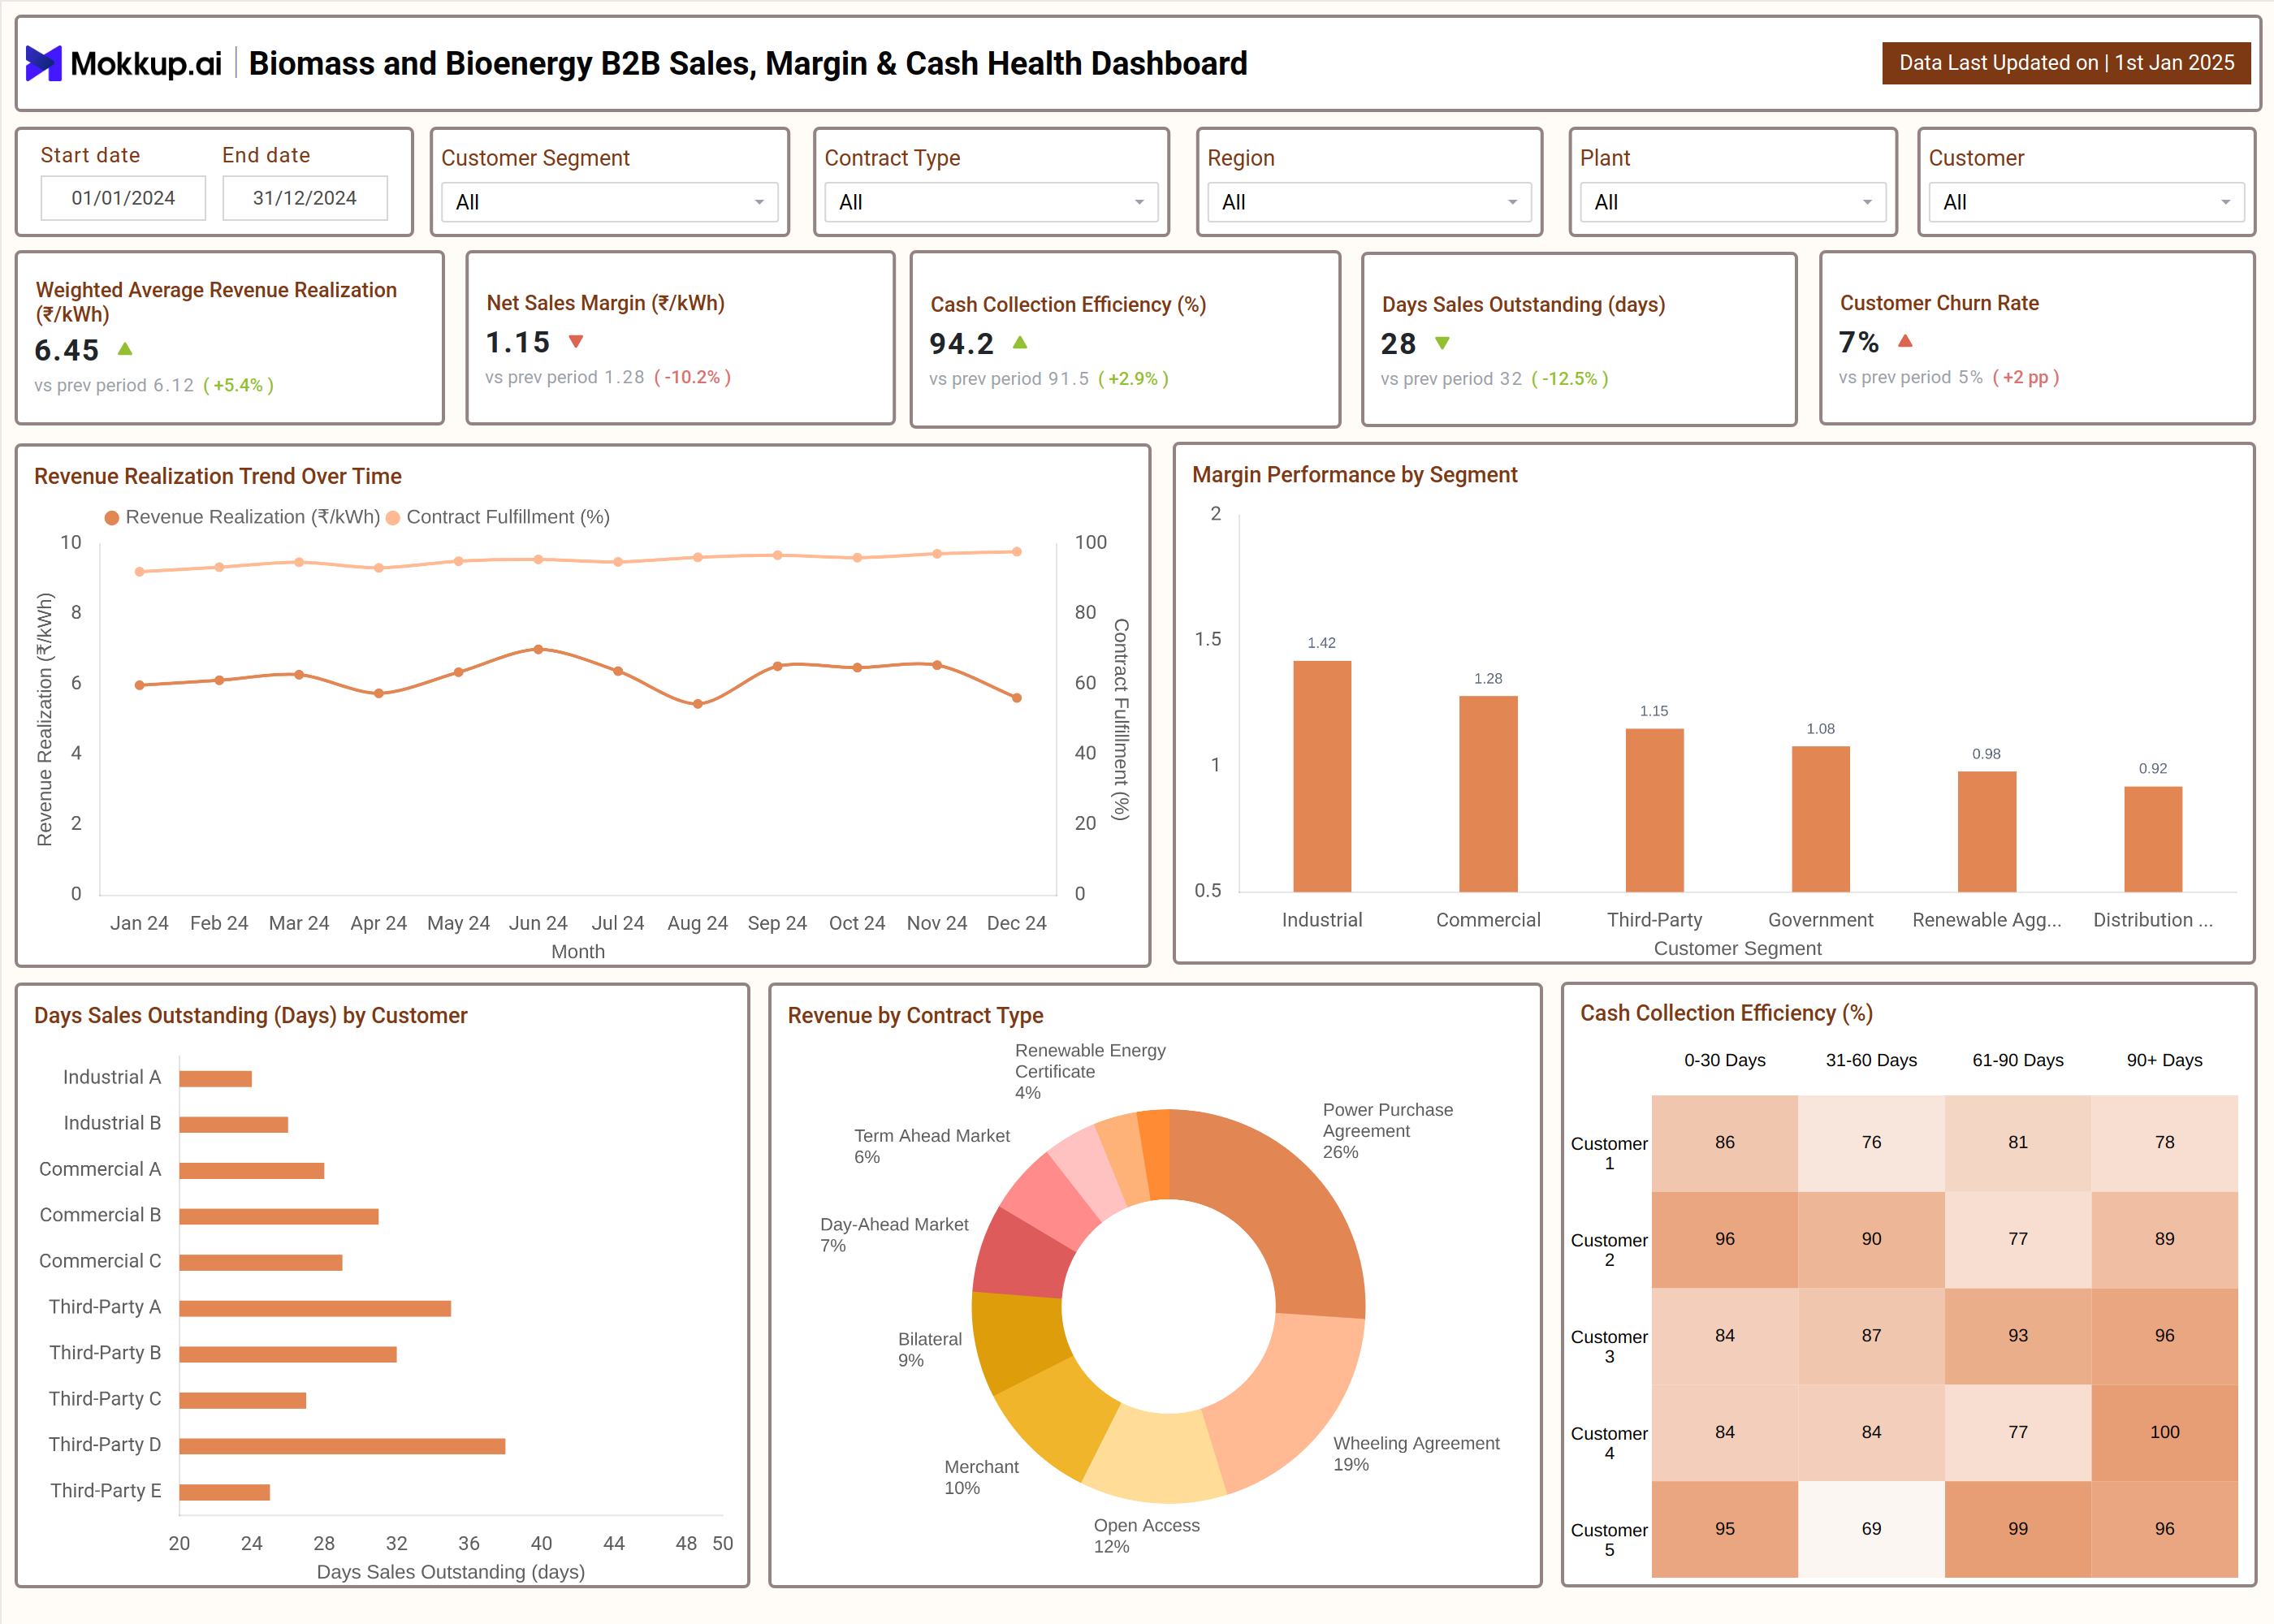
The dashboard example visualizes end-to-end financial performance for biomass and bioenergy utilities across a defined period. It begins with global slicers such as date range, customer segment, contract type, region, plant, and customer, allowing targeted financial analysis. Key performance indicators highlight weighted average revenue realization, net sales margin per kWh, cash collection efficiency, days sales outstanding, and customer churn rate.
Trend visuals track revenue realization against contract fulfillment over time, enabling utilities to identify pricing volatility or delivery gaps. Segment-based margin charts compare profitability across industrial, commercial, government, and aggregator customers. Supporting visuals include customer-level DSO analysis, revenue distribution by contract type, and aging-based cash collection heatmaps. Together, these visuals form a biomass energy B2B financial performance dashboard that supports revenue optimization, margin protection, and cash flow stability.
How to Analyze Data in Biomass and Bioenergy B2B Sales, Margin & Cash Health Dashboard
Here is how you can analyze data from this dashboard:
- Start with weighted average revenue realization to assess price effectiveness per kWh across contracts
- Compare net sales margin trends to identify cost pressure or unfavorable contract structures
- Monitor cash collection efficiency and DSO together to evaluate receivables performance
- Analyze margin performance by customer segment to prioritize high-value customers
- Review revenue by contract type to understand dependency on PPAs, open access, or merchant sales
- Use customer-level DSO analysis to flag delayed payments and credit risk
- Track churn rate alongside revenue trends to assess long-term customer stability
- Apply plant and region filters to isolate operational or market-specific issues
Benefits of Biomass and Bioenergy B2B Sales, Margin & Cash Health Dashboard
The following are the benefits of using this dashboard:
- Improves revenue visibility across biomass power generation sales performance analytics
- Acts as a biomass utility gross margin monitoring solution for proactive margin control
- Strengthens cash flow planning through receivables and aging insights
- Supports CFO-level oversight as a bioenergy utility CFO performance dashboard
- Reduces dependency on manual financial reporting and spreadsheets
- Enables faster corrective actions on pricing, contracts, and collections
- Enhances coordination between sales, finance, and operations teams
- Improves financial forecasting and budget accuracy for bioenergy utilities
KPIs to Track in Biomass and Bioenergy B2B Sales, Margin & Cash Health Dashboard
The following key KPIs can be tracked by using the Biomass and Bioenergy B2B Sales, Margin & Cash Health Dashboard:
- Weighted Average Revenue Realization (₹/kWh) - Average revenue earned per unit of electricity sold, weighted by total energy delivered.
- Net Sales Margin (₹/kWh) - Profit earned per unit of electricity after deducting operating and sales-related costs.
- Cash Collection Efficiency (%) - Percentage of billed revenue that has been successfully collected within the period.
- Days Sales Outstanding (DSO) - Average number of days taken to collect payment after a sale is billed.
- Customer Churn Rate (%) - Percentage of customers who stopped purchasing energy during the selected period.
- Contract Fulfillment Rate (%) - Percentage of contracted energy volume successfully delivered to customers.
- Revenue by Contract Type - Distribution of total revenue across different energy contract structures.
- Margin by Customer Segment - Comparison of profit margins generated by different customer categories.
- Aging wise Receivables Performance - Breakdown of outstanding receivables by payment delay time buckets.
- Customer Level Payment Delays - Measurement of payment delays for individual customers beyond agreed credit terms.
These KPIs collectively power bioenergy utility revenue margin, cash analytics, and ensure financial health across the sales lifecycle.
Frequently Asked Questions
1. Who should use this dashboard?
This dashboard is designed for CFOs, finance managers, commercial heads, and utility leadership managing biomass and bioenergy power generation businesses.
2. How does this dashboard help improve margins?
By comparing revenue realization with net sales margins across segments and contracts, utilities can identify underperforming deals and renegotiate pricing or cost structures.
3. Can this dashboard support executive decision making?
Yes. It functions as a biomass power utility financial decision support system by combining revenue, margin, and cash metrics in a single executive view.
4. Is this dashboard suitable for multi-plant operations?
Yes. Plant and region filters allow utilities to monitor performance at both consolidated and plant-specific levels.
5. How often should this dashboard be reviewed?
Finance and commercial teams should review it weekly or monthly, while executives can use it for periodic strategic reviews.