One of the biggest challenges of companies across the globe is customer retention. A lot of resources, hard work & planning go into bringing customers on board & customer attrition makes companies do the extra exercise of bringing new customers to fill the void alongside targeted expansion activities. A company needs to have a low churn rate because a high churn rate implies high attrition. Hence, a company with a high churn rate needs to spend money to bring new customers on board just to maintain the vacuum created by customers leaving the company. Hence, it is important to understand the churn rate because it impacts the profitability & growth of a company.
The dashboard wireframe comprises two screens, the Churn Analytics Dashboard, & the Customer Churn Dashboard, each of which is explained briefly below.
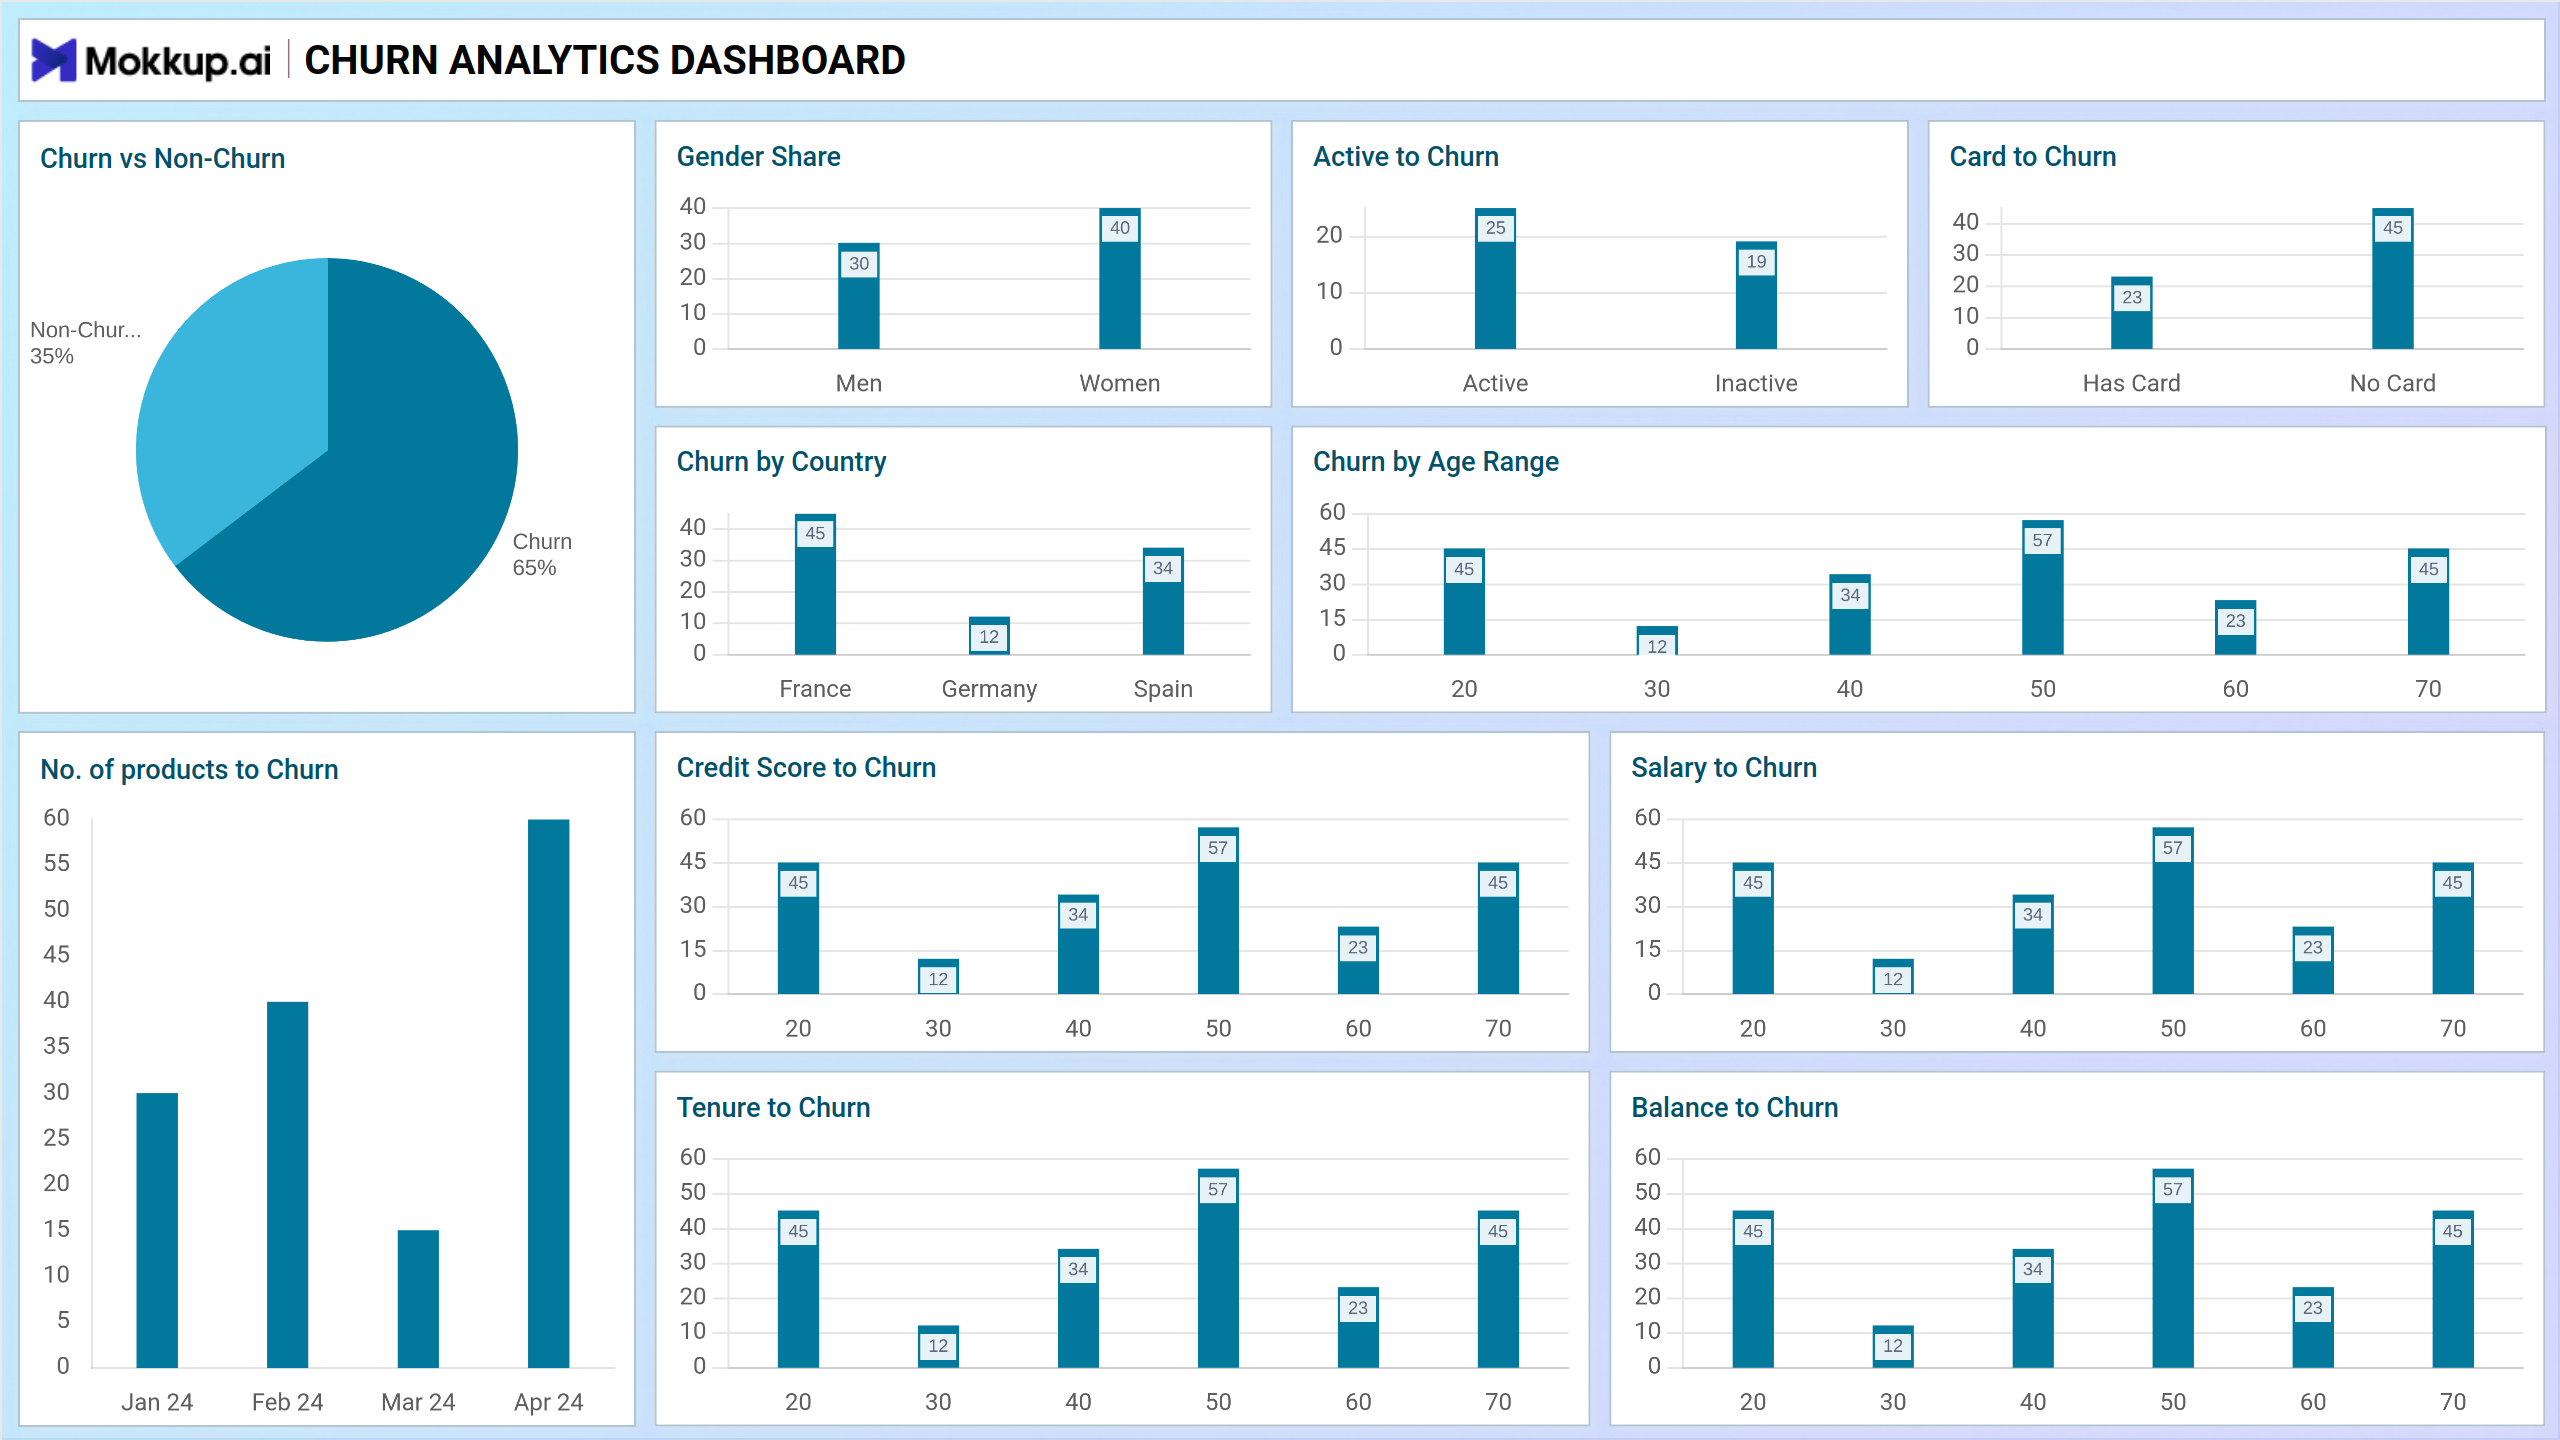
Churn Analytics Dashboard
This screen is the solution that can prevent this leakage of customer loss. It is useful for a company to compare churn rates with other competitors & see their performance in retaining customers compared to other companies in the same industry.
Key Terms to Know
- Churn Vs. Non-Churn: This metric shows the percentage of customers who churned compared to those who did not churn over a given period.
- No. of Products to Churn: This metric shows the average number of products purchased by customers who churned.
- Gender Share: This metric shows the percentage of male, female, and other customers who churned.
- Churn by Country: This metric shows the percentage of customers from each country who churned.
- Credit Score to Churn: This metric shows the average credit score of customers who churned.
- Tenure to Churn: This metric shows the average time customers who churned had been customers.
- Balance to Churn: This metric shows the average account balance of customers who churned.
- Salary to Churn: This metric shows the average salary of customers who churned.
- Churn by Age Range: This metric shows the percentage of customers from each age range who churned.
Customer Churn Dashboard
This screen offers businesses a comprehensive view of churn metrics, enabling proactive measures to retain customers. By analyzing the key indicators, businesses can identify at-risk customers and implement targeted retention strategies.
Key Terms to Know
- Retention Rate: Track the percentage of customers retained over a specified period, indicating the effectiveness of retention efforts.
- MRR: Monitor Monthly Recurring Revenue to understand revenue stability and identify trends in customer spending behavior.
- Customers by Status: Visualize the distribution of customers based on their current status (active, inactive, etc.) to assess overall customer health
- Churn Risk by Income: Analyze the likelihood of customer churn based on income levels, enabling targeted retention strategies for high-risk segments.
Dashboard Template Insights
This dashboard wireframe equips e-commerce businesses with invaluable insights into customer behavior, enabling proactive measures to mitigate churn and foster long-term loyalty. Below are key highlights of the dashboard wireframe:
- Identify churn risk factors early, enabling timely intervention and retention efforts.
- Visualize the financial impact of churn on MRR and customer lifetime value, highlighting its significance.
- Monitor the effectiveness of churn reduction strategies, measuring their impact on key churn metrics.
Conclusion
Churn Analytics is the solution for identifying customer attrition/churn reasons. It can pinpoint the underlying factors behind the churn & hence will provide the decision makers a direction to devise the strategy for reducing churn. This can be applied across a broad range of industries in an environment where increased competition has reduced the perceived differences in product offerings.
Frequently Asked Questions
Q1. How to calculate customer churn rate for e-commerce?
Churn rate is calculated by dividing the number of customers lost during a specific period by the total number of customers at the start of that period, then multiplying by 100 to get a percentage.
Q2. What are the main causes of e-commerce customer churn?
Common causes include poor customer service, lack of personalization, delayed deliveries, better offers from competitors, complicated return/refund processes, and lack of engagement post-purchase.
Q3. Best strategies to reduce online store customer churn?
Strategies include improving customer support, offering loyalty programs, sending personalized recommendations, optimizing delivery and returns, gathering feedback, and maintaining consistent engagement through email or social media.
Q4. How to identify at-risk customers before they leave?
At-risk customers can be identified by tracking reduced purchase frequency, declining engagement, negative feedback, abandoned carts, or reduced interaction with emails and campaigns. Predictive analytics and RFM segmentation can further highlight churn risks.
Q5. What metrics predict customer churn in e-commerce?
Key metrics include purchase frequency, average order value, time since last purchase, engagement rate with marketing campaigns, customer satisfaction scores (CSAT, NPS), and return/refund frequency.