
What is a Dialysis Centers Logistics Dashboard?
The Dialysis Centers Logistics Dashboard is a specialized healthcare operations tool designed to monitor and manage the logistical efficiency of dialysis centers. This dashboard combines equipment performance analytics, maintenance tracking, and supply chain utilization to ensure continuous patient care without operational disruption.
The dialysis logistics dashboard template provides an integrated view of machine utilization rates, preventive maintenance compliance, downtime analysis, consumable availability, and supplier delivery performance. By tracking these KPIs in real-time, healthcare administrators can minimize machine failures, prevent stockouts, and maintain a steady supply of dialysis consumables across all centers. This solution serves as a critical asset for hospital operations, providing actionable insights that balance resource usage, mitigate operational risks, and enhance patient treatment continuity.
How to Create a Dialysis Centers Logistics Dashboard
You don’t need to build your report from scratch—just start with a ready-to-use sample Dialysis Centers Logistics Dashboard template from Mokkup. Plug in your own data and export it however you like. Here’s how to do it:
1. Create or Log in to Your Mokkup Account
Start by signing up on Mokkup.ai using your email. Already have an account? Just log in, and you’re good to go.
2. Choose and Customize Your Dashboard Template
Find the Dialysis Centers Logistics Dashboard template in the Templates section. Use the drag-and-drop editor to adjust KPIs, edit filters, or add elements based on your data.
3. Export to Your BI Tool
Once your dashboard is ready, use the BI Tool Export feature to send it directly to Power BI or Tableau for further analysis and enhancements. You can also download the dashboard as a PDF, PNG, or JPEG, embed it on a platform, or invite your team to collaborate.
Note: This is a Pro template. To use and customize this dashboard wireframe, you’ll need a Pro subscription on Mokkup. Upgrade anytime to unlock full access.
Dialysis Centers Logistics Dashboard Example
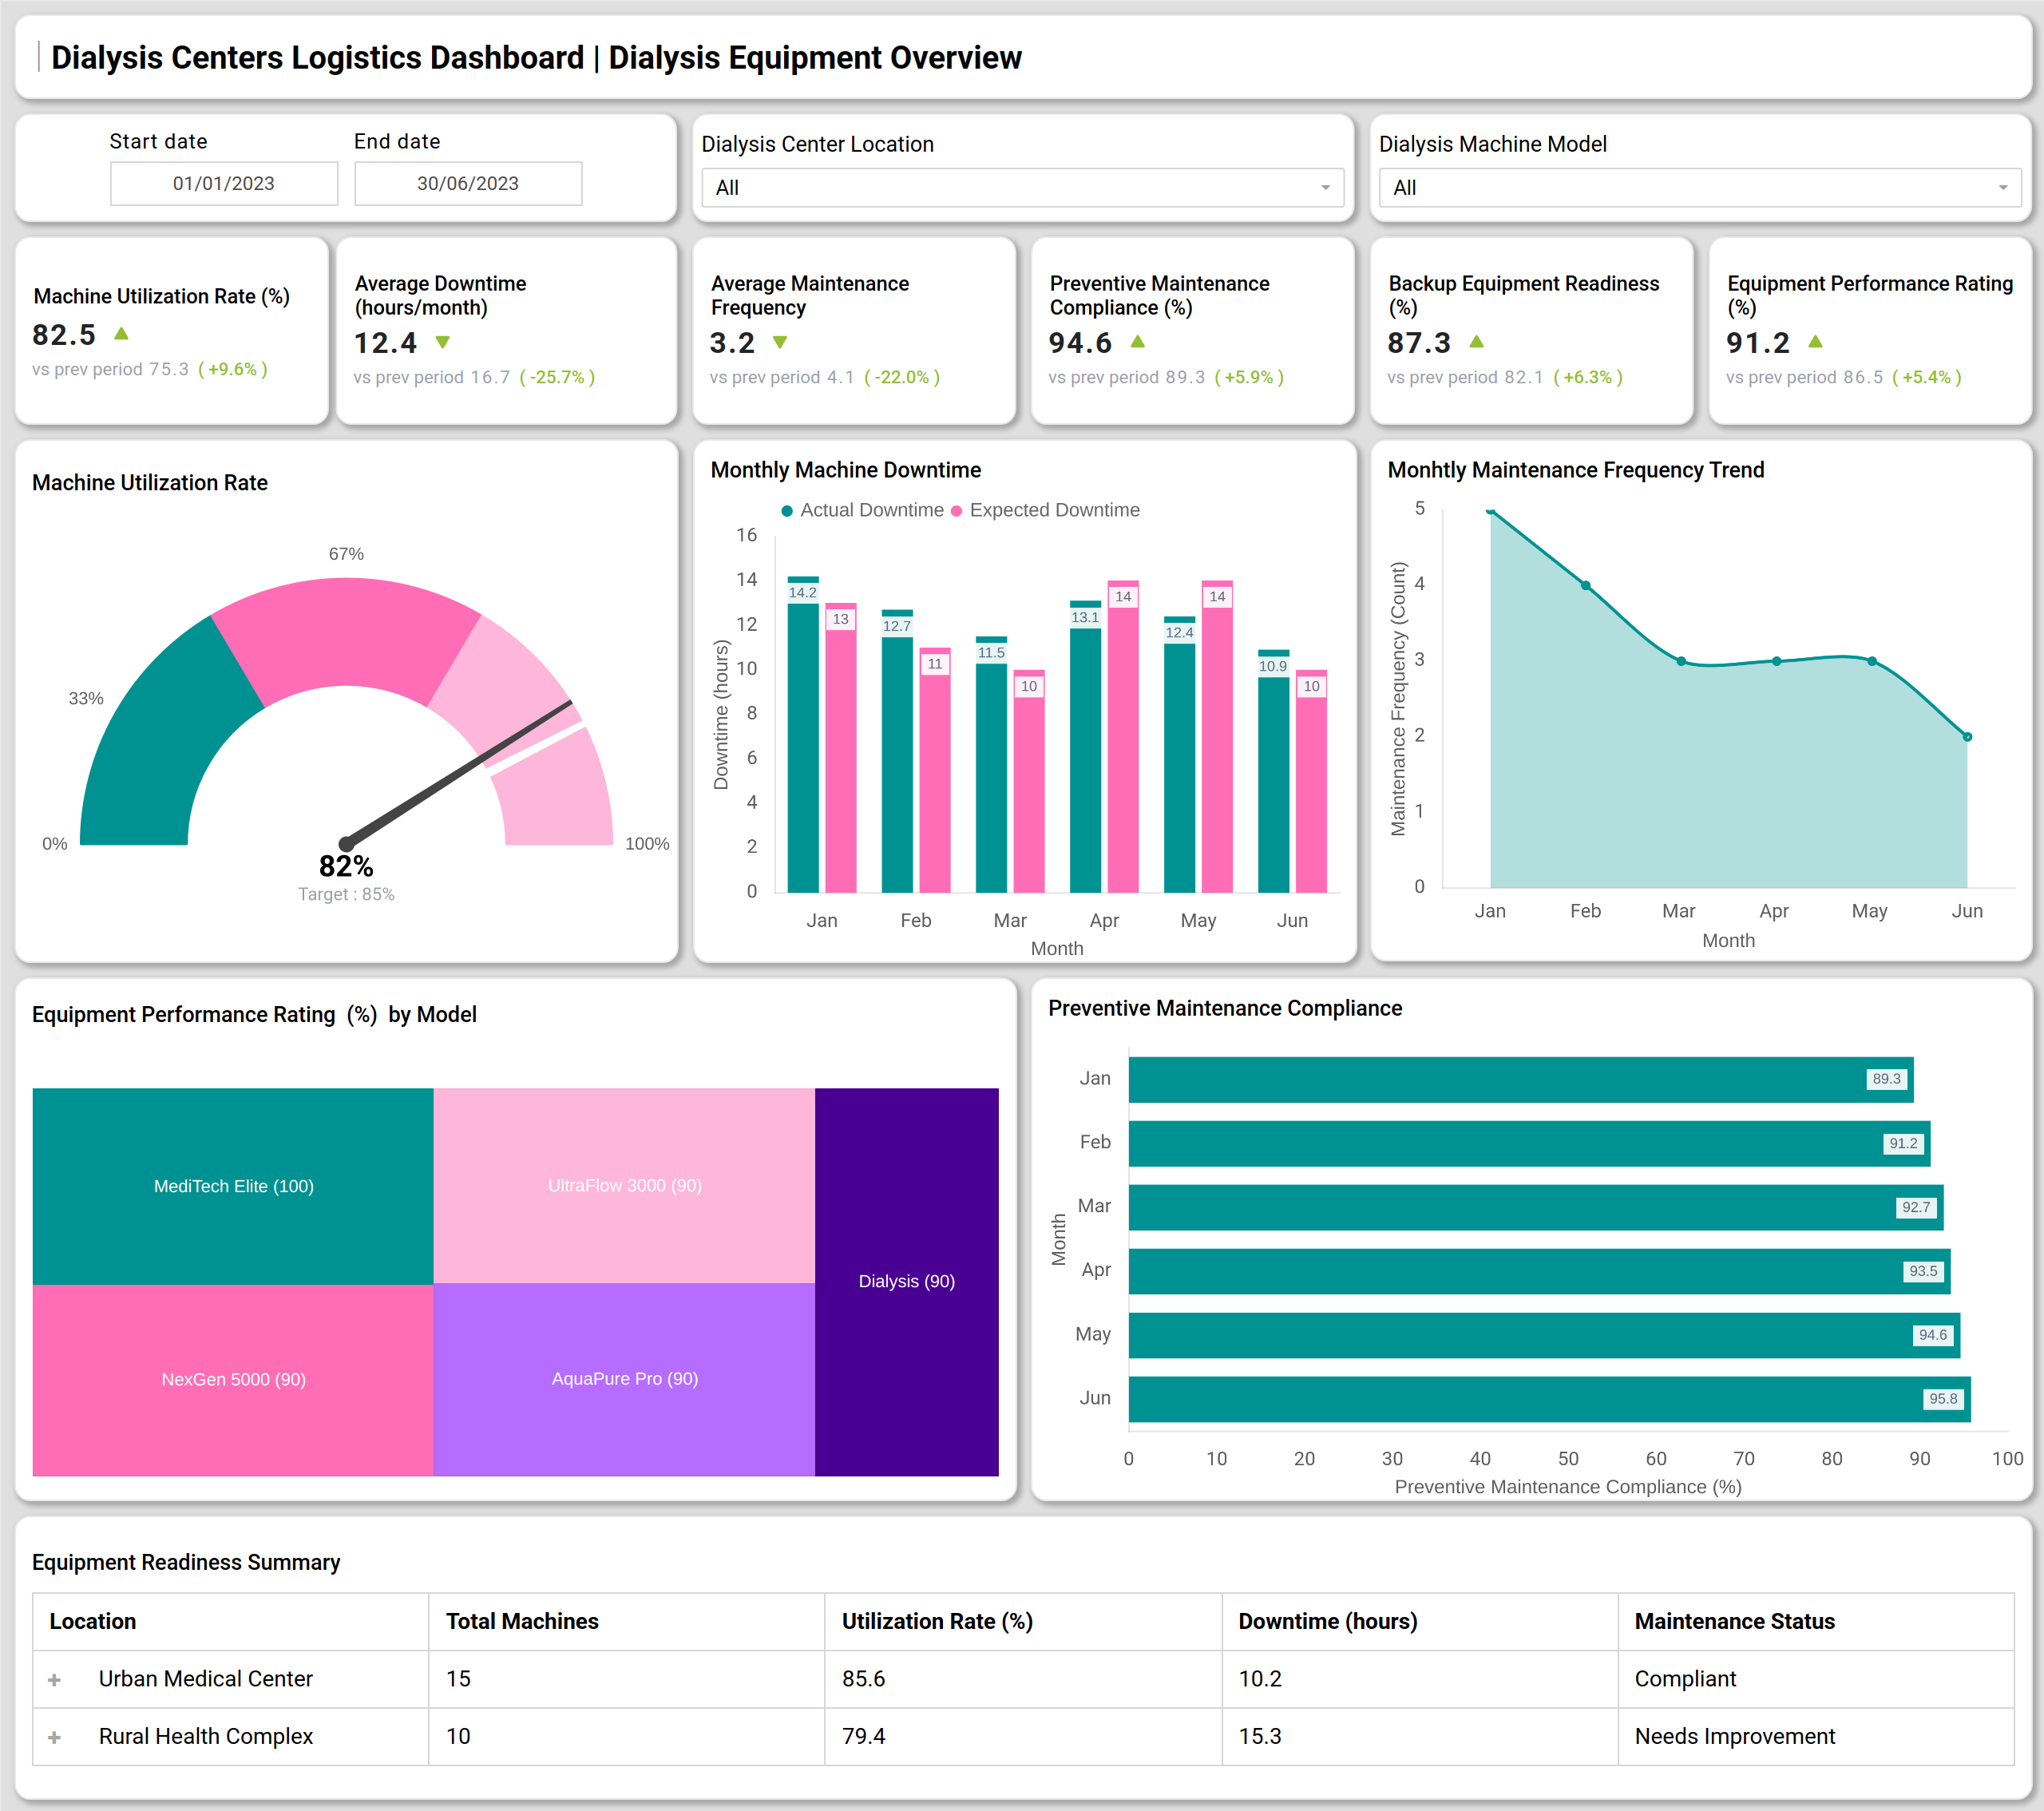
The Dialysis Centers Logistics Dashboard provides a comprehensive view of equipment efficiency and supply utilization across multiple centers. The Dialysis Equipment Overview tracks KPIs like Machine Utilization (82.5%), Average Downtime (12.4 hours), and Preventive Maintenance Compliance (94.6%), alongside performance comparisons by model and readiness summaries by location.
The Supply Utilization screen monitors consumables with metrics such as Availability (92.5%), Stockout Incidents (12), and Supplier On-Time Delivery (94.5%), supported by visual tools like replenishment funnels, consumption vs. stock charts, performance heatmaps, and delivery delay maps. Together, the dashboard helps managers optimize equipment use, maintain inventory, minimize delays, and improve patient outcomes. Overall, the Hospital Supply Chain Dashboard enables dialysis center managers to maintain seamless operations, minimize service delays, and enhance patient treatment outcomes for dialysis.
How to Analyze Data in Dialysis Logistics Dashboards
Here is how you can analyze data in Dialysis Supply Utilization Dashboard:
- Track Equipment Utilization Trends: Identify underperforming machines by comparing utilization and downtime.
- Monitor Preventive Maintenance Compliance: Ensure adherence to service intervals to reduce unexpected breakdowns.
- Analyze Supply Chain Efficiency: Evaluate supplier reliability and delivery timeliness.
- Assess Inventory Health: Balance consumable availability against usage trends to avoid stockouts.
- Optimize Multi-Center Operations: Compare equipment readiness and consumable stock levels across locations.
These insights help hospitals achieve higher operational efficiency and cost control while maintaining patient safety standards.
Benefits of Dialysis Centers Logistics Dashboard
These are the benefits of using Medical Equipment Maintenance Dashboard:
- Improved Equipment Reliability: Ensures timely maintenance and reduced machine downtime.
- Efficient Supply Chain: Tracks consumable availability and prevents dialysis session interruptions.
- Operational Transparency: Centralizes equipment and logistics data in one view.
- Cost Optimization: Reduces unnecessary overstocking and maintenance-related expenses.
- Enhanced Compliance: Monitors hygiene and maintenance protocols for regulatory adherence.
This Healthcare Logistics Dashboard Template ultimately enhances both operational consistency and patient service reliability across all dialysis centers.
KPIs to Track in Dialysis Centers Logistics Dashboards
The following are KPIs included in the Dialysis Equipment Dashboard:
- Machine Utilization Rate (%): Monitors how effectively dialysis machines are being used across centers, helping identify underutilized or overburdened equipment.
- Preventive Maintenance Compliance (%): Tracks adherence to scheduled maintenance tasks, ensuring timely servicing and extended machine lifespan.
- Backup Equipment Readiness (%): Evaluates the availability and readiness of backup dialysis machines to handle peak loads or unexpected breakdowns.
- Equipment Performance Rating (%): Assesses machine reliability and overall operational performance across different models or manufacturers.
- Monthly Stockout Incidents (count): Monitors how often consumables run out, helping logistics teams prevent inventory shortages.
- Reorder Lead Time (days): Tracks the average time required to restock critical consumables, supporting proactive inventory planning.
- Supplier On-Time Delivery (%): Measures supplier reliability in delivering materials on schedule, ensuring steady supply chain flow and reduced operational risk.
These KPIs form the foundation of data-driven dialysis operations management.
Frequently Asked Questions
1. What is the purpose of the Dialysis Centers Logistics Dashboard?
It helps dialysis centers monitor equipment performance, maintenance compliance, and supply chain efficiency to prevent service delays and maintain patient safety.
2. Who can use this dashboard?
Hospital logistics teams, biomedical engineers, maintenance managers, and operations directors can benefit from this dashboard.