
What is a Natural Gas Power Plant Load & Gas Usage Dashboard?
A Natural Gas Power Plant Load & Gas Usage Dashboard is a centralized system that visualizes real-time and historical insights related to load demand, gas consumption patterns, fuel efficiency, and forecast accuracy. It supports natural gas power plant load analysis by consolidating operational, fuel, and grid-related data into a single analytical interface. The dashboard helps operators track gas usage performance, predict consumption needs, and compare forecasted versus actual load to ensure stable and cost-efficient generation.
Because modern facilities rely heavily on gas consumption performance monitoring, this dashboard becomes a core part of plant-wide decision-making, especially in plants that also use a power plant fuel usage dashboard or energy generation and gas efficiency tools. It also supports combined cycle plant load tracking and integrates power plant thermal load analytics to enhance reliability, cost control, and operational transparency.
How to Create a Natural Gas Power Plant Load & Gas Usage Dashboard
You don’t need to build your report from scratch, just start with a ready-to-use dashboard template from Mokkup. Add in your data and export it however you like. Here’s how to do it:
1. Create or Log in to Your Mokkup Account
Start by signing up on Mokkup.ai using your email. If you already have an account, just log in, and you’ll be good to go.
2. Choose and Customize Your Dashboard Template
Find the Natural Gas Power Plant Load & Gas Usage Dashboard template in the Templates section. Use the drag-and-drop editor to adjust KPIs, edit filters, or add elements based on your data.
3. Export to Your BI Tool
Once your dashboard wireframe is ready, use the BI Tool Export feature to send it directly to Power BI or Tableau for further analysis and enhancements. You can also download the dashboard as a PDF, PNG, or JPEG, embed it on a platform, or invite your team to collaborate.
Note: This is a Pro template. You’ll need a Pro subscription on Mokkup to use and customize this dashboard wireframe. Upgrade anytime to unlock full access.
Natural Gas Power Plant Load & Gas Usage Dashboard Example
You can create a Natural Gas Power Plant Load & Gas Usage Dashboard that unifies fuel forecasting, load performance, and consumption behavior across all generating units. For example, the Natural Gas Demand Forecasting & Optimization Dashboard provides insights into monthly gas demand forecasts, fuel consumption deviation, heat rate trends, and storage days available. The Gas Consumption vs Forecast chart highlights whether actual consumption aligns with projected requirements, helping operators detect inefficiencies or abnormal variations.
The dashboard also displays gas source composition: LNG, pipeline gas, spot gas, and storage gas, allowing operators to evaluate cost impact and supply risk. Heat rate trend charts provide visibility into unit-wise thermal efficiency, helping teams improve energy generation and gas efficiency during peak and seasonal loads.
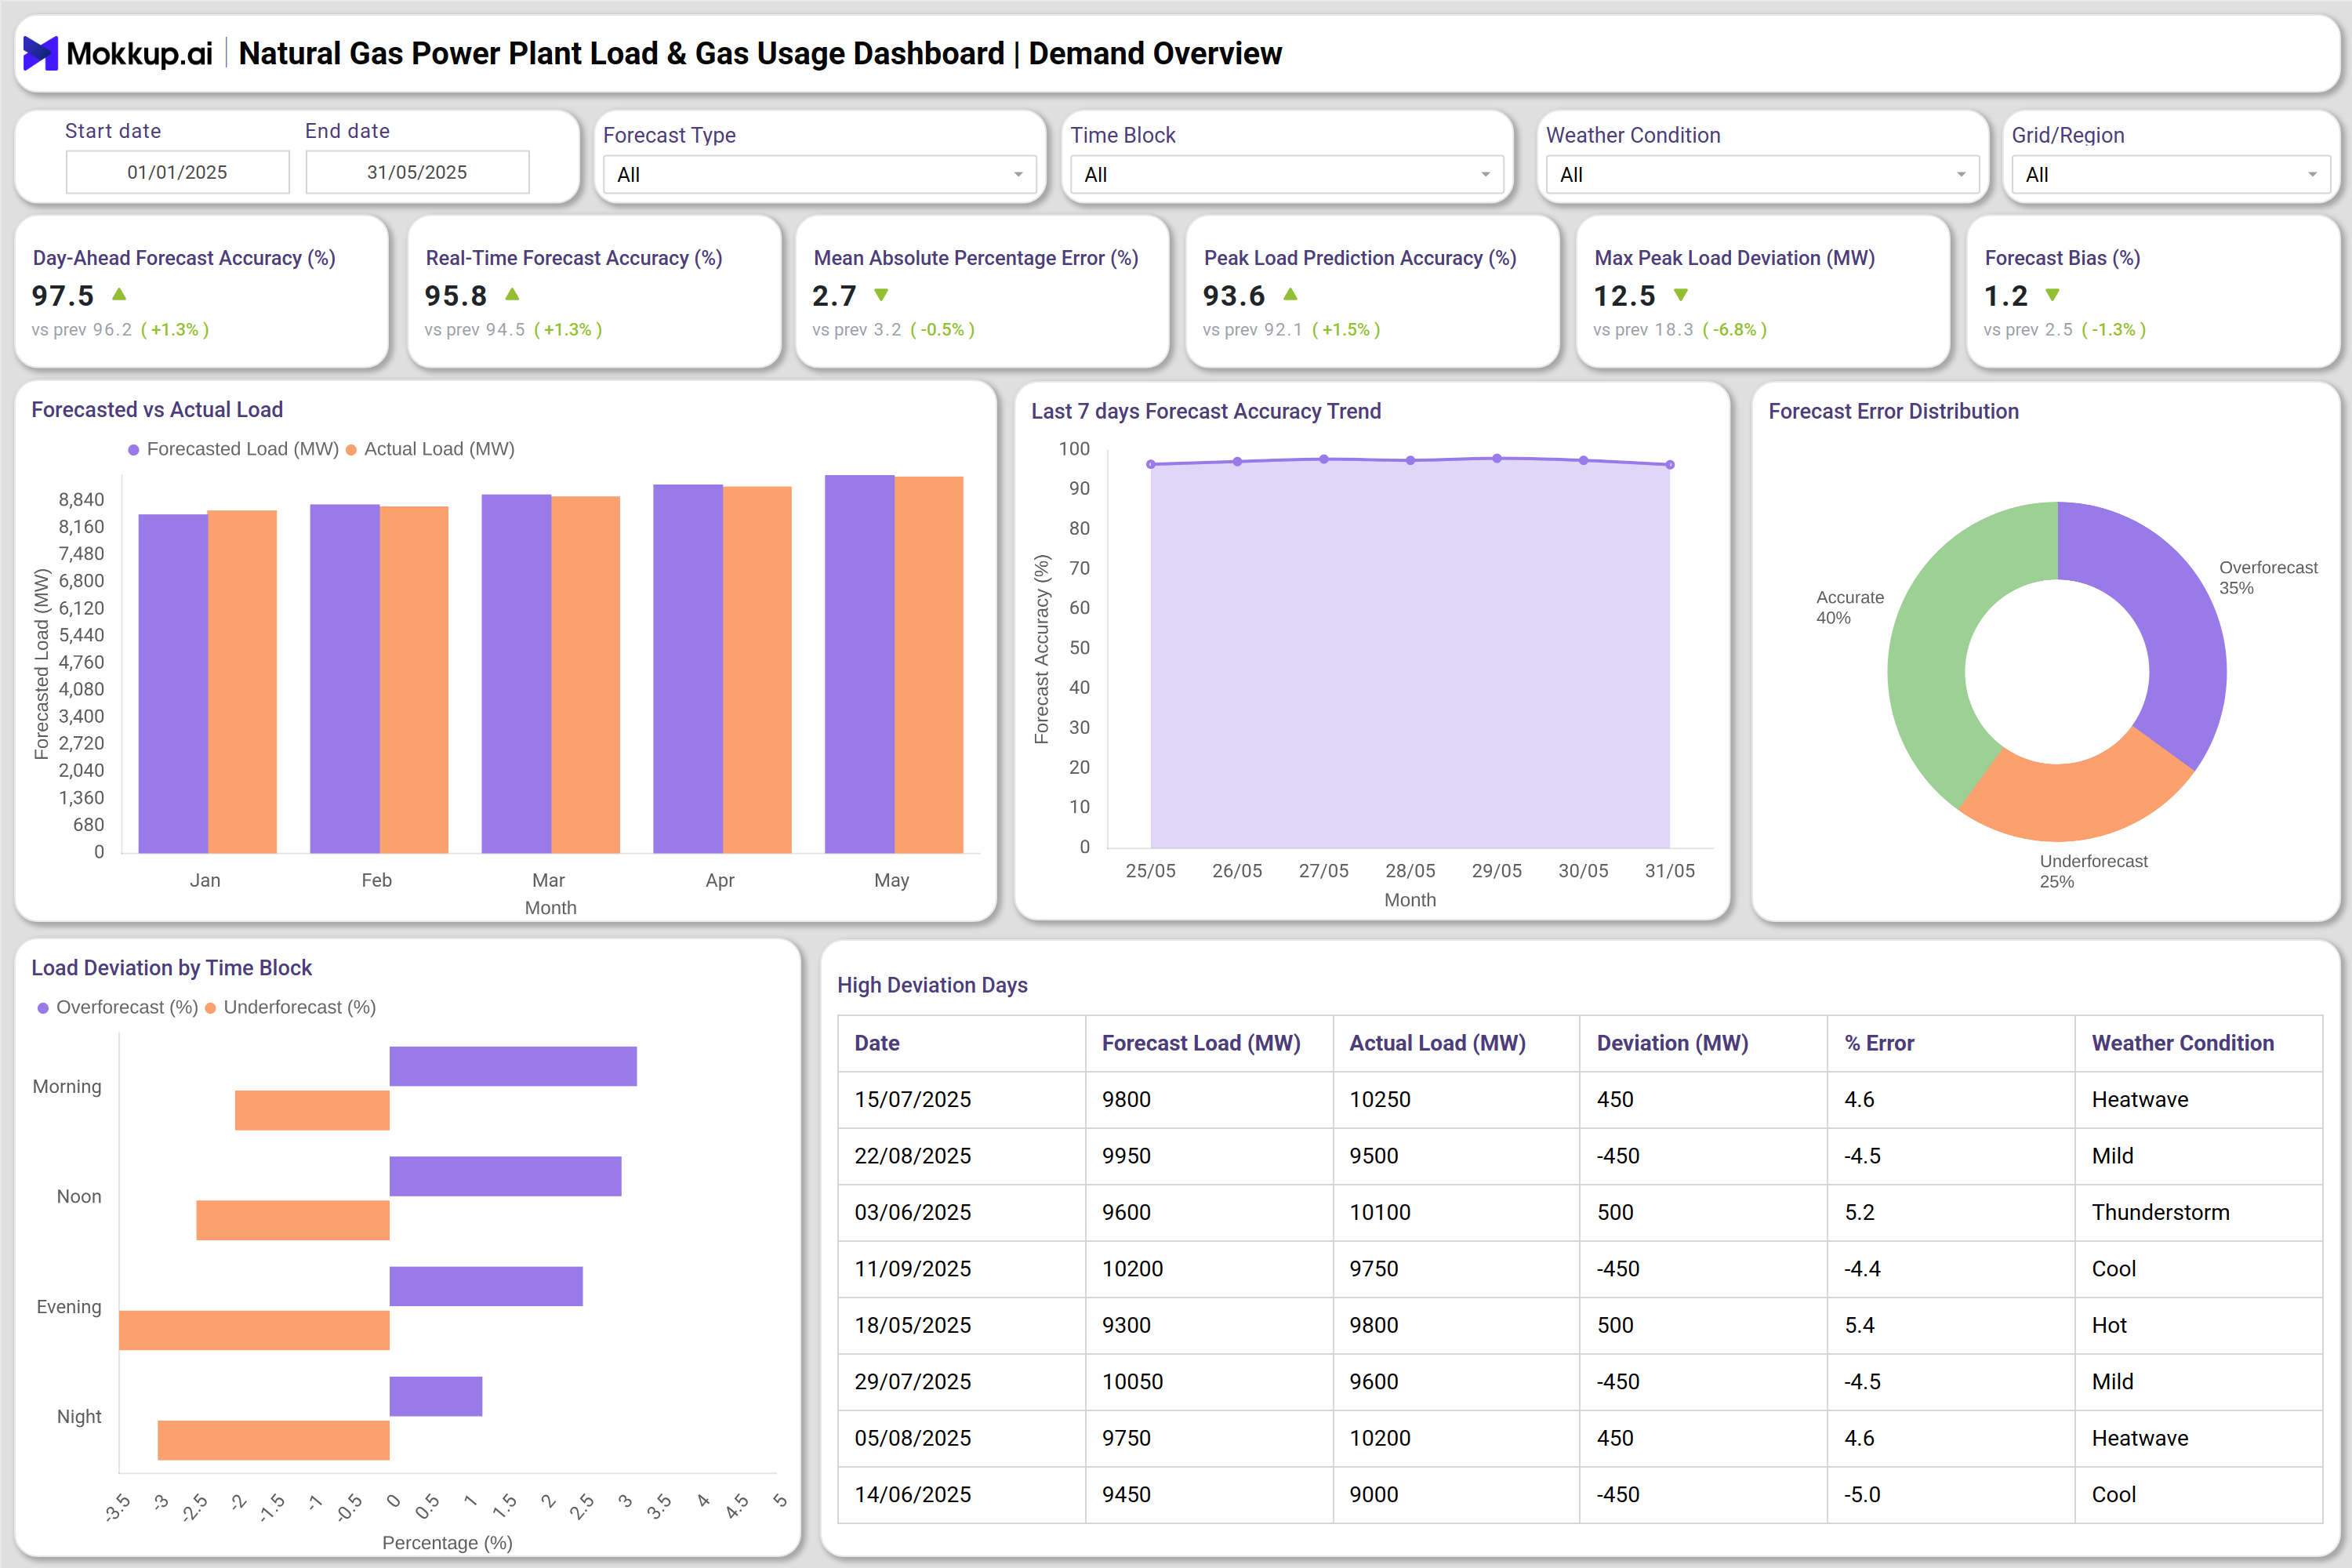
The Power Grid Load Forecast Performance Dashboard complements this by showing forecast accuracy, peak load deviations, and time-block deviations across morning, noon, evening, and night cycles. It includes weather-linked deviation analysis, which supports better planning during events such as storms or heatwaves. When integrated with broader systems such as natural gas power plant load analysis tools, gas consumption performance monitoring platforms, and combined cycle plant load tracking modules, this dashboard becomes a complete operational intelligence layer for fuel management and load optimization.
How to Analyze Data in a Natural Gas Power Plant Load & Gas Usage Dashboard
Here is how you can analyze data from this dashboard:
- Compare forecasted vs. actual gas consumption to determine accuracy and highlight abnormal consumption trends.
- Review heat rate trends to assess turbine thermal efficiency and identify potential degradation.
- Track unit-wise load variations to understand operational performance across different turbines.
- Monitor changes in gas source composition to assess cost impact and supply reliability.
- Evaluate forecast accuracy metrics (MAPE, peak load accuracy) to improve load prediction models.
- Assess fuel cost breakdown to identify commodity price exposure and transportation overheads.
- Analyze weather-linked deviation events to plan fuel scheduling and load balancing.
- Compare actual load vs. forecasted load for better grid coordination and dispatch planning.
Benefits of a Natural Gas Power Plant Load & Gas Usage Dashboard
The following are the benefits of using this dashboard:
- Improves accuracy in fuel procurement planning through advanced forecasting insights.
- Enhances gas consumption performance monitoring across units and load conditions.
- Reduces operational costs by optimizing heat rate and fuel efficiency.
- Minimizes supply disruptions by tracking gas source reliability.
- Strengthens grid coordination using precise load-forecast deviation analytics.
- Helps maintain stable generation during seasonal or weather-driven demand shifts.
- Increases transparency in fuel usage, storage availability, and real-time gas performance.
- Supports long-term scheduling and capacity planning for combined-cycle and open-cycle power plants.
KPIs to Track in a Natural Gas Power Plant Load & Gas Usage Dashboard
The following key KPIs can be tracked by using this dashboard:
- Average Monthly Gas Demand Forecast (MMBTU): Estimates expected gas requirements for upcoming months.
- Fuel Consumption Deviation (%): Shows variance between planned and actual gas usage.
- Average Plant Heat Rate (kCal/kWh): Measures fuel efficiency and turbine thermal performance.
- Fuel Cost per MWh (₹): Indicates the cost of generating each MWh of electricity.
- Gas Supply Reliability (%): Tracks the consistency and dependability of gas supply sources.
- Storage Days Available (days): Indicates the duration for which the plant can operate using stored gas.
- Forecast Accuracy (%): Measures the alignment between predicted and actual grid load.
- Peak Load Prediction Accuracy (%): Evaluates how well peak demand was forecasted.
- Load Deviation by Time Block (%): Captures variations by morning, noon, evening, and night cycles.
- Gas Source Composition (%): Displays the share of LNG, pipeline, spot, and storage gas.
- Actual Gas Used vs. Forecasted Gas (MMBTU): Highlights accuracy of gas consumption planning.
- Unit-wise Load Profile (MW): Shows how each unit contributes to total load.
Frequently Asked Questions
1. Who uses a Natural Gas Power Plant Load & Gas Usage Dashboard?
Operations teams, fuel planners, grid coordinators, and energy analysts use it to track gas performance and load reliability.
2. How does this dashboard improve forecasting accuracy?
It combines load history, gas consumption trends, and weather patterns to refine prediction models.
3. Does it support multi-unit or multi-turbine operations?
Yes, it visualizes performance across multiple units and turbines for complete plant-wide transparency.
4. Can this dashboard reduce operational costs?
Yes, by improving fuel efficiency, minimizing deviations, and optimizing thermal performance.