
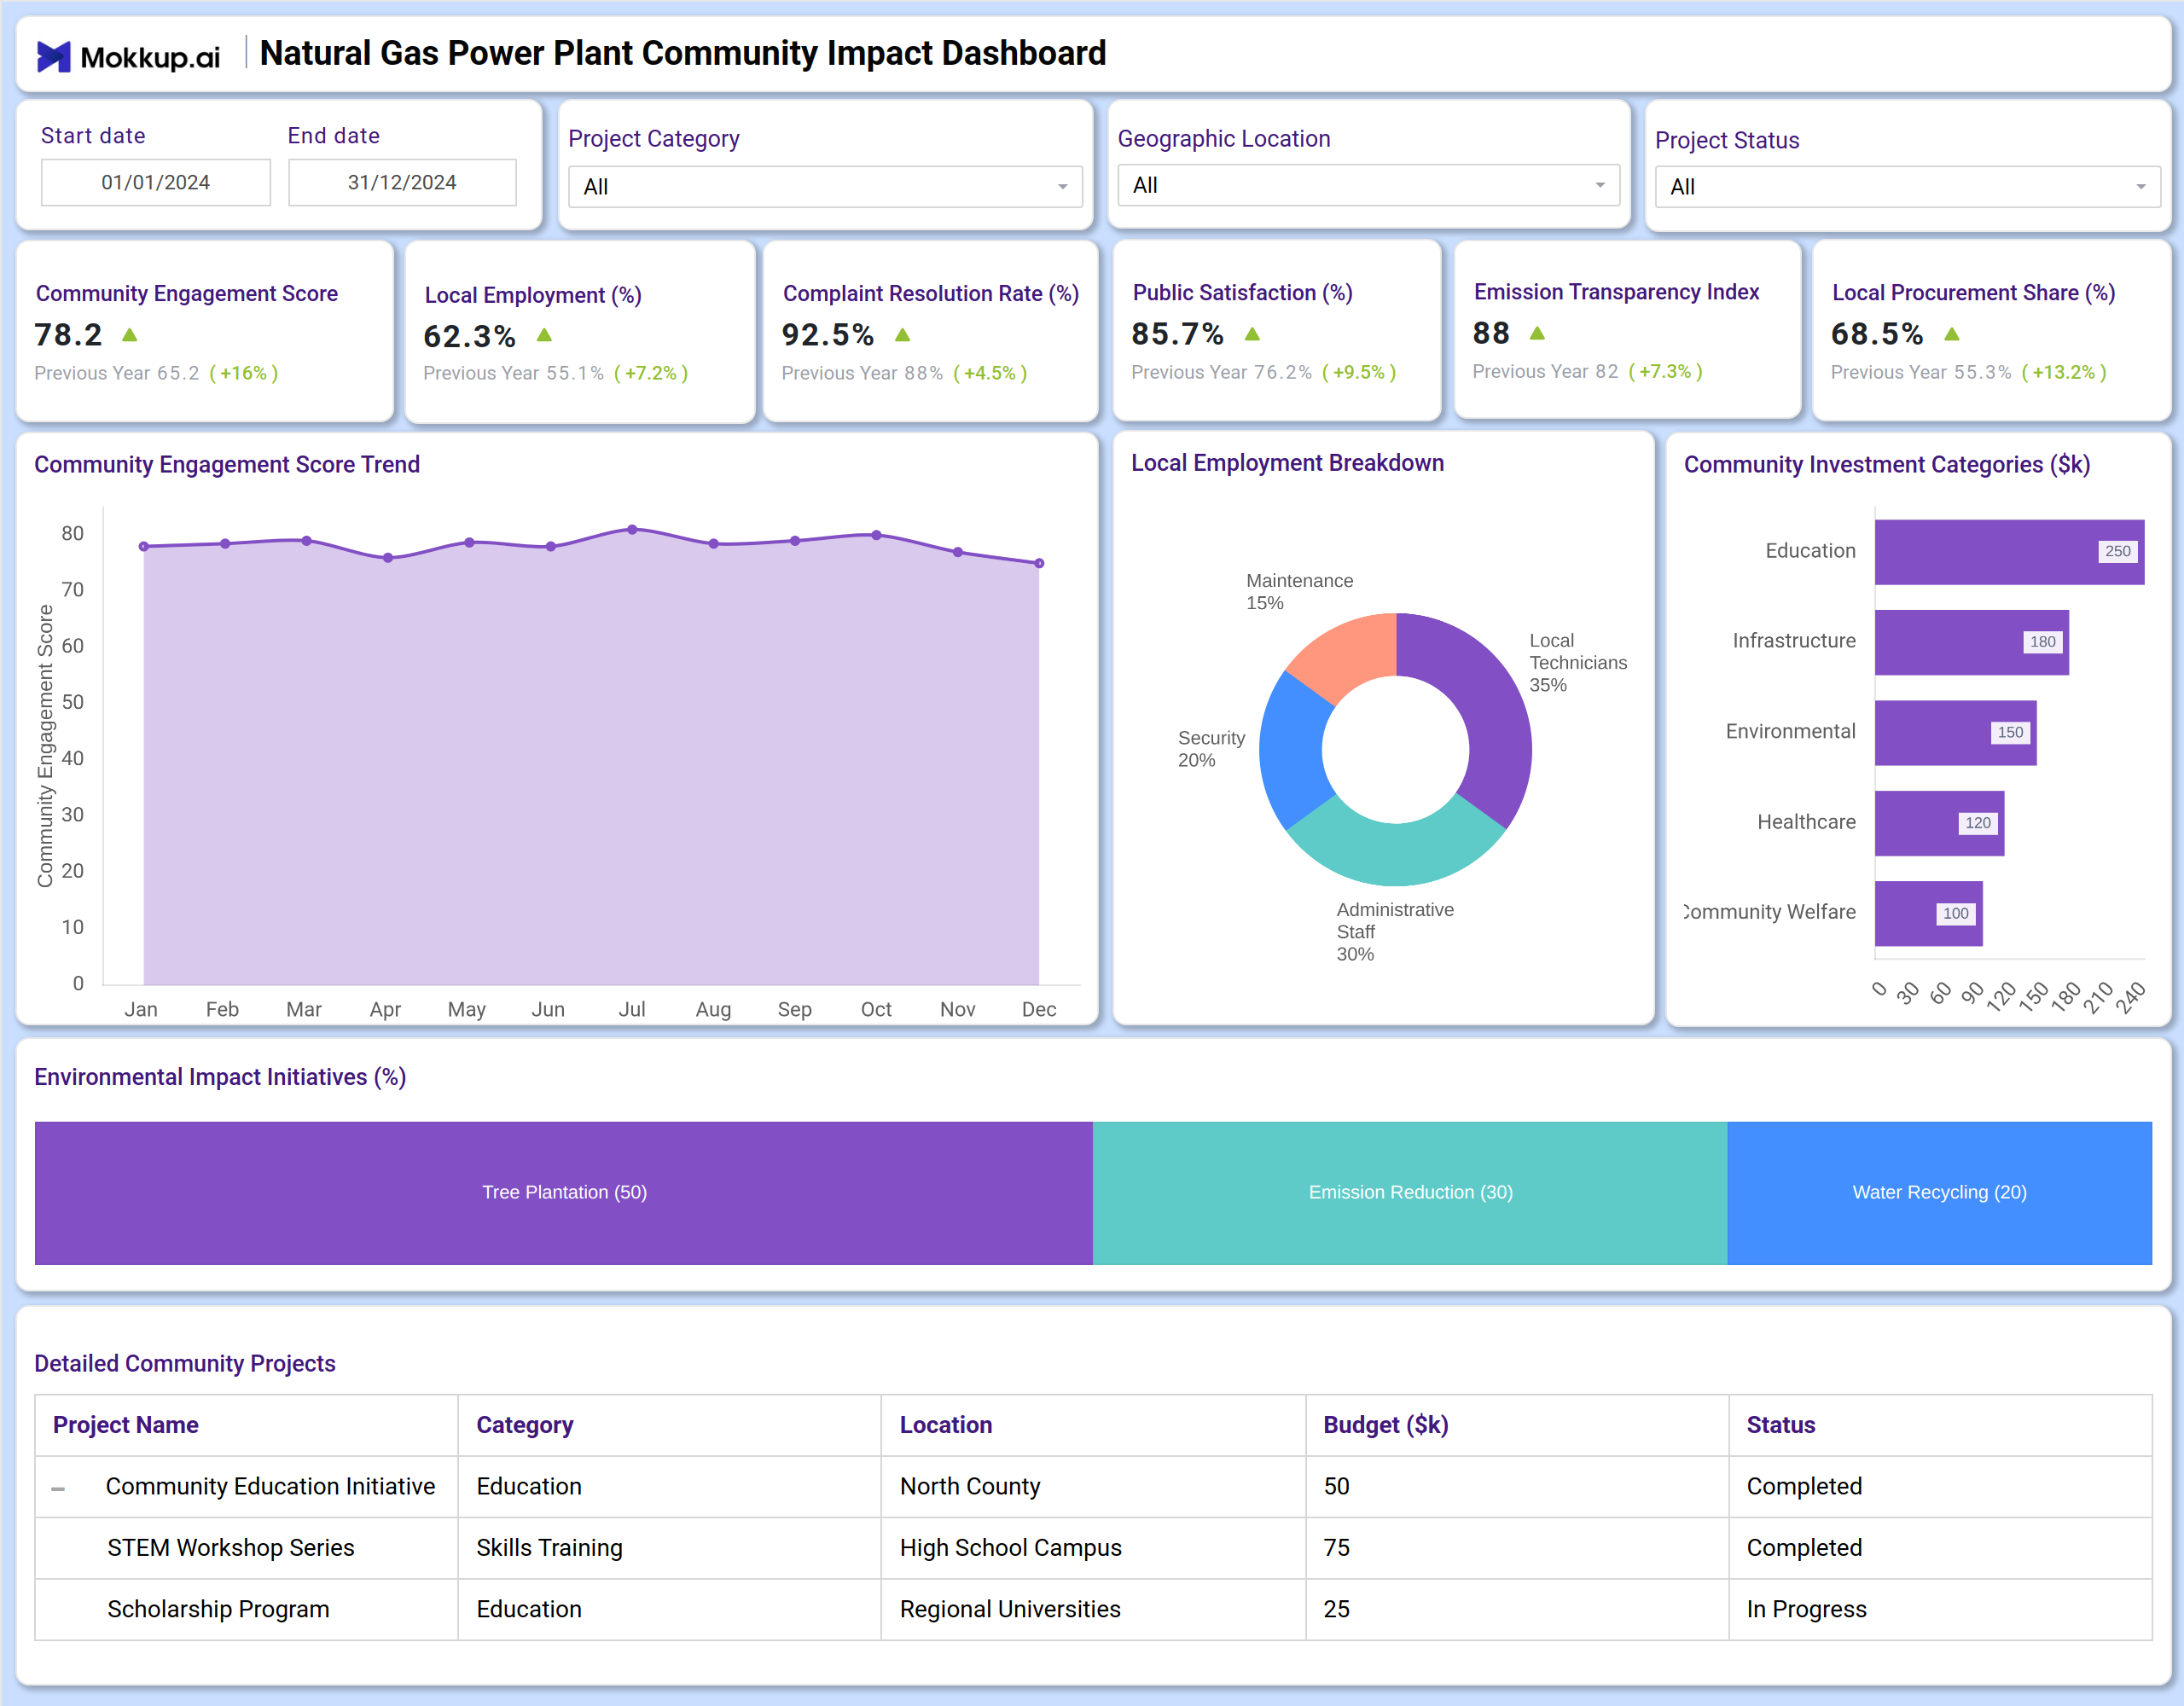
What is a Natural Gas Power Plant Community Impact Dashboard?
A Natural Gas Power Plant Community Impact Dashboard is a strategic tool designed for plant managers, corporate social responsibility (CSR) leads, public affairs teams, and community relations managers. It provides a clear and concise overview of the plant’s social, economic, and environmental contributions to the local community. This dashboard helps track key performance indicators such as local employment, public satisfaction, complaint resolution, emissions transparency, and community investment. Unlike traditional static reports, this dashboard offers an at-a-glance view of how the plant is performing against its community and sustainability goals, making it easier to communicate impact and align operations with social responsibility.
How to Create a Natural Gas Power Plant Community Impact Dashboard
You don’t need to design your dashboard from scratch—simply start with a ready-to-use Natural Gas Power Plant Community Impact Dashboard template from Mokkup. Customize it with your own metrics and export it in your preferred format. Here’s how:
1. Create or Log in to Your Mokkup Account
Sign up on Mokkup.ai using your email address. Existing users can log in directly to get started.
2. Choose and Customize Your Dashboard Template
Navigate to the Templates section and select the Natural Gas Power Plant Community Impact Dashboard. Use the intuitive drag-and-drop editor to modify KPIs, adjust filters, or add new elements based on your plant’s data.
3. Export to Your Preferred Format
Once your dashboard wireframe is finalized, you can export it as a PDF, PNG, or JPEG for reports or presentations. You can also invite team members to collaborate or embed the dashboard on internal platforms for broader visibility.
Note: This is a Pro template. A Mokkup Pro subscription is required to access and customize this dashboard wireframe.
Natural Gas Power Plant Community Impact Dashboard Example
A Natural Gas Power Plant Community Impact Dashboard typically includes a combination of KPI scorecards and visualizations. At the top, key metric tiles display the Community Engagement Score, Local Employment Percentage, Complaint Resolution Rate, Public Satisfaction, Emission Transparency Index, and Local Procurement Share. Below, charts illustrate trends in community engagement over time, a breakdown of local employment roles, and the distribution of community investments across categories like education, infrastructure, and environmental initiatives. This layout enables leadership to quickly assess social performance and environmental stewardship, making it the most effective community impact dashboard for natural gas power plants.
How to Analyze Data in Natural Gas Power Plant Community Impact Dashboards
Here’s how plant operators and CSR teams can leverage the dashboard for meaningful insights:
- Monitor community sentiment: Track the Community Engagement Score and Public Satisfaction percentage to gauge local perception.
- Evaluate employment impact: Review Local Employment Breakdown to understand job distribution across maintenance, security, and administrative roles.
- Assess responsiveness: Use the Complaint Resolution Rate to measure the effectiveness of addressing community concerns.
- Track environmental transparency: Follow the Emission Transparency Index to ensure open communication about environmental performance.
- Review local economic support: Analyze the Local Procurement Share to see how much spending stays within the local economy.
- Measure investment distribution: Use the Community Investment chart to ensure funds are allocated effectively across education, infrastructure, environmental projects, healthcare, and more.
Benefits of Natural Gas Power Plant Community Impact Dashboards
The following are some of the benefits of using the Best community impact dashboard for natural gas power plants:
- Enhanced community trust: Transparent reporting on employment, satisfaction, and environmental impact builds stronger local relationships.
- Informed decision-making: Clear KPIs help leadership prioritize community initiatives and allocate resources effectively.
- Regulatory and stakeholder alignment: Serves as a community impact reporting dashboard for natural gas plants, supporting compliance and effective stakeholder communications.
- Performance tracking: Compare current and previous year metrics to measure progress and identify areas for improvement.
- Strategic investment planning: Visualize community spending to ensure it aligns with local needs and corporate values.
Together, these elements help plant leadership maintain a social license to operate while demonstrating tangible community benefits. That’s why many industry professionals refer to it as the top natural gas plant community dashboard for managing social and environmental accountability.
KPIs to Track in Natural Gas Power Plant Community Impact Dashboards
- Community Engagement Score: Measures the overall level of interaction and trust between the plant and the community.
- Local Employment (%): Tracks the percentage of the plant’s workforce hired from the local area.
- Complaint Resolution Rate (%): Shows the percentage of community complaints resolved satisfactorily.
- Public Satisfaction (%): Reflects the level of satisfaction among local residents with the plant’s operations.
- Emission Transparency Index: Indicates how openly the plant shares emission data and environmental performance.
- Local Procurement Share (%): Measures the percentage of plant procurement spending directed to local businesses.
- Community Investment by Category: Tracks financial contributions to education, infrastructure, environmental projects, healthcare, and other local initiatives.
Frequently Asked Questions
1. Who should use a Natural Gas Power Plant Community Impact Dashboard?
Plant managers, CSR officers, public relations teams, and sustainability leads are responsible for community relations and environmental reporting.
2. Can this dashboard help improve community relations?
Yes. By tracking satisfaction, engagement, and complaint resolution, plant management can proactively address issues and strengthen local trust.
3. How does the dashboard support environmental accountability?
It highlights emission transparency and environmental investments, helping plants demonstrate their commitment to sustainable operations.
4. Is this dashboard useful for reporting to regulators or investors?
Absolutely. It serves as a natural gas plant community impact and transparency dashboard, providing structured data for compliance, annual reports, and stakeholder reviews.