
What is a Natural Gas Power Plant Carbon Footprint Dashboard?
A Natural Gas Power Plant Carbon Footprint Dashboard is a centralized monitoring system that tracks greenhouse gas performance, resource usage, pollution compliance, and waste handling across natural gas-fired plants. It provides sustainability analytics that highlight how a plant is contributing to carbon reduction targets while maintaining operational efficiency.
With stricter regulations in the Utilities sector and increased public scrutiny, operators require transparent oversight of CO₂, methane, NOx, SOx, PM, water, and solid waste handling. This type of emission tracking dashboard for gas turbine power generation enables facilities to understand how fuel combustion affects total GHG output, carbon intensity, and air quality compliance. It connects operational activity with environmental impacts, helping sustainability teams meet internal benchmarks and regulatory limits. For natural gas electricity producers transitioning toward cleaner generation, this dashboard supports strategic planning and reporting with traceable metrics and clear emission insights.
How to Create a Natural Gas Power Plant Carbon Footprint Dashboard
You don’t need to build your report from scratch—just start with a ready-to-use dashboard template from Mokkup. Add in your data and export it however you like. Here’s how to do it:
1. Create or Log in to Your Mokkup Account
Start by signing up on Mokkup.ai using your email. If you already have an account, just log in, and you’ll be good to go.
2. Choose and Customize Your Dashboard Template
Find the Natural Gas Power Plant Carbon Footprint Dashboard template in the Templates section. Use the drag-and-drop editor to adjust KPIs, edit filters, or add elements based on your data.
3. Export to Your BI Tool
Once your dashboard wireframe is ready, use the BI Tool Export feature to send it directly to Power BI or Tableau for further analysis and enhancements. You can also download the dashboard as a PDF, PNG, or JPEG, embed it on a platform, or invite your team to collaborate.
Note: This is a Pro template. You’ll need a Pro subscription on Mokkup to use and customize this dashboard wireframe. Upgrade anytime to unlock full access.
Natural Gas Power Plant Carbon Footprint Dashboard Example
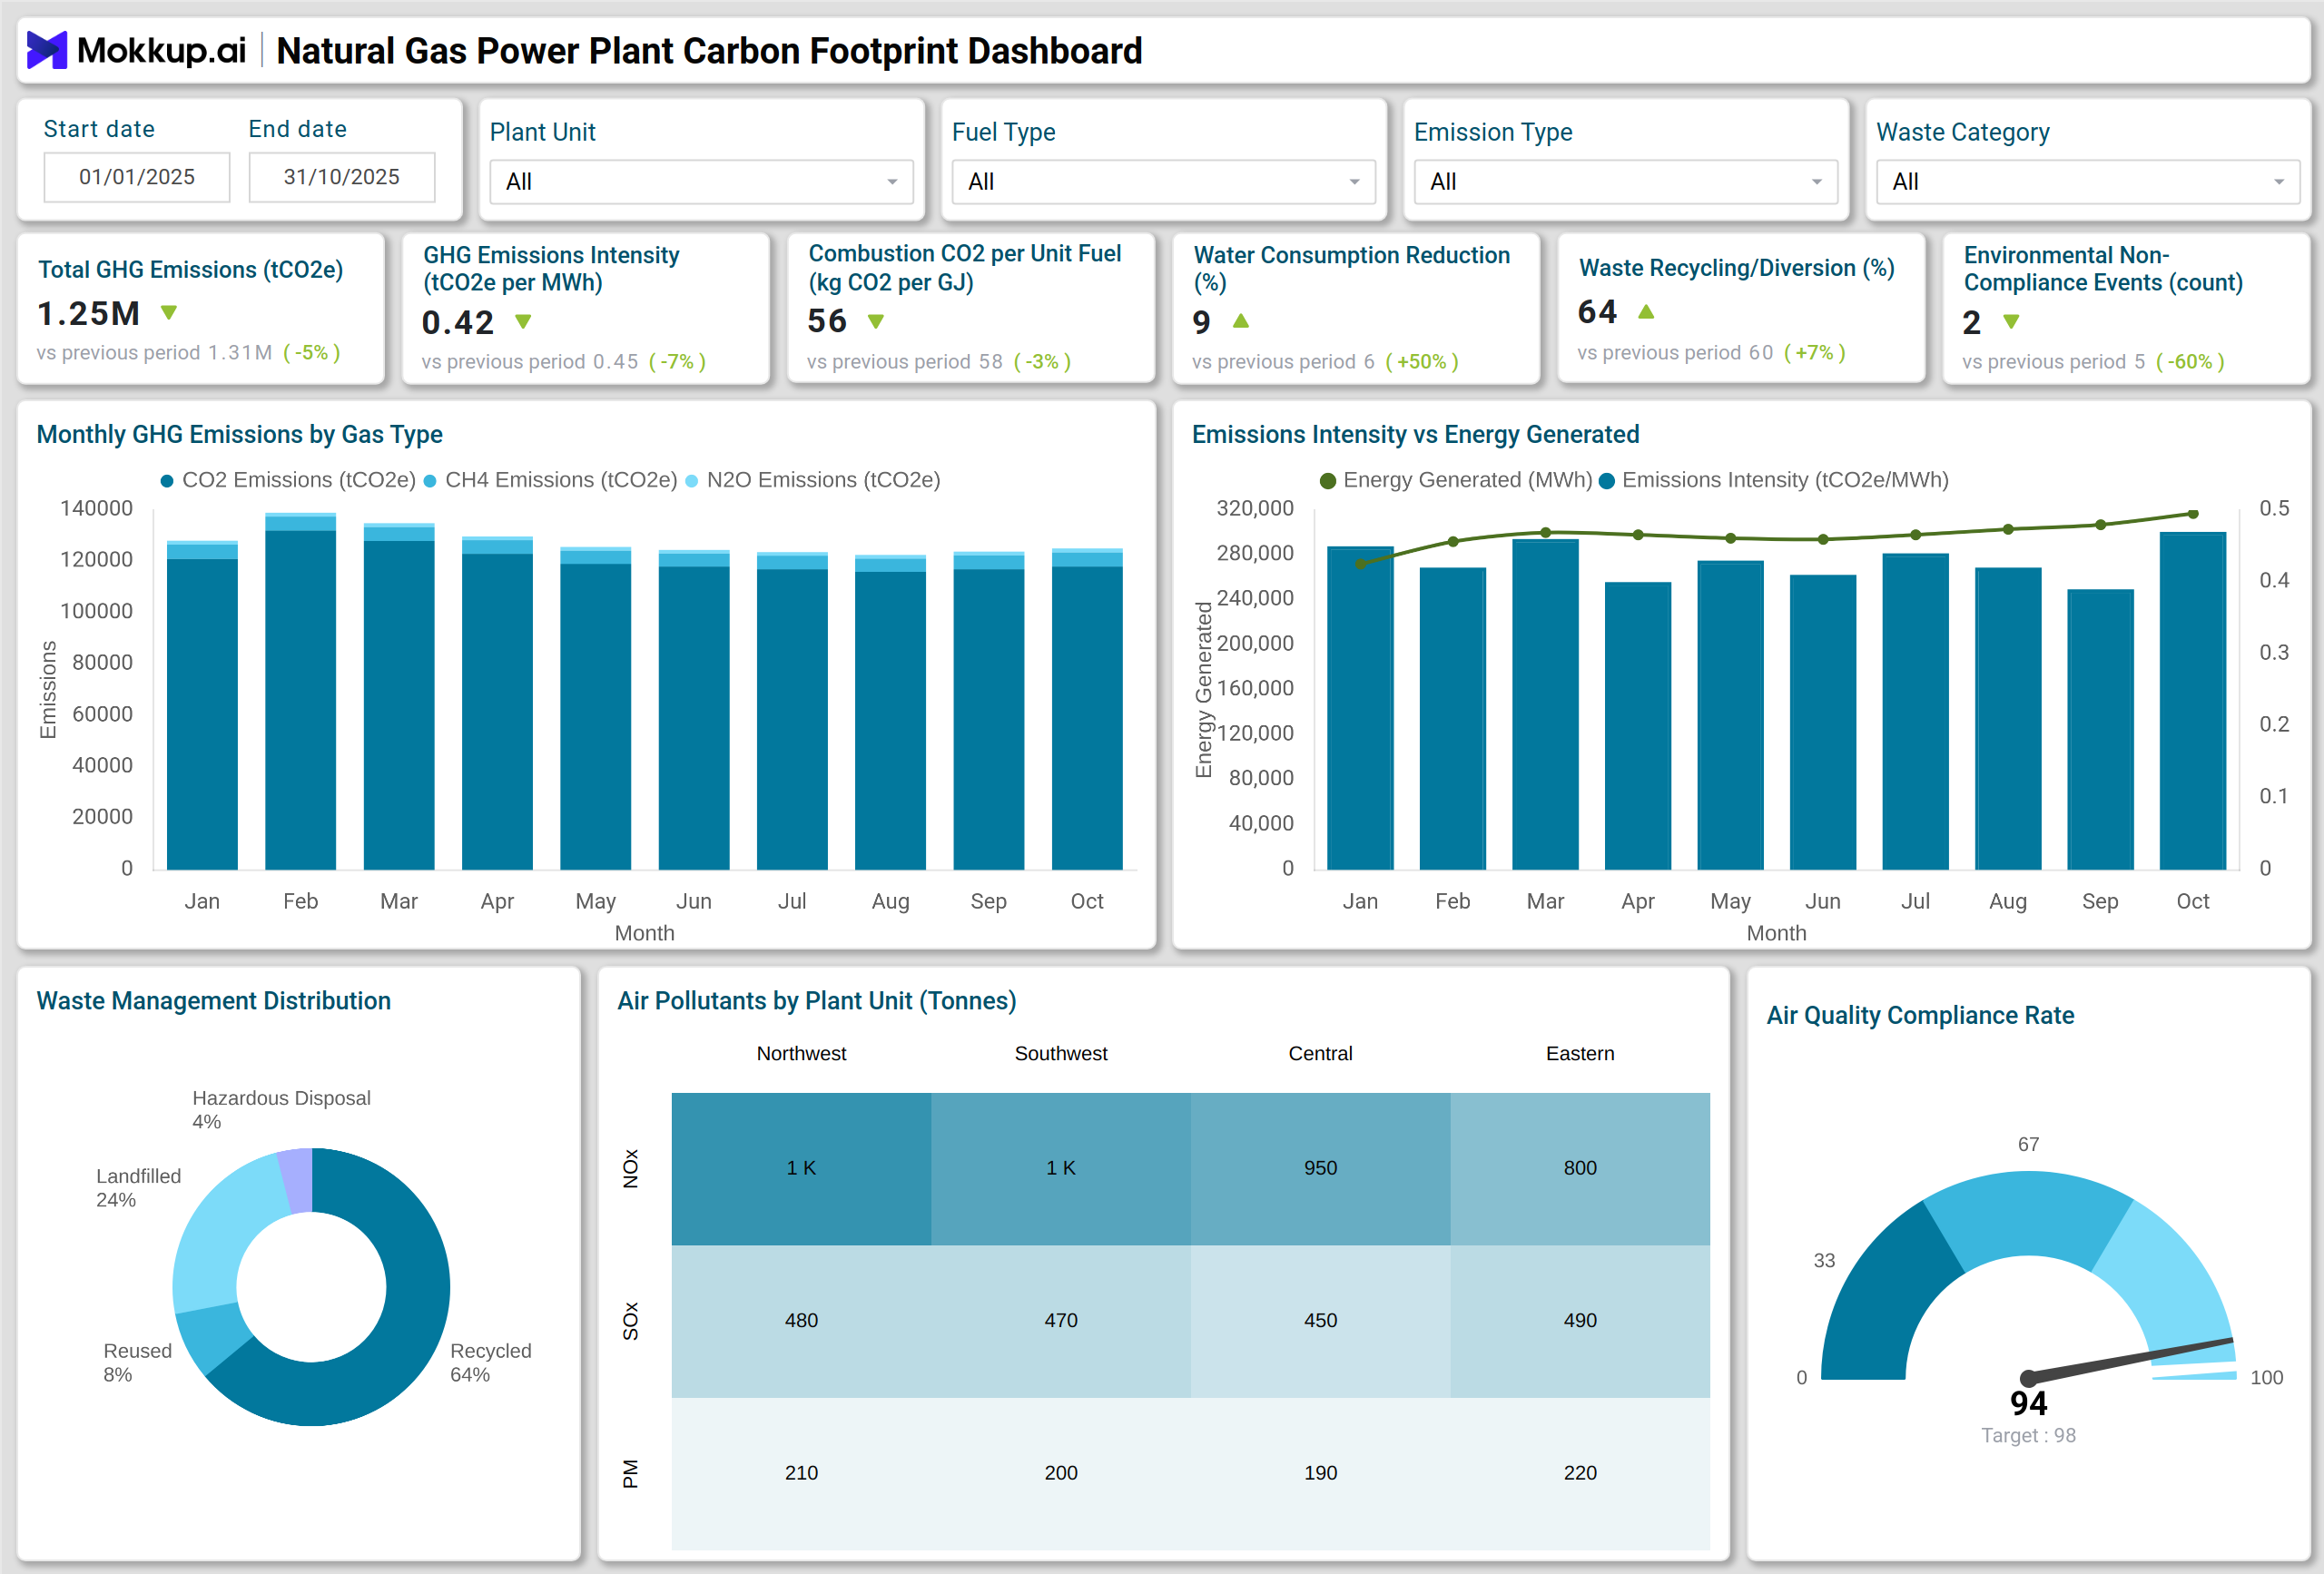
A standard carbon footprint dashboard for natural gas power plants consolidates environmental indicators into visual formats that simplify performance review. Monthly emission totals can be shown in stacked columns that separate CO₂, CH₄, and N₂O, which helps environmental teams identify which gas types require action. A multiple-line chart compares energy production to emission intensity, allowing teams to determine whether higher emissions are due to efficiency losses or shifts in fuel quality.
A donut chart for waste management illustrates the percentage of material that is recycled, reused, landfilled, or classified as hazardous. The heatmap feature compares air pollutants such as NOx, SOx, and particulate matter across different generating units. This structure also provides oversight for methane and CO₂ emissions in natural gas utilities, enabling teams to compare changes across generating units and take corrective action. A gauge chart helps illustrate progress toward air quality compliance goals. Together, these visuals form a greenhouse gas monitoring system for natural gas-fired utilities that supports reporting, audit needs, and sustainability scorecards.
How to Analyze Data in Natural Gas Power Plant Carbon Footprint Dashboards
Here is how you can analyze data from this dashboard:
- Compare monthly emission shifts to changes in fuel composition, turbine load, or maintenance cycles to detect carbon-intensive operations.
- Monitor combustion CO₂ per unit of fuel alongside total GHG output to find energy losses, burner issues, or inefficiencies in turbine firing.
- Track emission intensity per MWh to see how well the plant converts fuel into electricity with lower environmental penalties
- Use heatmap pollutant insights to identify units with high NOx or SOx output and prioritize environmental upgrades or combustion tuning.
- Review water usage trends to measure improvement in cooling processes and identify areas that need conservation measures
- Monitor incident logs to track environmental non-compliance issues, corrective actions, and risk exposure.
- Compare waste recycling or diversion rate with landfill dependency to improve circular waste strategies.
Benefits of Natural Gas Power Plant Carbon Footprint Dashboards
It can act as a carbon footprint tracker, giving a comprehensive view of environmental impact. Here are the benefits to consider:
- Provides measurable sustainability analytics for natural gas electricity producers.
- Helps reduce methane and CO₂ emissions through trend tracking and operational optimization.
- Supports audit and regulatory compliance with documented environmental event tracking.
- Improves transparency for internal environmental reporting and external disclosures.
- Enhances the efficiency of gas turbines by linking emission intensity with power output.
- Assists in building carbon reduction strategies for natural gas power units.
- Strengthens waste diversion and water conservation programs through performance indicators.
- Reduces environmental risk by monitoring pollutant levels and compliance thresholds
- This setup also functions as a KPI dashboard for carbon reduction in natural gas power units, supporting cleaner turbine operations and lower GHG output.
KPIs to Track in Natural Gas Power Plant Carbon Footprint Dashboards
- Total GHG Emissions (tCO₂e): Measures combined CO₂, methane, and nitrous oxide output from power generation.
- GHG Emissions Intensity (tCO₂e per MWh): Shows how much greenhouse gas is emitted per unit of electricity produced.
- Combustion CO₂ per Unit Fuel (kg CO₂ per GJ): Tracks carbon released per unit of fuel energy to assess combustion efficiency.
- Water Consumption Reduction Percent: Measures improvement in cooling and process water conservation.
- Waste Recycling or Diversion Rate Percent: Shows the effectiveness of recycling and waste management programs.
- Environmental Non-Compliance Events (Count): Tracks violations, notices, or reportable environmental incidents.
Frequently Asked Questions
1. Who uses a carbon footprint dashboard for natural gas power plants?
Environmental managers, plant supervisors, ESG teams, compliance auditors, and corporate sustainability departments.
2. How does it support greenhouse gas reduction?
By tracking CO₂, methane, and N₂O emissions, teams can identify trends, address combustion inefficiencies, and upgrade equipment to reduce carbon intensity.
3. Can this dashboard support ESG reporting?
Yes. It includes emission totals, pollutant levels, compliance events, and waste handling, all of which appear in ESG disclosure frameworks.
4. What environmental risks does it help reduce?
Non-compliance events, high pollutant concentrations, inefficient fuel usage, cooling water waste, and landfill dependency.