What is a Natural Gas Plant Cost & Profitability Dashboard?
A Natural Gas Plant Cost & Profitability Dashboard is a specialized financial analytics tool designed for electric power utilities engaged in natural gas-fired power generation. It provides a unified view of cost components, revenue streams, and profitability ratios that define the financial performance of generation assets. This dashboard enables plant managers, finance teams, and executives to track how operational factors such as fuel costs, operating and maintenance (O&M) expenses, and power sales impact profitability. By visualizing cost efficiency and revenue contribution, it becomes easier to identify areas that require optimization or cost control. The tool supports profitability tracking for gas power generation and serves as a financial performance dashboard for natural gas utilities, ensuring each decision is based on measurable and comparable metrics.
How to Create a Natural Gas Plant Cost & Profitability Dashboard
You don’t need to build your report from scratch—just start with a ready-to-use dashboard template from Mokkup. Add in your data and export it however you like. Here’s how to do it:
1. Create or Log in to Your Mokkup Account
Start by signing up on Mokkup.ai using your email. If you already have an account, just log in, and you’ll be good to go.
2. Choose and Customize Your Dashboard Template
Find the Natural Gas Plant Cost & Profitability Dashboard template in the Templates section. Use the drag-and-drop editor to adjust KPIs, edit filters, or add elements based on your data.
3. Export to Your BI Tool
Once your dashboard wireframe is ready, use the BI Tool Export feature to send it directly to Power BI or Tableau for further analysis and enhancements. You can also download the dashboard as a PDF, PNG, or JPEG, embed it on a platform, or invite your team to collaborate.
Note: This is a Pro template. You’ll need a Pro subscription on Mokkup to use and customize this dashboard wireframe. Upgrade anytime to unlock full access.
Natural Gas Plant Cost & Profitability Dashboard Example
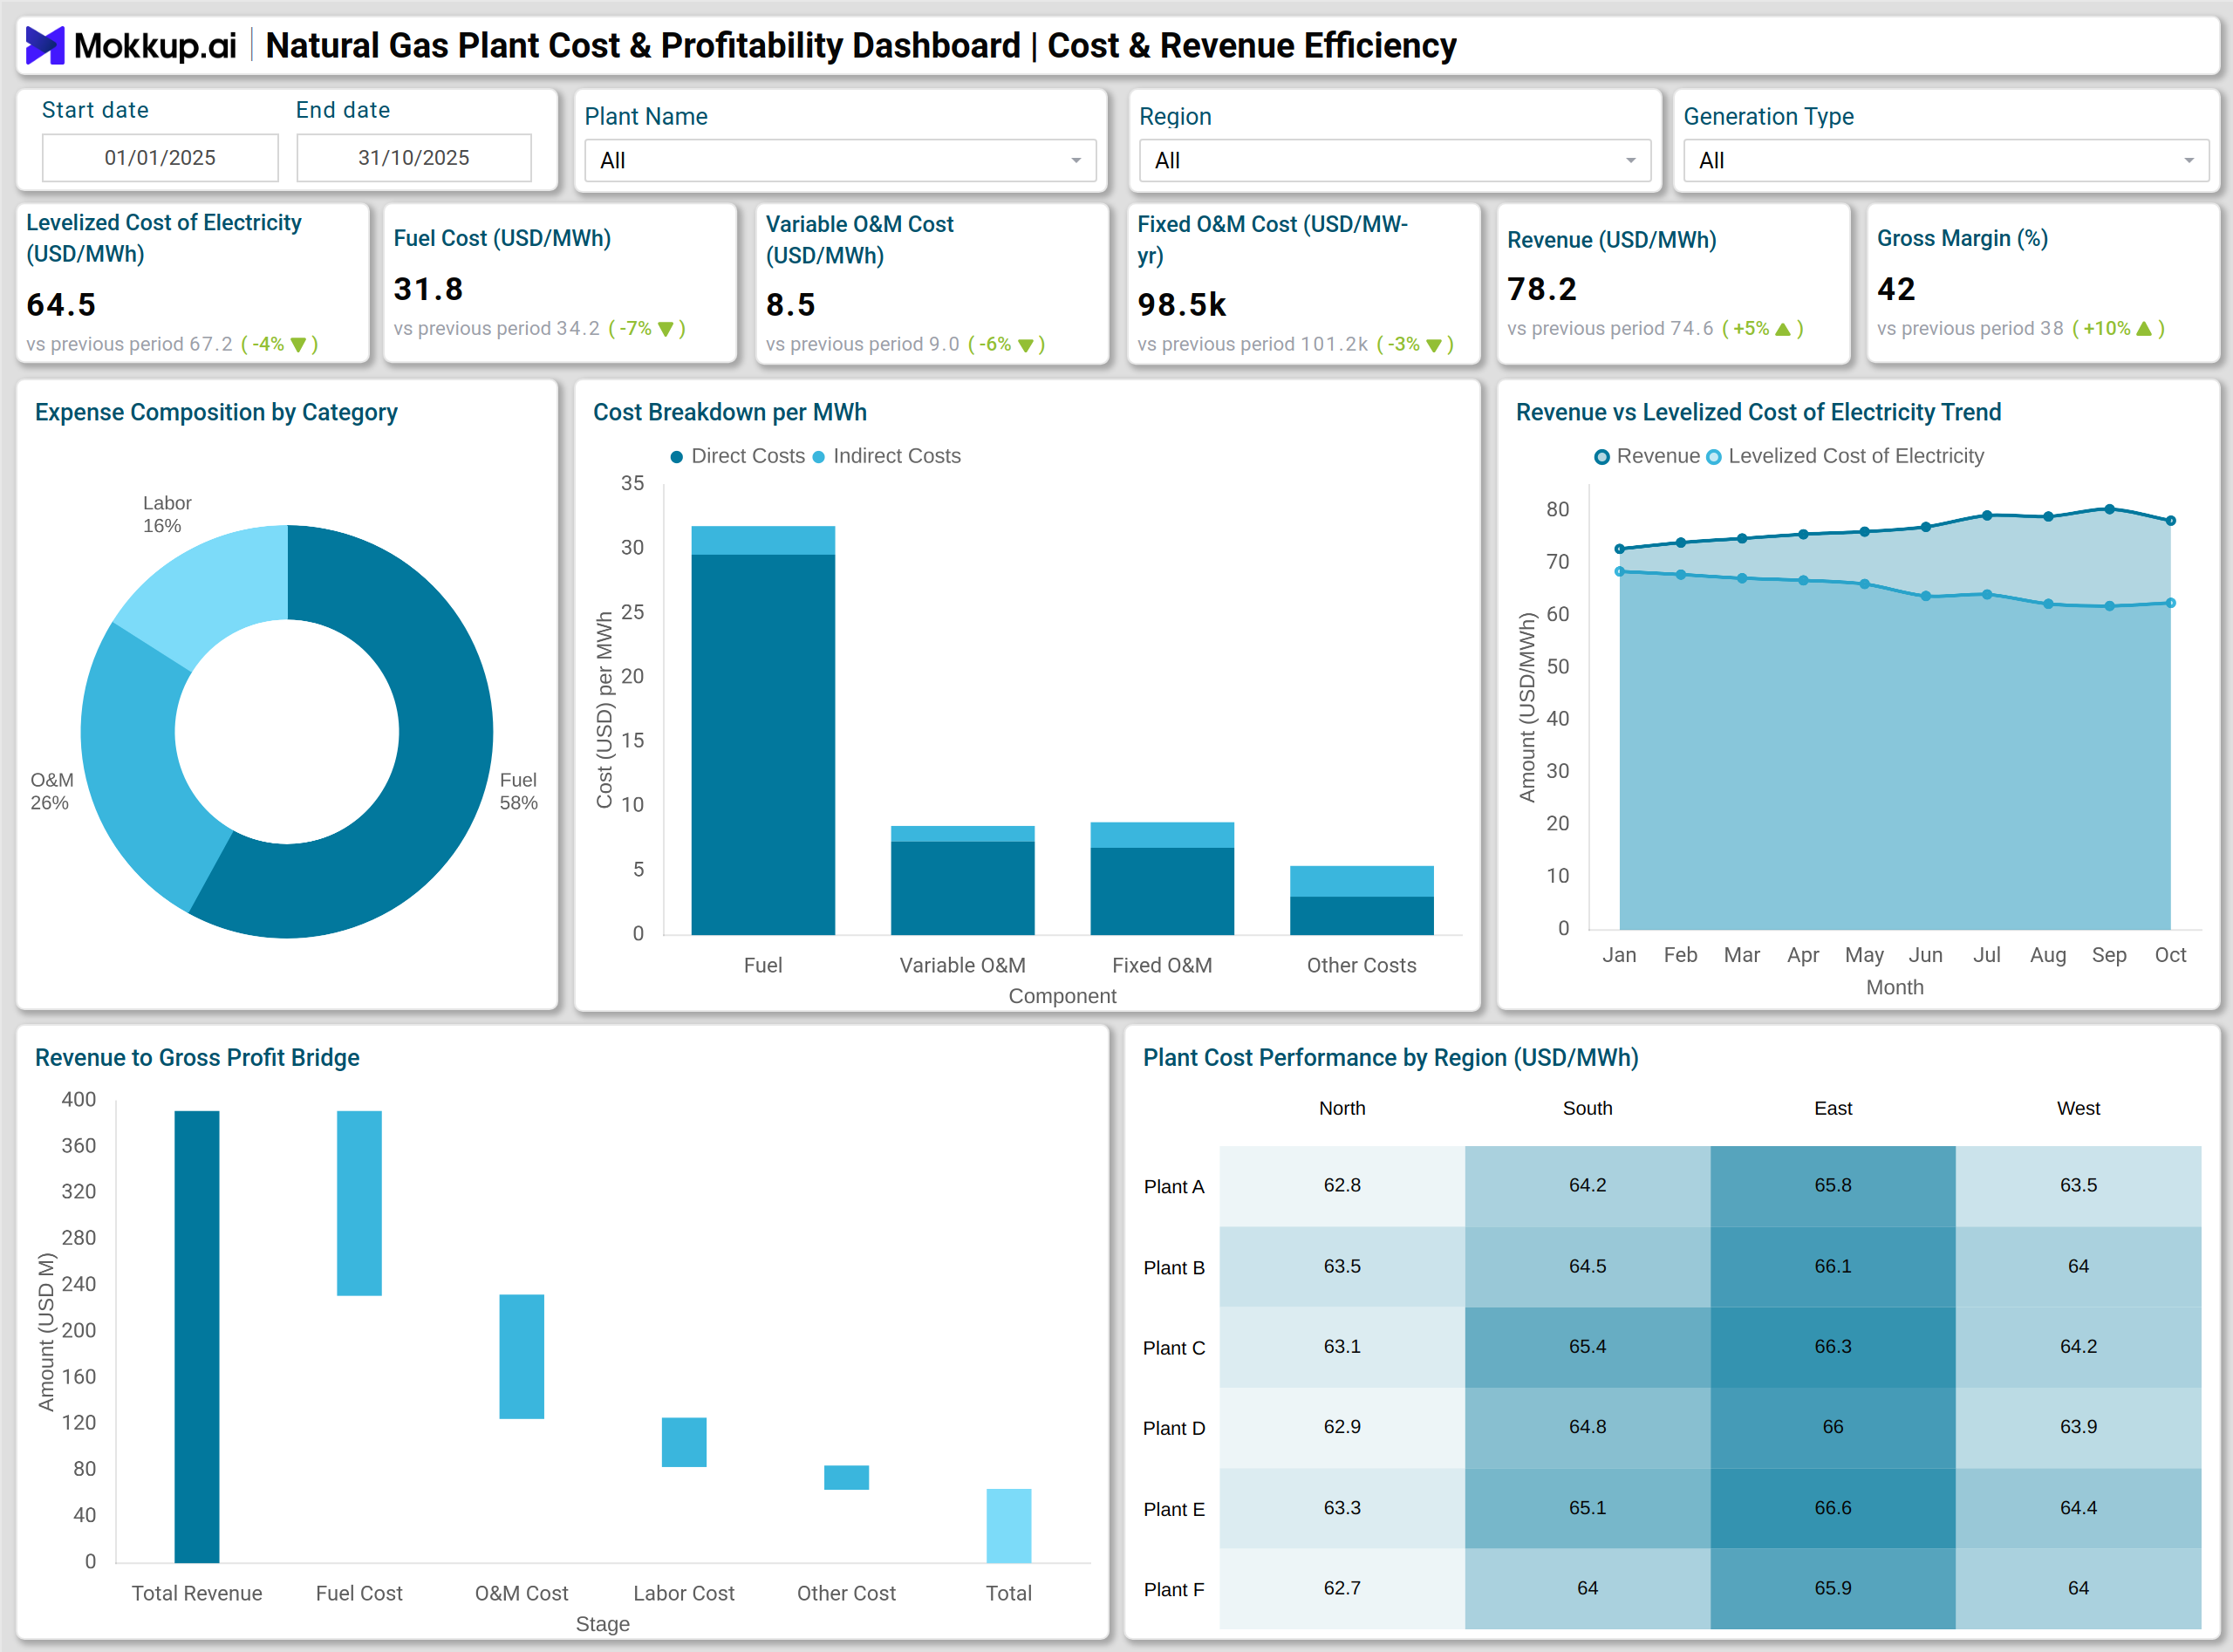
A well-structured natural gas plant cost analysis dashboard typically consolidates key metrics, including fuel cost per MWh, O&M costs, and revenue performance, into a single, intuitive visual interface. The layout often includes cost breakdowns, margin trends, and profitability indicators like EBITDA and ROE.
For example, a power plant cost and profitability visualization tool may use a stacked column chart to illustrate the contribution of various cost components, such as fuel, operations, labor, and others, to the total cost per MWh. Line charts compare revenue and LCOE trends over time, providing quick insight into shifts in profitability. Additional visuals, such as waterfall and combo charts, display the flow from revenue to gross and net profits, while gauge charts highlight operating margin performance against targets.
This structured presentation helps stakeholders pinpoint inefficiencies, evaluate cost efficiency monitoring in gas-fired power plants, and make informed operational finance decisions to sustain long-term profitability.
How to Analyze Data in Natural Gas Plant Cost & Profitability Dashboards
Here is how you can analyze data from this dashboard:
- Evaluate Generation Cost Trends: Monitor the Levelized Cost of Electricity (LCOE) and Fuel Cost per MWh to determine how plant efficiency and fuel pricing influence total cost.
- Compare Revenue vs. Cost Metrics: Use line and combo charts to assess how Revenue per MWh tracks against LCOE and EBITDA trends.
- Examine Expense Composition: Review pie and stacked column charts to understand which categories, fuel, labor, or O&M, dominate total expenses.
- Assess Profitability Ratios: Analyze Gross Margin Percentage, Operating Margin Percentage, and Profit per MWh to determine profitability across different time periods.
- Track operational finance metrics for natural gas generation, such as EBITDA Margin and Profit per MWh, to link operations to financial outcomes.
- Review Financial Strength Indicators: Use metrics such as DSCR, Payback Period, and ROE to measure investment performance and project sustainability.
- Identify Regional or Asset-Level Variations: Heatmaps and treemaps help compare LCOE and revenue contribution across multiple plants or business units.
Benefits of Natural Gas Plant Cost & Profitability Dashboards
- Comprehensive Cost Transparency: Visualizes total generation cost and identifies inefficiencies in major expense areas.
- Enhanced Profitability Tracking: Links cost drivers directly to financial outcomes for improved decision-making.
- Better Investment Evaluation: Provides insights into key return metrics, such as ROE and Payback Period, to inform capital allocation decisions.
- Efficient Operational Benchmarking: Enables cross-plant performance comparison through standard financial indicators.
- Supports Strategic Planning: Informs asset managers and finance teams with accurate cost and profitability insights for long-term planning.
KPIs to Track in Natural Gas Plant Cost & Profitability Dashboards
- Levelized Cost of Electricity (LCOE): Measures total cost per unit of energy produced over the asset’s lifetime.
- Fuel Cost per MWh: Tracks variable cost contribution of fuel in power generation.
- Variable O&M Cost per MWh: Reflects operating expenses that vary with production output.
- Fixed O&M Cost per MW-year: Represents the baseline maintenance costs associated with plant capacity.
- Revenue per MWh: Indicates sales efficiency per unit of energy generated.
- Gross Margin Percent: Shows profitability before indirect expenses.
- EBITDA Margin Percent: Evaluates operational profit after accounting for key expenses.
Frequently Asked Questions
1. What is the purpose of a Natural Gas Plant Cost & Profitability Dashboard?
It helps monitor and evaluate financial performance across generation assets, ensuring efficient cost management and profitability tracking for gas power generation.
2. Who uses this dashboard in electric power utilities?
Finance managers, plant operators, and strategic planners in natural gas-fired utilities use it to analyze costs, margins, and returns.
3. How does it improve cost efficiency monitoring in gas-fired power plants?
By providing clear visualization of cost breakdowns, operational metrics, and margin trends, it helps identify areas for cost reduction and performance improvement.
4. Can this dashboard be customized for multiple plants or regions?
Yes, metrics can be segmented by plant, region, or business unit to compare performance and profitability variations across the utility network.