
What is a Natural Gas Meter Health Management Dashboard
A Natural Gas Meter Health Management Dashboard is a specialized visualization platform designed to monitor, analyze, and optimize the performance, reliability, and lifecycle of gas metering assets across distribution networks. It consolidates critical meter health metrics, including meter failure rates, meter health index, mean time between failures (MTBF), mean time to repair (MTTR), average meter age, and total meters in operation, into a unified, real-time interface. By integrating gas meter health monitoring, meter failure rate analysis, predictive maintenance for gas meters, and meter lifecycle management, this dashboard enables metering managers, asset reliability engineers, field service teams, and utility leadership to proactively identify failing meters, optimize maintenance schedules, extend asset life, reduce non-revenue gas, and ensure accurate customer billing. It serves as a central command center for data-driven metering asset management and reliability optimization.
How to Create a Natural Gas Meter Health Management Dashboard
You don’t need to build your report from scratch, just start with a ready-to-use dashboard template from Mokkup. Add in your data and export it however you like. Here’s how to do it:
1. Create or Log in to Your Mokkup Account
Start by signing up on Mokkup.ai using your email. If you already have an account, just log in, and you’ll be good to go.
2. Choose and Customize Your Dashboard Template
Find the Natural Gas Meter Health Management Dashboard template in the Templates section. Use the drag-and-drop editor to adjust KPIs, edit filters, or add elements based on your data.
3. Export to Your BI Tool
Once your dashboard wireframe is ready, use the BI Tool Export feature to send it directly to Power BI or Tableau for further analysis and enhancements. You can also download the dashboard as a PDF, PNG, or JPEG, embed it on a platform, or invite your team to collaborate.
Note: This is a Pro template. You’ll need a Pro subscription on Mokkup to use and customize this dashboard wireframe. Upgrade anytime to unlock full access.
Natural Gas Meter Health Management Dashboard Example
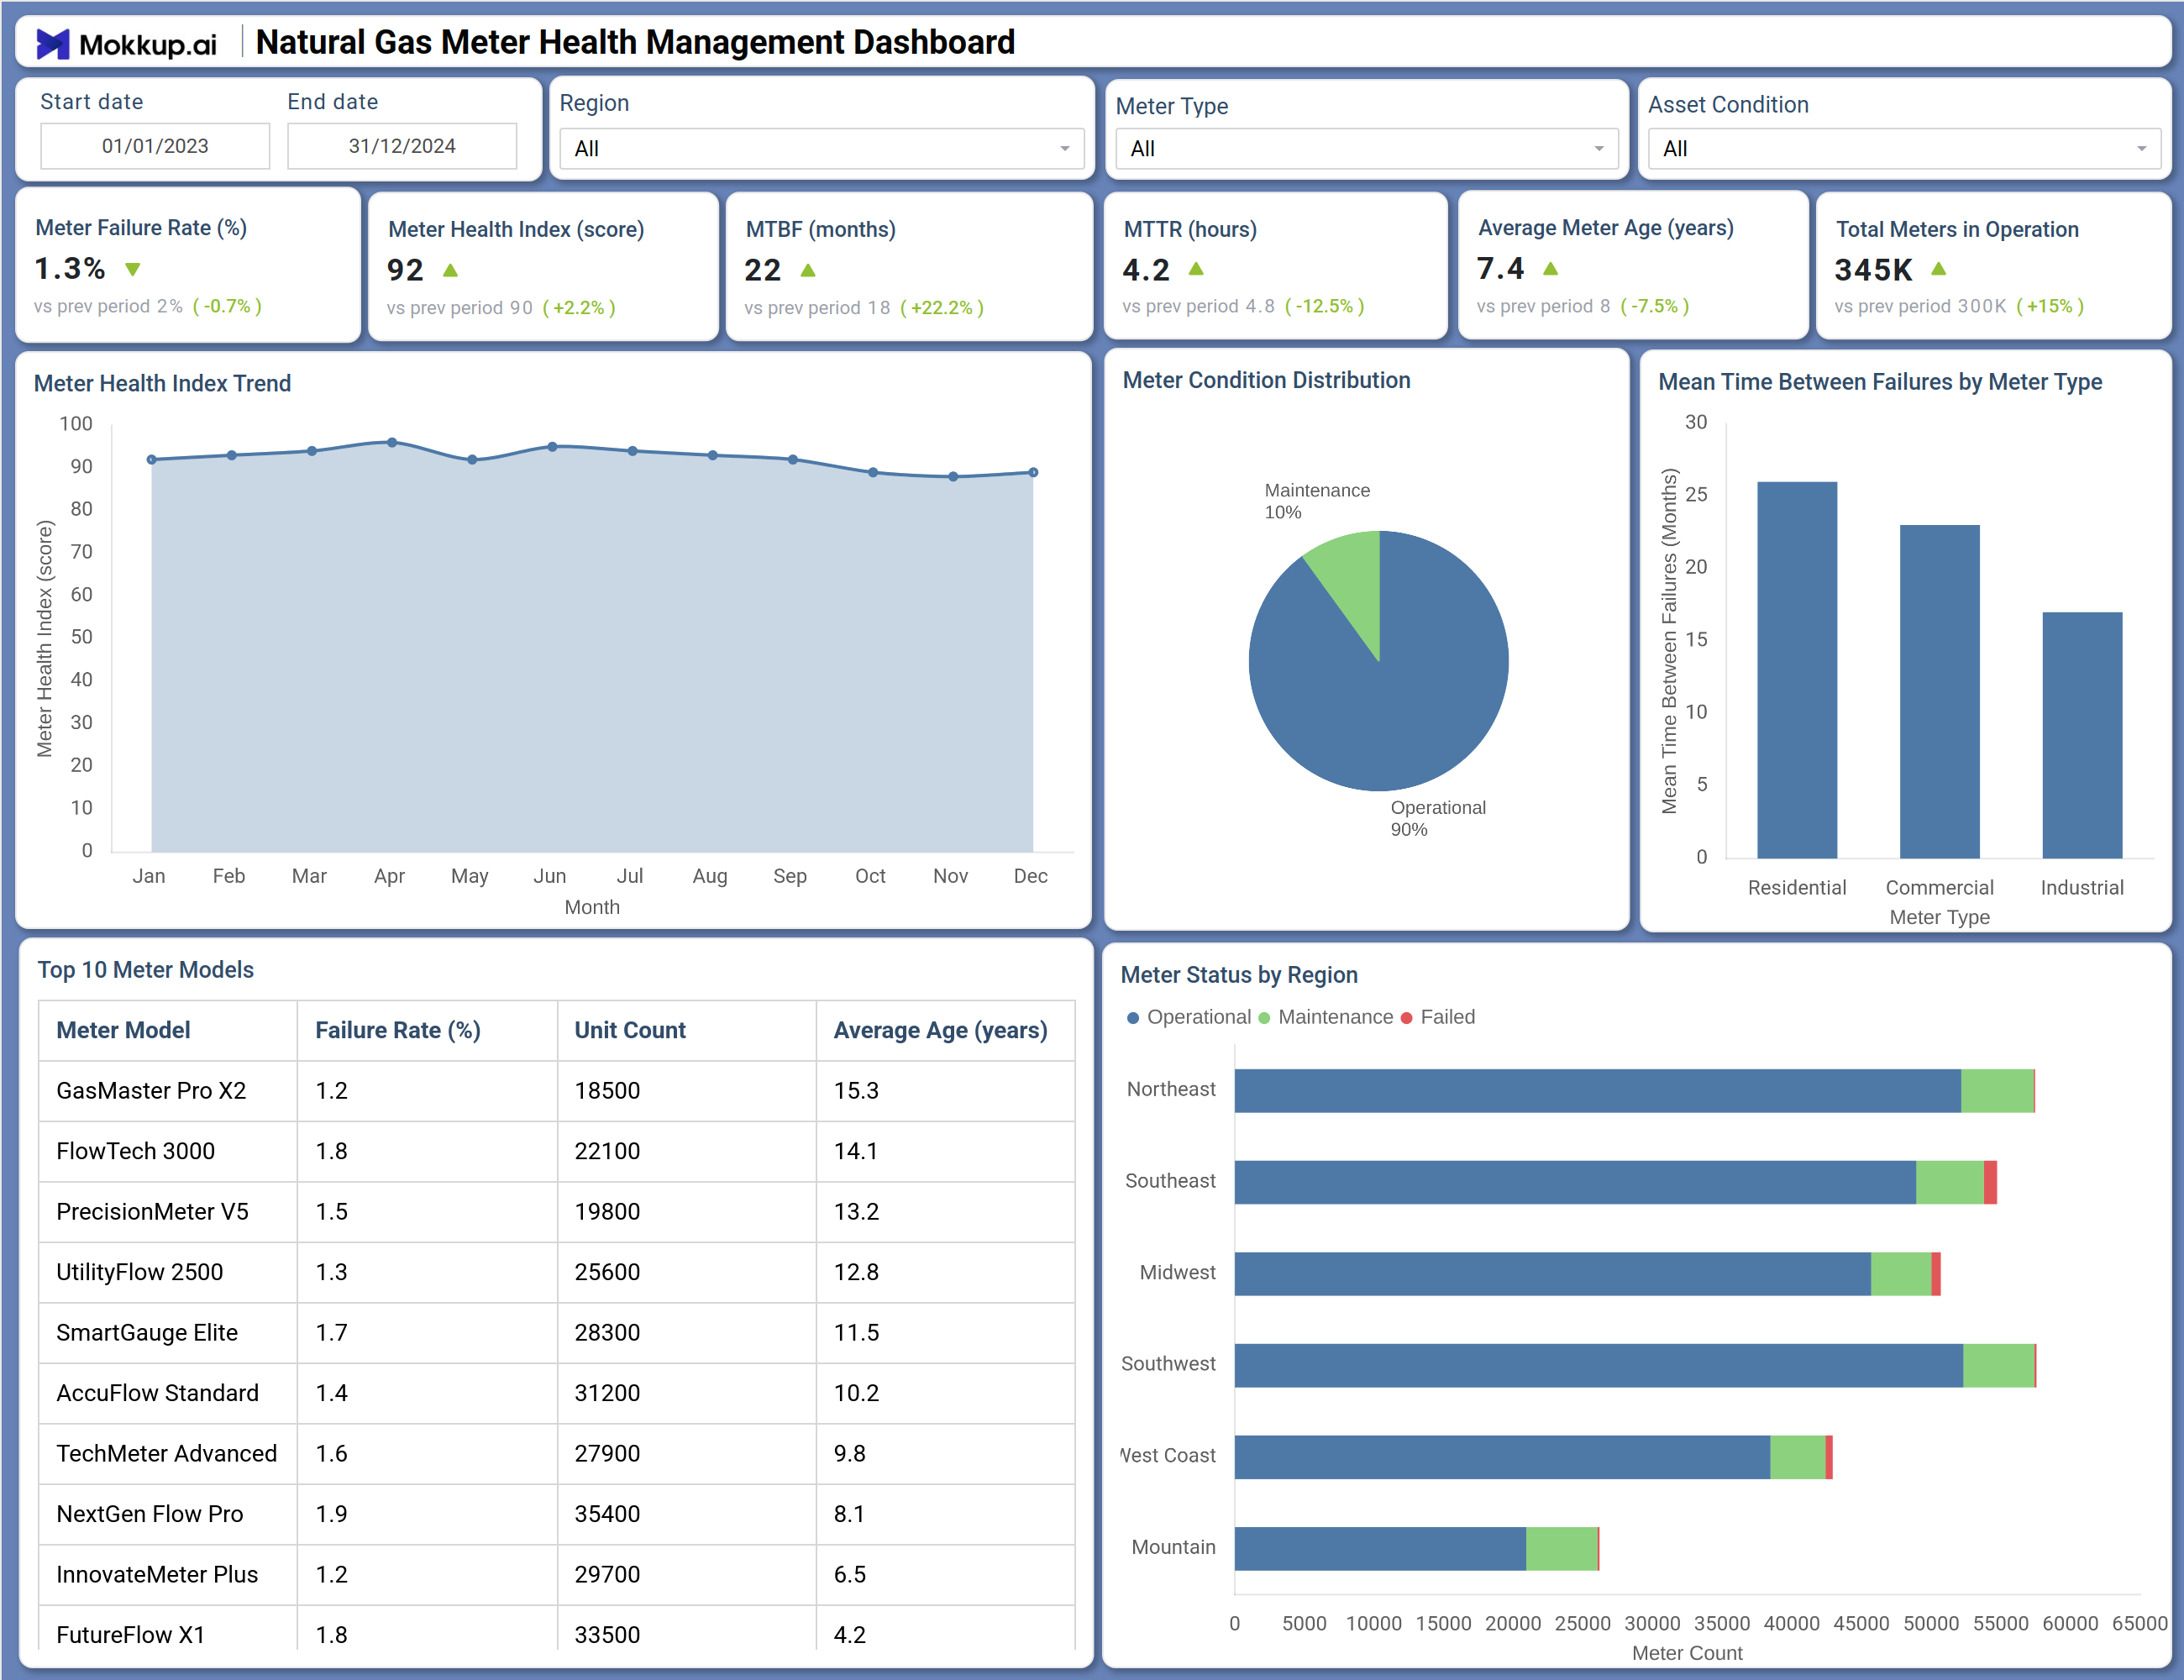
This dashboard delivers a comprehensive view of metering asset health and performance across natural gas distribution networks. The Overview screen prominently displays six critical meter health KPIs: Meter Failure Rate at 1.3% (improved from 2% in prior period), Meter Health Index at 92 (up 2.2 points), Mean Time Between Failures (MTBF) at 22 months (22.2% improvement), Mean Time to Repair (MTTR) at 4.2 hours (12.5% faster), Average Meter Age at 7.4 years (7.5% reduction), and Total Meters in Operation at 345K (15% increase).
The Meter Health Index Trend chart tracks monthly health scores, revealing patterns and identifying periods of degradation requiring attention. Meter Condition Distribution provides a breakdown of meter status across Operational, Maintenance, and Failed categories by meter type (Residential, Commercial, and Industrial), enabling targeted intervention strategies. The Top 10 Meter Models by Failure Rate table lists specific meter models with their failure rates, unit counts, and average ages—critical data for procurement decisions and replacement programs. Models include GasMaster Pro X2 (1.2% failure rate, 15.3 years average age), FlowTech 3000 (1.8%, 14.1 years), and FutureFlow X1 (1.8%, 4.2 years), revealing age versus performance relationships. Meter Status by Region provides geographic visibility into operational, maintenance, and failed meters across the Northeast, Southeast, Midwest, Southwest, West Coast, and Mountain regions, enabling regional performance benchmarking and resource allocation. Together, these components enable gas meter reliability tracking, predictive maintenance planning, and data-driven meter asset management.
How to Analyze Data in a Natural Gas Meter Health Management Dashboard
Here is how you can analyze data from this dashboard:
- Monitor Meter Failure Rate (%) over time to assess overall metering reliability and identify negative trends requiring investigation.
- Track Meter Health Index (score) as a composite measure of meter condition and predictor of future failures.
- Review Mean Time Between Failures (MTBF) (months) to understand meter reliability by type, model, or region and target improvement efforts.
- Analyze Mean Time to Repair (MTTR) (hours) to evaluate field service efficiency and identify bottlenecks in repair processes.
- Examine Average Meter Age (years) to assess the aging profile of the meter population and plan replacement programs.
- Evaluate Total Meters in Operation to understand the scale of metering assets and growth trends.
- Use the Meter Health Index Trend chart to correlate health scores with seasonal patterns, maintenance activities, or replacement programs.
- Drill into Meter Condition Distribution to understand the proportion of meters in operational, maintenance, and failed states by customer type.
- Analyze the Top 10 Meter Models by Failure Rate table to identify underperforming models for targeted replacement or vendor remediation.
- Compare failure rates against average age to distinguish between age-related degradation and model-specific design issues.
- Review Meter Status by Region to identify geographic areas with elevated failure rates or maintenance backlogs requiring additional resources.
Benefits of a Natural Gas Meter Health Management Dashboard
The following are the benefits of using this dashboard:
- Provides centralized, real-time visibility into meter health and performance across the entire distribution network.
- Enables predictive maintenance by identifying meters with declining health scores before they fail.
- Reduces non-revenue gas through early detection of failing meters that may under-register consumption.
- Improves field service efficiency by prioritizing maintenance based on meter condition and failure probability.
- Optimizes meter replacement programs by identifying underperforming models and age-based replacement candidates.
- Enhances customer satisfaction through reduced billing errors and service disruptions from meter failures.
- Supports data-driven procurement decisions by tracking failure rates by meter model and manufacturer.
- Demonstrates regulatory compliance with metering accuracy and reliability standards through auditable performance data.
KPIs to Track in a Natural Gas Meter Health Management Dashboard
The following key KPIs can be tracked by using this dashboard:
- Meter Failure Rate: Percentage of meters that have failed within the reporting period.
- Meter Health Index (score): Composite score (0-100) reflecting overall meter condition and predicted reliability.
- Mean Time Between Failures (MTBF) (months): Average operating time between meter failures.
- Mean Time to Repair (MTTR) (hours): Average time required to repair or replace a failed meter.
- Average Meter Age (years): Mean age of all meters in operation.
- Total Meters in Operation: Total count of active metering assets.
- Meter Condition Distribution: Percentage of meters in Operational, Maintenance, and Failed states.
- Failure Rate by Meter Model: Breakdown of failure rates for top meter models.
- Meter Status by Region: Geographic distribution of meter conditions.
- Meter Type Distribution: Count of meters by type (Residential, Commercial, Industrial).
- Meters Past Expected Life: Number and percentage of meters operating beyond their design life.
Frequently Asked Questions
1. What is the purpose of this Natural Gas Meter Health Management Dashboard?
This dashboard provides a centralized view of metering asset health, performance, and reliability across natural gas distribution networks. It helps metering managers track failure rates, monitor meter condition, optimize maintenance schedules, and plan replacement programs to ensure accurate billing and reliable service.
2. How does this dashboard help reduce meter failure rates?
By tracking failure rates by meter model, age, and region, the dashboard enables targeted interventions such as proactive replacement of underperforming models, increased inspection frequency for high-risk meters, and data-driven procurement decisions to avoid problematic models in the future.
3. What is the difference between MTBF and MTTR and why are both important?
MTBF (Mean Time Between Failures) measures meter reliability—how long meters operate before failing. Higher MTBF indicates better reliability. MTTR (Mean Time to Repair) measures maintenance efficiency—how quickly failed meters are restored to service. Lower MTTR indicates more efficient field operations. Both are essential for comprehensive meter health management.
4. What types of meters can be tracked in this dashboard?
The dashboard can track all common gas meter types, including diaphragm meters, rotary meters, turbine meters, ultrasonic meters, and smart meters across residential, commercial, and industrial customer classes.
5. Who typically uses this dashboard?
Metering managers, asset reliability engineers, field service supervisors, operations planners, procurement specialists, and utility asset management leadership use this dashboard to oversee meter health and drive performance improvement.